Omar H. Salim* | Yasir M.Y. Ameen
© 2026 The authors. This article is published by IIETA and is licensed under the CC BY 4.0 license (http://creativecommons.org/licenses/by/4.0/).
OPEN ACCESS
Electric-vehicle (EV) direct-current (DC) fast charging in weak distribution networks must handle outages, variable photovoltaic (PV) generation, and concentrated service demand without violating service or storage limits. This paper proposes a Whale Optimization Algorithm (WOA)-tuned fuzzy-weighted supervisory energy management system (EMS) for a PV/grid/supercapacitor-assisted fast-charging station in Mosul, Iraq. The MATLAB model represents a 150 kWp PV array, a 60 kW grid interface, one 60 kW DC outlet, a two-EV queue, and a 30 kWh-class supercapacitor. Grid availability is modeled as a binary connection state, while voltage and frequency deviations form a continuous grid-quality index for stress-aware routing. WOA tunes eight fuzzy output parameters using a service-priority objective. For a 24 h stress day with three outage windows totaling 6 h, the proposed EMS completes 8/10 EV targets compared with 7/10 for rule-based and expert-fuzzy baselines (+14.3%). The unserved EV energy is 104.92 kWh, and all routed-path feasibility checks pass. Across 30 Monte Carlo perturbations, the controller completes 7.40 EVs on average (standard deviation = 0.56, median = 7, and 95th percentile = 8). The results show that fuzzy-weighted supervisory routing can improve EV service delivery in outage-prone weak-grid regions.
electric vehicle charging station, fuzzy energy management, whale optimization algorithm, weak grid, supercapacitor, vehicle-to-grid
Weak-grid electric-vehicle (EV) charging is both a service-capacity and supervisory routing problem. The challenge is strongest when recurrent outages, voltage-quality limits, and compressed EV arrivals occur together. Iraq is a relevant stress context: the International Energy Agency (IEA) reports persistent electricity-sector challenges and supply constraints [1], the International Renewable Energy Agency (IRENA) highlights transition-readiness and renewable-integration gaps [2], and recent modelling work confirms the continuing mismatch between power supply and demand [3]. Mosul is used as the regional basis for a synthetic stress scenario designed to test energy management system (EMS) behavior under recurrent outage and weak-grid operating constraints.
The electric vehicle charging station (EVCS) contains a photovoltaic (PV) source, a supercapacitor (SC), one EV outlet, and a grid interface. State of charge (SOC) is given in percent, vehicle-to-grid (V2G) denotes controlled EV discharge during support events, and per-unit (p.u.) denotes normalized quantities.
Recent EVCS and renewable-assisted charging literature covers EVCS architectures and converter/control strategies [4], PV-assisted EVCS requirements and coordination issues [5], ultra-fast charging converter topologies and control techniques [6], EMS classification for EV charging stations [7], market and grid-interaction aspects [8], and V2G services and ancillary-service participation [9-11]. These studies establish the broader research context. However, implementation-oriented studies are still limited in how they represent weak-grid operation, especially when complete outages, voltage/frequency quality degradation, EV service priority, and storage support must be handled simultaneously.
This work separates grid connection from grid quality. Binary grid status blocks all grid import/export paths during outages, while voltage and frequency quality guide stress-reduction and limited SC/EV support during connected weak-grid periods. The use of voltage and frequency as supervisory grid-quality indicators is consistent with EN 50160 voltage-characteristic requirements for public electricity networks [12]. The main contributions are: (i) binary-outage modeling with separate voltage/frequency quality indicators, (ii) fuzzy-weighted port-to-port routing through a four-port matrix, (iii) Whale Optimization Algorithm (WOA) tuning of eight output parameters using a service-priority objective, (iv) routed-path feasibility checks, and (v) Monte Carlo robustness analysis with paired same-seed baseline comparison.
Table 1 positions the present work relative to selected implementation-oriented studies by comparing system configuration, grid-stress representation, control/service evaluation, and the complementary focus addressed here.
Table 1. Technical positioning of selected electric-vehicle (EV) charging station energy management system (EMS) studies
|
Study/Year |
System and Storage |
Grid-Stress Representation |
Control and Service Evaluation |
Complementary Focus of the Present Work |
|
[13], 2023 |
Photovoltaic (PV)-EV charging; storage not the main focus |
Weak-grid-oriented operation |
EMS dispatch strategy |
Adds explicit binary outage blocking, grid-quality-based routing, and routed-path feasibility auditing |
|
[14], 2023 |
PV/grid EV charging with hybrid storage context |
Grid-connected operation with storage coordination |
Storage-control strategy |
Extends the analysis toward queue-level EV service assessment under outage-constrained operation |
|
[15], 2023 |
PV-EV DC microgrid with fuzzy EMS |
Fuzzy EMS for PV-assisted EV charging |
Fuzzy control weights/rules |
Builds on fuzzy EMS concepts by adding binary outage status, continuous grid-quality indexing, and same-seed robustness evaluation |
|
[16], 2024 |
PV plus energy-storage EV charging |
Optimization under resource-constrained operation |
Particle swarm optimization (PSO)-based sizing/operation variables |
Complements sizing-oriented optimization with supervisory port-to-port routing feasibility and target-SOC service tracking |
|
[17], 2025 |
Renewable EV charging in DC microgrid |
Renewable-assisted DC microgrid operation |
Fuzzy EMS parameters |
Extends recent fuzzy EMS work toward finite-queue service evaluation, outage blocking, and weak-grid support constraints |
|
Proposed work |
PV/grid/supercapacitor (SC) EV fast-charging station |
Binary outages plus continuous voltage/frequency quality index |
Whale Optimization Algorithm (WOA) tunes eight fuzzy output parameters: one 60 kW outlet, two EV queues, target completion, and unserved kWh |
Provides service-priority routing with feasibility checks, Monte Carlo robustness, and explicit service-bottleneck interpretation |
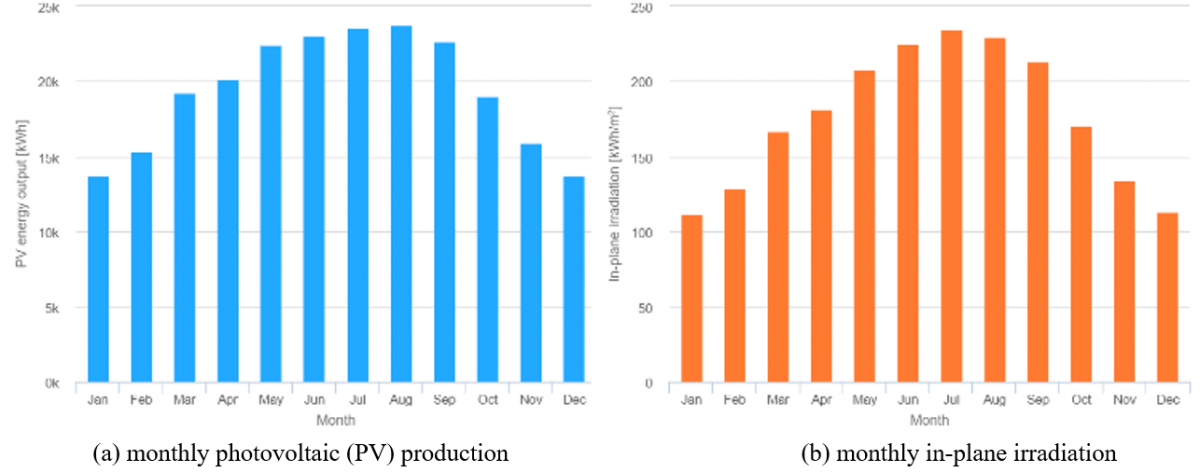
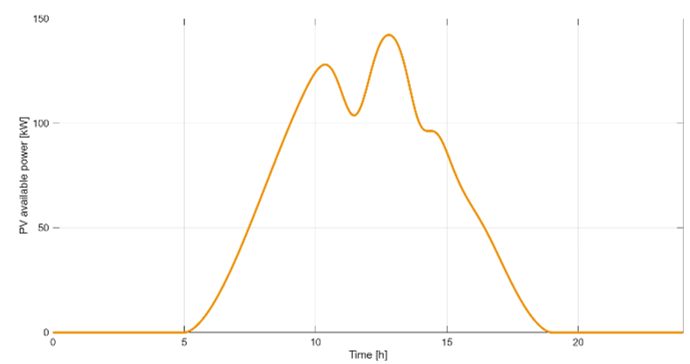
The PV envelope was benchmarked against Photovoltaic Geographical Information System (PVGIS)-SARAH3 [18] for Mosul, Iraq (36.339° N, 43.141° E). For a 150 kWp crystalline-silicon system at 30° tilt, PVGIS gives 232,807.64 kWh/year, 1,552.05 kWh/kWp/year, 2,119.04 kWh/m²/year in-plane irradiation and 26.76% total losses; regional studies support this range [19]. Monthly PV production ranges from 13.73 MWh in January to 23.77 MWh in August, while in-plane irradiation ranges from 111.98 to 234.64 kWh/m². PVGIS is used as an external benchmark; Figure 1 shows the monthly PV production and irradiation. The EMS stress day uses a near-peak summer PV profile rather than the PVGIS annual mean of about 638 kWh/day. This intentionally stresses PV-versus-load mismatch. In the revised EMS, exportable surplus is routed to the grid when the feeder is connected, subject to the grid-quality-dependent export derating rule; the remaining value is therefore residual PV curtailment after local EV charging, SC absorption and conditional grid export. For clarity, the 24 h PV profile used in the EMS simulation is generated from the normalized summer stress-day curve used in the MATLAB model, not from the PVGIS annual-average daily energy. Its integrated available PV energy is 1006.36 kWh with a peak available power of 142.27 kW. This value is 1.58 times the PVGIS annual-average daily production of 637.83 kWh/day (232807.64 kWh/year divided by 365). The updated simulation blocks photovoltaic-to-grid export during complete outages, permits full export when $q_g>=q_{export,full}=0.90$, derates export when $0.60<=q_g<0.90$ and blocks export only under severe grid-quality violation $q_g<$q_{\text {export,critical}}=0.60$. The corresponding 24 h profile is shown in Figure 2.
Figure 1. PVGIS-SARAH3 solar-resource assessment for Mosul: monthly PV production and in-plane irradiation
Figure 2. 24-hour available photovoltaic (PV) power profile used for the energy management system (EMS) stress-day simulation
The 150 kWp photovoltaic rating is retained as a seasonally resilient station size rather than reduced merely to suppress residual summer curtailment. The January sensitivity is used as a representative low-photovoltaic case for the low-production months, particularly January, February, November and December. It shows that reducing photovoltaic capacity would reduce summer surplus but would also increase low-irradiance-period grid dependence and service stress under the same outage and demand conditions.
The station is represented as a four-port PV/grid/EV/SC system connected through a quadruple-active-bridge/multi-active-bridge (QAB/MAB)-style isolated DC routing stage [20]. The grid interface is modeled at supervisory power-flow level. The service side has one 60 kW outlet and a two-EV queue, making charger capacity explicit while isolating routing effects. Table 2 lists the station ratings and assumptions, while Table 3 provides the complete electric-vehicle service scenario.
Table 2. Station ratings and weak-grid scenario assumptions
|
Item |
Value/Assumption |
|
Photovoltaic (PV) array |
150 kWp crystalline silicon |
|
PVGIS location |
36.339° N, 43.141° E (Mosul, Iraq) |
|
PVGIS benchmark |
232,807.64 kWh/year; 2,119.04 kWh/m²/year in-plane irradiation |
|
Grid interface |
60 kW import/export interface; photovoltaic-to-grid export is blocked during outages and derated during connected weak-grid conditions according to the grid-quality index; no simultaneous import/export is allowed |
|
Electric-vehicle (EV) service |
Single 60 kW DC outlet with two-EV queue |
|
Supercapacitor (SC) module |
30 kWh usable class; state of charge (SOC) constrained to 15–95% |
|
Outage scenario |
Three complete outage windows totaling 6 h |
Table 3. Complete electric-vehicle (EV) service scenario used in the 24 h stress-day simulation
|
EV |
Window (h) |
Ebat (kWh) |
SOCinit→SOCtar (%) |
Pch/PV2G, Max (kW) |
Status |
|
Tesla M3 |
7.00–8.75 |
60 |
20→80 |
60/0 |
Met |
|
Hyundai Ioniq5 |
7.25–9.50 |
72 |
25→85 |
60/0 |
Met |
|
Nissan Leaf |
7.50–10.25 |
40 |
30→80 |
60/0 |
Met |
|
BMW iX3 |
12.50–14.25 |
74 |
15→90 |
60/0 |
Met |
|
Kia EV6 |
13.00–15.00 |
77 |
35→80 |
60/0 |
Met |
|
Mercedes EQB |
17.50–19.00 |
70 |
45→80 |
60/0 |
Met |
|
BYD Sea Lion 07 |
18.50–20.50 |
82 |
65→80 |
60/30 |
Met |
|
Audi Q4 e-tron |
19.25–21.25 |
77 |
20→85 |
60/30 |
Underserved |
|
Ford Mach-E |
20.00–22.50 |
88 |
25→90 |
60/30 |
Underserved |
|
VW ID.4 |
21.50–23.50 |
77 |
30→80 |
60/0 |
Met |
Note: Window denotes arrival–departure time. Ebat is the EV battery capacity. SOCinit→SOCtar gives the initial-to-target SOC range. Pch/PV2G, max gives the maximum charging power and maximum V2G discharge power, respectively; a PV2G, max value of 0 indicates that V2G discharge is not enabled for that EV.
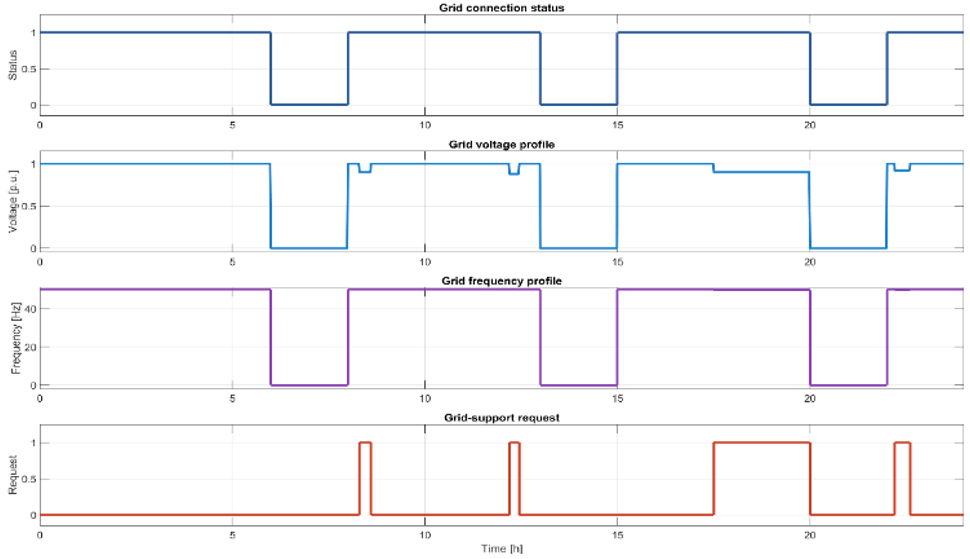
Figure 3. Binary grid-connection status with voltage, frequency and grid-support request layers for the weak-grid scenario
The complete EV demand data used in the simulation are provided in Table 3. The station serves one EV at a time through a 60 kW DC outlet, while up to two additional EVs can wait in the finite queue. The listed V2G limit is applied only to vehicles marked as V2G-eligible and only when the retained SOC remains above the owner-protection threshold used in the supervisory model.
The grid scenario contains three outage windows: 06:00–08:00, 13:00–15:00 and 20:00–22:00, totaling 6 h. All grid paths are blocked during outages. During connected periods, voltage sags and frequency deviations activate support requests only when the grid is available. Figure 3 shows the resulting profiles.
The EMS is formulated as a supervisory power-routing model with a fixed one-minute timestep. Powers are expressed in kW, energies in kWh, and the time step is denoted by $\Delta t_h$. The model describes averaged power commands exchanged among the PV, grid, EV, and SC ports; post-processing statistics are reported in the results tables.
The available PV power is modeled using an irradiance–temperature envelope, as expressed in Eq. (1):
$P_{P V, a v}(k)=P_{P V, r} \eta_{P V}(k)\left[1-\beta_T\left(T_a(k)-T_{r e f}\right)\right]$ (1)
where, $P_{P V, a v}$ is the available photovoltaic power, $P_{P V, r}$ is the rated photovoltaic power, $\eta_{P V}$ is the normalized irradiance envelope, $T_a$ is the ambient temperature, $T_{\text {ref}}$ is the reference temperature, and $\beta_T$ is the temperature coefficient.
The SOC of EV n is updated using the signed EV-port power:
$\begin{gathered}\operatorname{SOC}_{E V, n}(k+1)=\operatorname{SOC}_{E V, n}(k)+\frac{100}{E_{E V, n}}\left[\eta_{c h} P_{E V, n}^{+}(k)-\frac{P_{E V, n}^{-}(k)}{\eta_{d i s}}\right] \Delta t_h\end{gathered}$ (2)
where, $S O C_{E V, n}$ is the state of charge of $\mathrm{EV} \, \mathrm{n}, E_{E V, n}$ is the EV battery capacity, $P_{E V, n}^{+}$ is EV charging power, $P_{E V, n}^{-}$ is V2G discharge power, $\eta_{c h}$ is charging efficiency, $\eta_{d i s}$ is discharging efficiency, and $\Delta t_h$ is the time step in hours.
$\begin{gathered}E_{\text {req}, n}(k)=\max \left[0, \frac{S O C_{\text {tar}, n}-S O C_{E V, n}(k)}{100} E_{E V, n}\right] \\ P_{E V, \text { req}, n}(k) =\min \left[P_{c h, \text { max}}, P_{E V, n, \text {max}}, \frac{E_{\text {req}, n}(k)}{\max \left(t_{\text {dep}, n}-t_k, \Delta t_h\right)}\right]\end{gathered}$ (3)
where, $E_{\text {req}, n}$ is the remaining energy required by EV n, $S O C_{\text {tar}, n}$ is the target state of charge, $S O C_{E V, n}$ is the present state of charge, $P_{E V, \text {req}, n}$ is the bounded charging request, $P_{c h, \text {max}}$ is the charger limit, $P_{E V, n, \text {max}}$ is the EV-specific charging limit, $t_{\text {dep,n}}$ is the departure time, and $t_k$ is the current simulation time.
The SC SOC is updated using the same energy-balance principle:
$\begin{gathered}S O C_{S C}(k+1)=S O C_{S C}(k)+\frac{100}{E_{S C}}\left[\eta_{S C, c h} P_{S C, c h}(k)-\frac{P_{S C, d i s}(k)}{\eta_{S C, d i s}}\right] \Delta t_h\end{gathered}$ (4)
where, $S O C_{S C}$ is the supercapacitor state of charge, $E_{S C}$ is the usable supercapacitor energy, $P_{S C, c h}$ is the supercapacitor charging power, $P_{S C, d i s}$ is the supercapacitor discharging power, $\eta_{S C, c h}$ is the supercapacitor charging efficiency, $\eta_{S C, \text { dis}}$ is the supercapacitor discharging efficiency, and $\Delta t_h$ is the time step in hours.
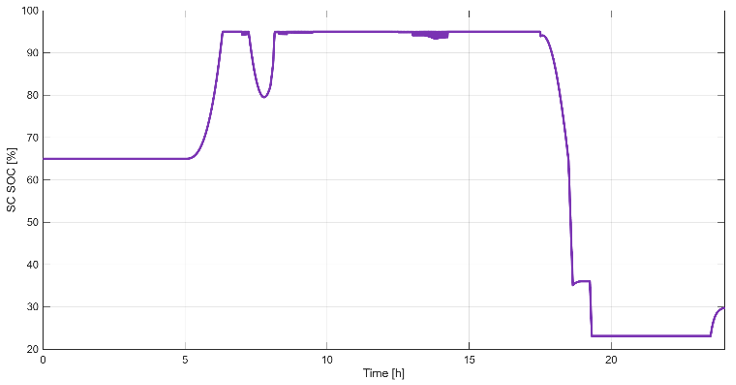
In the reported simulations, the SC is represented as a 30 kWh usable energy buffer with initial SOC = 65%, operating SOC limits of 15-95%, and symmetric charge/discharge power limits of 60 kW. The supervisory benchmark uses eta_SC, ch = eta_SC, dis = 1.00 and neglects self-discharge and internal loss dynamics; therefore, the reported SC power represents the routed DC-port power at the EMS layer rather than a detailed electrochemical loss model [21]. This assumption is retained to keep the comparison focused on routing decisions. The daily SC discharge of 44.95 kWh is not inconsistent with the 30 kWh usable rating because the SC cycles during the day: 32.39 kWh is charged from PV and 2.00 kWh from the grid, while 39.33 kWh is delivered to EV charging and 5.62 kWh to grid support. The corresponding net SC energy reduction is about 10.56 kWh, and the simulated SOC remains within 23.14-95.00%.
Grid connection is represented by a binary variable:
$\begin{aligned} & G(k) \in\{0,1\} \\ & G(k)=0 \Rightarrow P_{G j}(k)=P_{i G}(k)=0, \quad \forall i, j\end{aligned}$ (5)
where, $G(k)=1$ indicates that the grid is connected, $G(k)=$0 indicates a complete outage, and all grid import/export paths are blocked when $G(k)=0$.
When the grid is connected, its voltage and frequency quality are represented through a normalized grid-quality index:
$q_g(k)=G(k) \min \left\{\begin{array}{r}\operatorname{sat}\left(\frac{V_g(k)-0.85}{1.00-0.85}\right), \\ \operatorname{sat}\left(\frac{f_g(k)-49.50}{50.00-49.50}\right)\end{array}\right\}$ (6)
where, $q_g$ is the normalized grid-quality index, $V_g$ is the grid voltage in p.u., $f_g$ is the grid frequency in Hz, sat(.) is the saturation function limited to [0, 1], and $G(k)$ forces $q_g$ to zero during outages.
Numerically, voltage quality is saturated between 0 at $V_g<=$0.85 p.u. and 1 at $V_g=1.00$ p.u., while frequency quality is saturated between 0 at $f_g<=49.50 \mathrm{~Hz}$ and 1 at $f_g=50.00 \mathrm{~Hz}$. The stress-day voltage sag intervals are 08:30-08:36 (0.90 p.u.), 12:12-12:27 (0.88 p.u.), 17:30-20:00 (0.90 p.u.) and 22:12-22:36 (0.92 p.u.). Frequency is reduced to 49.75 Hz during 17:30-20:00 and to 49.80 Hz during 22:12-22:36. A grid-support request is enabled only when the grid is connected and at least one of the following conditions is satisfied: $V_g<0.92$ p.u., $f_g<49.85 \mathrm{~Hz}$, or the evening-peak interval 17:30-20:00 is active. During complete outages, $\mathrm{G}(\mathrm{k})=0, q_g(\mathrm{k})=0$, and all grid import/export paths are blocked. The EMS routing decision is represented by a non-negative port-to-port power matrix:
$\begin{gathered}\mathrm{P}(k)=\left[P_{i j}(k)\right], i, j \in\{G, P V, E V, S C\} \\ P_{i i}(k)=0, \\ \alpha_{i j}(k)=\frac{P_{i j}(k)}{\sum_m P_{i m}(k)+\varepsilon}, \varepsilon=10^{-6} .\end{gathered}$ (7)
where, $P_{i j}$ is the routed power from source port i to sink port j, $\alpha_{i j}$ is the source-side routing share, $\varepsilon$ is a small constant used to avoid division by zero, and $i, j$ belong to $\{G, P V, E V, S C\}$.
The supervisory power-balance residual is checked at every timestep as:
$\Delta P(k)=P_{P V}(k)+P_G(k)+P_{S C}(k)-P_{E V}(k) \approx 0$ (8)
where, $P_{P V}, P_G$, and $P_{S C}$ denote supply powers from the photovoltaic, grid, and supercapacitor ports, respectively; $P_{E V}$ denotes the EV charging demand; and $\Delta P$ is the supervisory power-balance residual.
The service-completion ratio and total unserved EV energy are defined as:
$\begin{gathered}S R=\frac{N_{\text {met}}}{N_{E V}}, \\ E_{\text {unserved}}= \sum_n \max \left[0, \frac{S O C_{\text {tar}, n}-S O C_{\text {dep}, n}}{100} E_{E V, n}\right]\end{gathered}$ (9)
where, $S R$ is the service-completion ratio, $N_{\text {met}}$ is the number of EVs reaching the target SOC, $N_{E V}$ is the total number of EVs, $E_{\text {unserved}}$ is the total unserved EV energy, $S O C_{\text {dep}, n}$ is the departure SOC of EV n, $S O C_{\text {tar, } n}$ is the target SOC, and $E_{E V, n}$ is the EV battery capacity.
Finally, PV curtailment is computed as:
$E_{\text {curt}}=\sum_k \max \left[0, P_{P V, a v}(k)-\sum_j P_{P V, j}(k)\right] \Delta t_h$ (10)
where, $E_{\text {curt}}$ is the residual photovoltaic curtailed energy, $P_{P V, a v}$ is the available photovoltaic power, $P_{P V, j}$ is the photovoltaic power routed from the PV port to sink $\mathrm{j}, \, \Delta t_h$ is the simulation time step in hours, and $j$ denotes the sink ports receiving photovoltaic power.
During outages, photovoltaic-to-grid export is unavailable. During connected weak-grid intervals, photovoltaic export is allowed as a surplus-routing path, but the export limit is reduced according to the grid-quality index. Specifically, $P_{P V \rightarrow \text {Grid, max}}(k)$ is 0 when $S_g(k)=0$; equals the 60 kW rated export limit when $S_g(k)=1$ and $q_g(k)>=q_{\text {export,full}}=0.90$; equals $\left[\left(q_g(k)-q_{\text {export,critical}}\right) /\left(q_{\text {export,full}}-\right.\right. \left.\left.q_{\text {export,critical}}\right)\right] P_{P V \rightarrow \text { Grid,rated}}$, when $S_g(k)=1$ and $0.60<=q_g(k)<0.90$; and is 0 when $S_g(k)=1$ and $q_g(k)<0.60$. Export is also blocked when a grid-import path is active, preventing simultaneous import and export.
6.1 Baseline controllers
Two non-optimized controllers are used as same-seed baselines.
The Rule-Based controller supplies EV demand from photovoltaic generation first, then the grid, then the supercapacitor when the supercapacitor SOC is above the support threshold. Photovoltaic surplus charges the supercapacitor first; any remaining photovoltaic power is exported to the grid when the grid is connected, no grid import is active, and the quality-dependent export limit permits export. Grid-to-supercapacitor charging is allowed only during connected non-support periods with no active EV demand. Limited EV/supercapacitor grid support is allowed during connected support events subject to service, SOC, and path constraints.
The expert-fuzzy controller uses the same structure as §6.2 with engineering-selected base weights {PV→EV 0.12, Grid→EV 0.08, SC→EV 0.06, PV→SC 0.10, PV→Grid 0.08}, gains {PV→EV 1.35, Grid→EV 1.00, SC→EV 1.05, PV→SC 1.25, PV→Grid 0.85, Grid-support 1.00} and SC charge target 45%.
The expert-fuzzy parameters are not fitted to the reported WOA result. They are fixed engineering-selected weights chosen before the optimization run to express the same qualitative dispatch priorities as the rule base: photovoltaic power is preferred for electric-vehicle service when available, the grid is used for residual electric-vehicle demand when connected and permitted by the grid-quality constraints, supercapacitor support is increased during weak-grid periods, photovoltaic surplus is preferentially absorbed by the supercapacitor, and photovoltaic-to-grid export remains a deterministic residual-routing path subject to quality-dependent derating. All expert-fuzzy gains remain within the same search ranges later used by WOA, but they are not iteratively tuned. To reduce comparison bias, the three controllers are evaluated on the same nominal stress day and on identical Monte Carlo perturbation seeds. These shared nominal and stochastic cases provide a consistent basis for interpreting the baseline comparison.
6.2 Whale Optimization Algorithm-tuned fuzzy-weighted energy management system
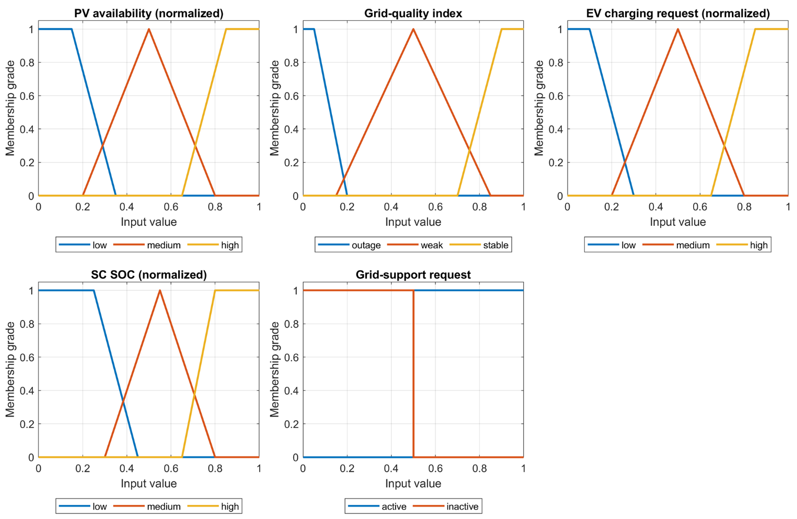
The EMS uses a fuzzy-weighted continuous routing structure based on fuzzy-set theory [22, 23]. Membership grades for PV ratio, grid quality, EV request, SC SOC, and support request activate routing rules; the outputs are normalized into port-to-port shares using Eq. (7), then constrained by outage blocking, SOC limits, and path-capacity checks. This continuous supervisory EMS formulation is also consistent with related fuzzy EMS designs for grid-connected DC microgrids [24]. Figure 4 shows the membership functions.
Table 4 summarizes the fuzzy rule base. For reproducibility, the fuzzy EMS is implemented as a Mamdani-type inference system. At each 60 s supervisory time step, the normalized PV availability, grid-quality index, EV charging request, SC SOC, and grid-support request are evaluated through the membership functions in Figure 4 and the rules in Table 4. Rule firing strengths are computed using the minimum operator for antecedent conjunction, and the activated rule outputs are aggregated using the maximum operator. The crisp outputs are obtained using centroid defuzzification. These outputs are interpreted as continuous power-sharing tendencies rather than direct switching commands; they are normalized into the port-to-port routing shares of Eq. (7), after which outage blocking, SOC bounds, path-capacity limits, and no-simultaneous-charge/discharge constraints are enforced.
Figure 4. Membership functions for the fuzzy-weighted energy management system (EMS) inputs
Table 4. Fuzzy-weighted routing rule base used by the supervisory energy management system (EMS)
|
Rule |
Condition |
Dispatch Implication |
|
R1 |
Photovoltaic (PV) high and electric-vehicle (EV) request high |
Increase PV-to-EV routing weight |
|
R2 |
Grid quality healthy and EV request high |
Allow grid-to-EV routing for residual demand |
|
R3 |
Grid quality weak and supercapacitor (SC) SOC medium/high |
Increase SC-to-EV routing to reduce grid stress |
|
R4 |
PV high and SC SOC below target |
Route PV surplus to SC charging |
|
R5 |
Grid-support request active and V2G safe |
Allow limited EV-to-grid support |
|
R6 |
Grid disconnected |
Block all grid import/export paths |
Table 5. Whale Optimization Algorithm (WOA)-tuned fuzzy output parameters and search bounds
|
Parameter |
Lower Bound |
Upper Bound |
WOA Value |
Unit/Interpretation |
|
PV-to-EV base weight |
0.02 |
0.50 |
0.02514 |
dimensionless |
|
Grid-to-EV base weight |
0.02 |
0.50 |
0.02488 |
dimensionless |
|
Supercapacitor (SC)-to-EV base weight |
0.02 |
0.50 |
0.2496 |
dimensionless |
|
PV-to-EV gain |
0.10 |
3.00 |
2.197 |
dimensionless |
|
Grid-to-EV gain |
0.10 |
3.00 |
0.300 |
dimensionless |
|
SC-to-EV gain |
0.10 |
3.00 |
0.4974 |
dimensionless |
|
Grid-support gain |
0.10 |
3.00 |
0.3217 |
dimensionless |
|
SC charge target SOC |
20 |
80 |
30.02 |
% |
Table 5 lists the WOA-tuned parameters. WOA is selected because its encircling and spiral-search operators support convergence and reduce premature local trapping in continuous routing-weight problems [25]. Search bounds follow station ratings: base weights [0.02, 0.50], gains [0.10, 3.00], and SC charge target [20%, 80%].
The PV-to-SC surplus-charging gain is fixed at 1.25 throughout the energy management process and is therefore not included in the WOA search vector as an optimization variable. This fixed setting ensures that the PV-to-SC surplus-charging gain remains constant during the WOA-based optimization procedure. In addition, PV-to-Grid export is handled as a deterministic residual-routing rule after the EV charging and SC charging priorities have been satisfied, rather than being represented or adjusted as a WOA-tuned fuzzy weight. Accordingly, the PV-to-Grid export process follows the predefined priority-based energy-routing logic and does not introduce an additional decision variable into the WOA optimization framework.
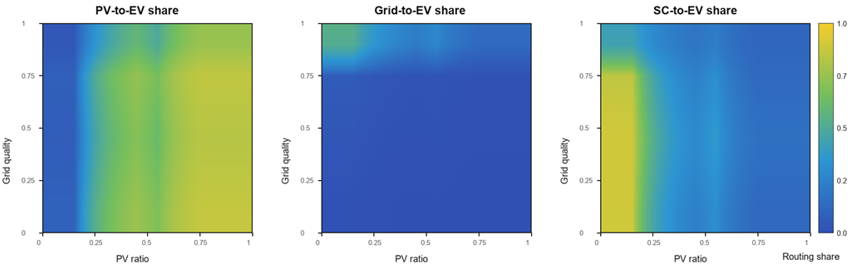
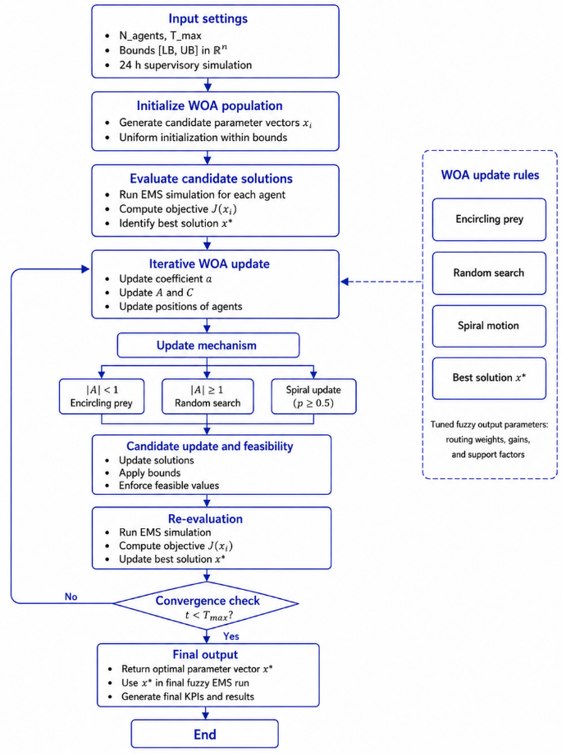
Figure 5 shows how PV ratio and grid quality shape the main EV-supply shares under high EV demand. Figure 6 summarizes WOA tuning. Thirty agents represent eight-dimensional fuzzy output vectors. Each candidate is evaluated through a 24 h EMS simulation, then updated by encircling, random-search or spiral operators for 100 iterations [25]. The best vector is used in the final WOA-tuned simulation.
Figure 5. Fuzzy routing surfaces for photovoltaic (PV)-to-EV, grid-to-EV, and supercapacitor (SC)-to-EV shares under high electric-vehicle (EV) requests
Figure 6. Flowchart of the Whale Optimization Algorithm (WOA) tuning procedure for the proposed fuzzy management system (EMS)
The service-priority tuning objective is given in Eq. (11).
$\begin{gathered}J=4.00 \overline{\mathrm{E}}_{\text {unserved}}+5.50(1-S R)+ \\ 0.45 \overline{\mathrm{E}}_G+0.35 \overline{\mathrm{E}}_{\text {curt}}-0.25 R_{\text {weak}}-0.002 \\ \min \left(E_{V 2 G}, 30\right)+0.60 P_{S C, \text { low}}+0.60 P_{S C, \text { high}}+10.00 \\ N_{\text {viol}}+0.20 P_{\text {hal}}\end{gathered}$ (11)
where, $J$ is the WOA objective function, $\overline{\mathrm{E}}_{\text {unserved}}$ is the normalized unserved EV energy, $S R$ is the service-completion ratio, $\overline{\mathrm{E}}_G$ is the normalized grid-import energy, $\overline{\mathrm{E}}_{\text {curt}}$ is the normalized residual photovoltaic curtailment, $R_{\text {weak}}$ is the normalized weak-grid support reward, $E_{V 2 G}$ is the vehicle-togrid support energy, $P_{S C, \text {low}}$ and $P_{S C, \text {high}}$ are the supercapacitor SOC-bound penalties, $N_{\text {viol}}$ is the number of failed routing or feasibility checks, and $P_{\text {bal}}$ is the normalized power-balance residual.
Table 6 gives the objective weights and normalizations. Service completion and unserved energy dominate; grid import, residual PV curtailment after conditional export, weak-grid support, V2G, SOC penalties, feasibility penalties, and residual terms are secondary.
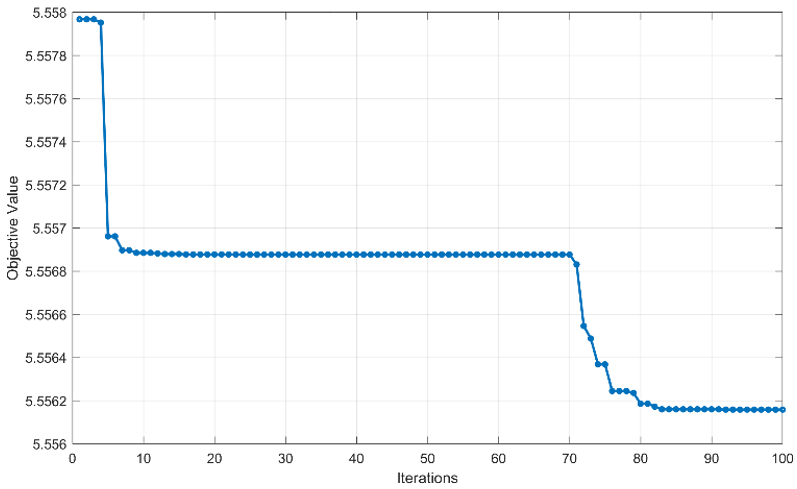
Energy terms are normalized as in Table 6; Nviol counts failed routing checks. Figure 7 shows the best-so-far WOA objective.
After adding the conditional photovoltaic-to-grid export path, the WOA tuning was rerun using the same settings: 30 search agents, 100 iterations, and random seed 2026. The revised best objective value was 5.5562. The selected controller was then evaluated under the nominal stress day and the same Monte Carlo perturbation framework. Photovoltaic-to-grid export is handled as a deterministic residual-routing rule after electric-vehicle charging and supercapacitor charging priorities, so it does not override the service-priority objective.
Table 6. Objective-function weights used for Whale Optimization Algorithm (WOA) tuning
|
Term |
Weight |
Normalized Quantity |
|
Unserved electric-vehicle (EV) energy |
4.00 |
$E_{\text {unserved }} / 100$ |
|
Service-rate shortfall |
5.50 |
1 − SR |
|
Grid-import energy |
0.45 |
$\left(E_{\text {Grid } \rightarrow E V}+E_{\text {Grid } \rightarrow S C}\right) / 120$ |
|
Residual photovoltaic curtailment after conditional export |
0.35 |
$E_{\text {curt }} / 900$ |
|
Weak-grid supercapacitor (SC)/V2G support reward |
-0.25 |
$\min \left(\left(E_{S C, \text { weak }}+E_{V 2 G}\right) / 40,1\right)$ |
|
V2G delivery reward |
-0.002 |
$\min \left(E_{V 2 G}, 30\right)$ |
|
SC low-SOC penalty |
0.60 |
$\begin{aligned} & \max \left(0, S O C_{\text {min }}-\right. \left.\min \left(S O C_{S C}\right)\right) / 100\end{aligned}$ |
|
SC high-SOC penalty |
0.60 |
$\begin{gathered}\max \left(0, \max \left(S O C_{S C}\right)-\right. \left.S O C_{\max }\right) / 100\end{gathered}$ |
|
Constraint-violation penalty |
10.00 |
Sum of failed logical routing checks |
|
Power-balance residual penalty |
0.20 |
$\max (\operatorname{abs}(\Delta P)) / P_{\text {grid}, \text {max}}$ |
Figure 7. Best-so-far Whale Optimization Algorithm (WOA) objective value for the selected fuzzy controller
For reproducibility, the WOA population was initialized using a uniform random distribution within the lower and upper bounds listed in Table 5. The engineering-selected expert-fuzzy vector was optionally inserted as one initial candidate to provide a reproducible baseline point, while the remaining candidates were randomly generated within the same bounds. After each WOA update, candidate parameters were clipped to their admissible lower and upper bounds. The stopping criterion was a fixed maximum of 100 iterations, with no additional convergence-based termination in the reported run. The reported parameter vector corresponds to the best-so-far solution obtained from one reproducible fixed-seed nominal optimization run with seed 2026 and is retained as the nominal reported solution. Repeatability is supported through the fixed seed, explicit bounds, deterministic EMS evaluation, and the reported parameter vector in Table 5. The controller was then evaluated under the nominal case and the 30-sample Monte Carlo perturbation set without retuning.
An additional ten-start WOA stability check was performed without changing the reported nominal controller. Each run used the same 30-agent, 100-iteration setting, objective function, parameter bounds, EV-demand table, nominal 24 h stress-day scenario and quality-derated photovoltaic-to-grid export logic, but with a different random seed. All ten runs retained the same primary service outcome of 8/10 completed electric-vehicle targets and zero failed feasibility checks. The best objective values were closely grouped, with mean 5.5066, standard deviation 0.0267 and range 5.4804-5.5562; unserved electric-vehicle energy ranged from 101.58 to 104.92 kWh, while photovoltaic-to-grid export remained nearly unchanged at 287.88-288.00 kWh. These results support the operational stability of the WOA-tuned EMS under repeated initialization while retaining the fixed-seed controller as the nominal reported solution.
This ten-start check is used only to assess optimizer-start sensitivity; the fixed-seed controller is retained to keep the nominal, Monte Carlo, and baseline comparisons internally consistent.
The simulation was implemented in MATLAB with a fixed 60 s timestep over 24 h. Random seeds were fixed for the nominal WOA run and the Monte Carlo set. EV-arrival assumptions follow public charging-deployment context from IEA reporting [26] and PVGIS-PV-EV guidelines [27]. The one-minute timestep resolves queue transitions, outage boundaries, and SC SOC changes at supervisory dispatch granularity.
Table 7 reports the main numerical results for the nominal WOA-tuned run.
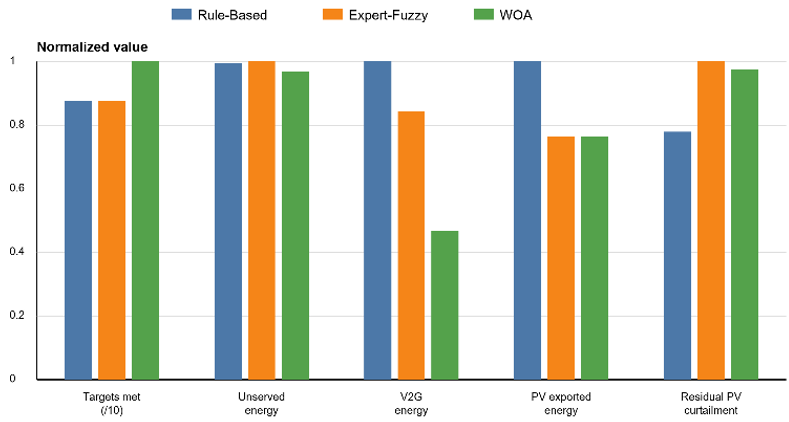
The WOA-tuned EMS completes 8/10 electric-vehicle targets versus 7/10 for both baselines (+14.3%). Table 8 gives the exact controller-comparison values and units, while Figure 8 presents a normalized dimensionless comparison to avoid plotting mixed physical units on one axis.
Photovoltaic export is treated as a residual energy-accounting path rather than the primary optimization target. Therefore, higher exported energy or lower residual curtailment does not necessarily indicate better EMS performance. The proposed WOA-tuned controller prioritizes electric-vehicle service completion, unserved-energy reduction, and feasibility under weak-grid constraints.
Table 7. Nominal Whale Optimization Algorithm (WOA)-tuned energy management system (EMS) results
|
KPI |
Value |
|
Completed electric-vehicle (EV) targets |
8/10 |
|
Service-completion improvement |
+14.3% relative to 7/10 baselines |
|
Unserved EV energy |
104.92 kWh |
|
Rejected arrivals |
0 |
|
Supercapacitor (SC) state of charge (SOC) range |
23.14% to 95.00% |
|
Outage duration |
6.00 h |
|
V2G support energy |
3.03 kWh |
|
PV exported to grid |
288.00 kWh |
|
Residual PV curtailed energy |
514.21 kWh |
|
Max power-balance residual |
7.28e-12 kW |
Table 8. Controller comparison under the nominal stress day
|
Controller |
Targets Met (/10) |
Unserved (kWh) |
V2G (kWh) |
Photovoltaic (PV) Exported (kWh) |
Residual PV Curtailed (kWh) |
|
Rule-Based |
7 |
107.77 |
6.49 |
376.76 |
411.65 |
|
Expert-Fuzzy |
7 |
108.43 |
5.47 |
288.00 |
528.60 |
|
WOA |
8 |
104.92 |
3.03 |
288.00 |
514.21 |
The WOA-tuned EMS is not intended to maximize every individual energy-accounting metric. Its tuning objective is service-priority based, giving dominant weight to electric-vehicle target completion and unserved-energy reduction, while photovoltaic export and residual curtailment are treated as secondary terms. Therefore, the rule-based controller can show higher photovoltaic export and lower residual curtailment in the nominal day, whereas the WOA-tuned controller gives the best primary service result by completing 8/10 electric-vehicle targets with all feasibility checks satisfied.
Figure 8. Normalized controller comparison under the nominal stress day
Each metric is normalized by the maximum value among the compared controllers to avoid mixing physical units on a common axis. Numerical values and units are reported in Table 8. For cost-type metrics such as unserved energy and residual photovoltaic curtailment, lower normalized values indicate better performance.
WOA records lower V2G energy because the objective prioritizes EV target completion. It preserves EV energy for service while still delivering 3.03 kWh of V2G support.
V2G operation is deliberately constrained to avoid overstating the available support. Only the EVs marked as V2G-capable in Table 3 may discharge, and discharge is allowed only when the grid is connected, a support request is active and no higher-priority charging demand is waiting. The supervisory model also enforces a 60% owner-reserve SOC, a 30 kW EV discharge limit and a 30 kW grid-support cap. Battery-degradation cost is not modeled; therefore, the V2G results should be interpreted as limited emergency support from eligible parked EVs rather than a full market-participation assessment.
Table 9 lists the main routed energy paths. The photovoltaic-energy accounting closes as follows: the stress-day available photovoltaic energy is 1006.36 kWh, of which 171.76 kWh is routed from photovoltaic generation to electric-vehicle charging, 32.39 kWh is routed from photovoltaic generation to supercapacitor charging and 288.00 kWh is exported to the grid under the conditional export rule. The remaining 514.21 kWh is residual photovoltaic curtailment after electric-vehicle charging, supercapacitor absorption and grid export. This residual is caused by the single active outlet, finite supercapacitor absorption, outage periods, weak-grid export blocking, and the grid-interface export limit.
Table 9. Daily port-to-port routed energy and peak path power
|
Path |
Energy (kWh) |
Peak Power (kW) |
|
Grid -> EV |
59.83 |
60.00 |
|
Grid -> SC |
2.00 |
13.75 |
|
PV -> Grid |
288.00 |
60.00 |
|
PV -> EV |
171.76 |
60.00 |
|
PV -> SC |
32.39 |
43.69 |
|
EV -> Grid |
3.03 |
5.06 |
|
SC -> Grid |
5.62 |
5.06 |
|
SC -> EV |
39.33 |
58.37 |
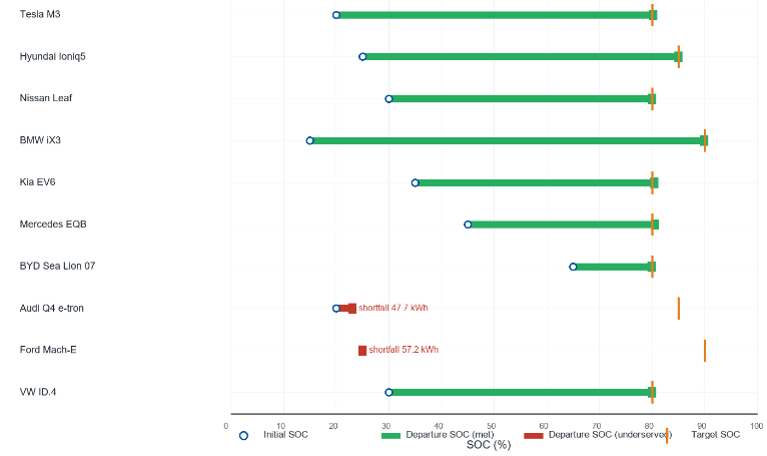
Figure 9 compares the initial, departure, and target SOC of each EV, clearly identifying the two underserved vehicles.
Figure 9. Electric-vehicle (EV) service completion by initial state of charge (SOC), departure SOC and target SOC
Figure 10. Supercapacitor (SC) state of charge (SOC) trajectory under Whale Optimization Algorithm (WOA)-tuned operation
Figure 10 shows the SC SOC trajectory. Total SC discharge is 44.95 kWh (39.33 kWh to EV and 5.62 kWh to grid support; Table 9), including 23.57 kWh during weak-grid intervals. SOC remains within 23.14–95.00%. The two underserved EVs arrive late in the evening during overlapping outage and high-demand intervals.
Monte Carlo analysis is a repeated-simulation uncertainty method in which selected uncertain inputs are randomly perturbed, and the resulting output distribution is evaluated [28]. It is used here to test whether the proposed EMS remains effective under stochastic operating variations rather than only under one nominal stress day. The WOA-tuned parameters are obtained from the nominal case and then kept fixed during the Monte Carlo runs, so the analysis evaluates controller robustness rather than repeating the optimization.
In each scenario, EV arrival time, initial SOC, EV battery capacity, and PV availability are perturbed within predefined limits. Specifically, the arrival time of each EV is varied by +/-0.30 h (+/-18 min), initial SOC by +/-7 percentage points, battery capacity by +/-7%, and the PV-resource multiplier by +/-20%. The same 30 perturbed scenarios are applied to the WOA-tuned EMS and the two baseline controllers using identical random seeds (Monte Carlo seed = 7777), while the binary outage windows and weak-grid quality events remain fixed. This design isolates controller response to demand and renewable-resource uncertainty without changing the underlying outage scenario. Table 10 summarizes the Monte Carlo robustness statistics for the fixed WOA-tuned controller.
Table 10. Monte Carlo robustness statistics for the Whale Optimization Algorithm (WOA)-tuned energy management system (EMS)
|
Metric |
Mean |
Std |
Min |
P05 |
P50 |
P95 |
|
MetTargets |
7.40 |
0.56 |
6 |
7 |
7 |
8 |
|
Unserved_kWh |
99.32 |
8.44 |
84.64 |
85.10 |
97.99 |
113.05 |
|
Rejected |
0.00 |
0.00 |
0 |
0 |
0 |
0 |
|
SC_SOC_min_pct |
23.94 |
0.79 |
22.18 |
22.45 |
24.10 |
24.84 |
|
SC_SOC_max_pct |
95.00 |
0.00 |
95.00 |
95.00 |
95.00 |
95.00 |
|
V2G_kWh |
1.28 |
1.33 |
0.00 |
0.00 |
1.24 |
3.79 |
|
PV_export_kWh |
286.54 |
15.37 |
256.56 |
261.09 |
285.35 |
316.75 |
|
PV_curtail_kWh |
522.64 |
110.01 |
326.12 |
326.35 |
518.31 |
698.79 |
|
MaxBalance_kW |
8.61e-12 |
2.78e-12 |
7.28e-12 |
7.28e-12 |
7.28e-12 |
1.46e-11 |
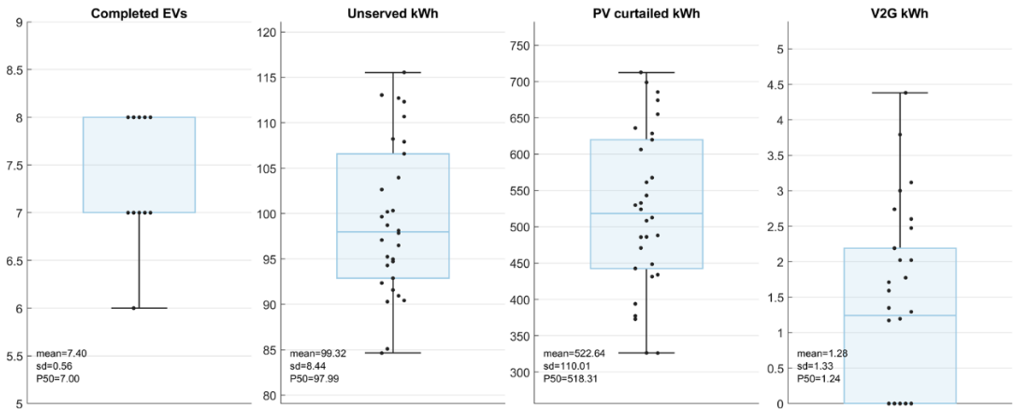
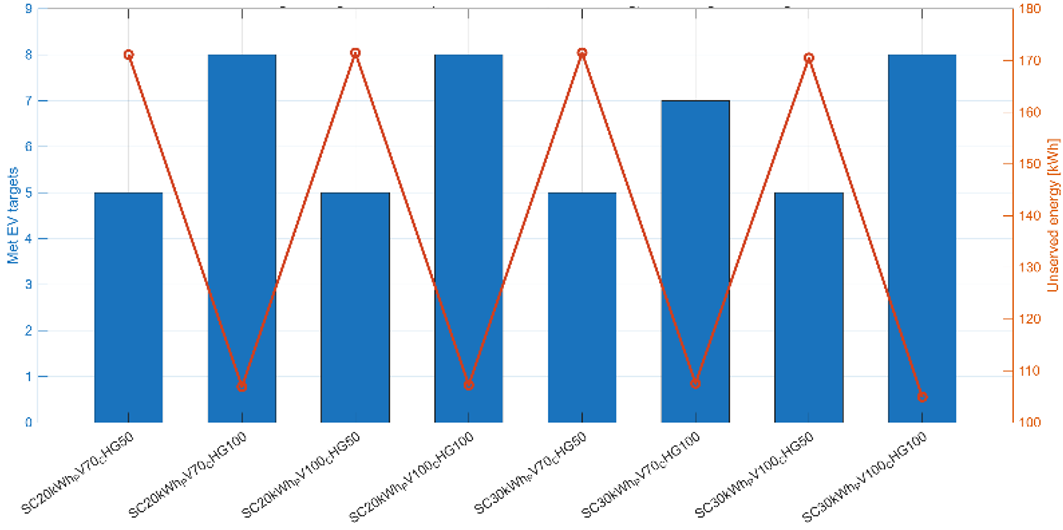
WOA completes 7-8 EV targets in most stochastic variations, with mean 7.40, std 0.56, minimum 6, P05 = 7, P50 = 7, and P95 = 8. Across the 30 Monte Carlo runs, the target-count frequency is 8 targets in 13 runs, 7 targets in 16 runs, and 6 targets in one run; no EV arrivals are rejected. Table 11 shows a higher WOA mean than both baselines under identical seeds. Wilcoxon testing gives p = 0.0180 versus expert-fuzzy and p = 0.1404 versus Rule-Based for completed EV targets; for unserved energy, p = 8.41e-05 versus expert-fuzzy and p = 0.1819 versus Rule-Based. For metrics where statistical significance was not established, the comparison is reported as a numerical trend and interpreted together with the primary service-oriented objective. Figure 11 presents the distributions of electric-vehicle service completion, unserved energy, residual photovoltaic curtailment, and vehicle-to-grid support across the Monte Carlo runs. Table 12 summarizes the variant analysis across SC capacity, PV derating, and charger capacity. With full charger capacity, WOA serves 7–8 EVs across all PV/SC configurations. At 50% charger derating, all configurations serve 5 EVs, identifying charger capacity as the primary sizing parameter. Figure 12 visualizes the comparison.
Thus, charger rating is the dominant service-capacity constraint, while SC capacity mainly affects energy buffering
Table 11. Same-seed Monte Carlo comparison of Whale Optimization Algorithm (WOA) and baseline controllers
|
Controller |
Met Targets, Mean ± Std |
Unserved Energy, Mean ± Std (kWh) |
|
Rule-Based |
7.30 ± 0.60 |
99.46 ± 9.22 |
|
Expert-Fuzzy |
7.20 ± 0.61 |
100.73 ± 9.01 |
|
WOA |
7.40 ± 0.56 |
99.32 ± 8.44 |
Figure 11. Monte Carlo boxplots for EV service completion, unserved energy, residual photovoltaic (PV) curtailment and V2G support
Table 12. Engineering variant analysis across supercapacitor (SC) capacity, photovoltaic (PV) derating, and charger capacity
|
Case |
SC (kWh) |
PV Scale |
Charger Scale |
Targets Met |
Unserved (kWh) |
|
SC20kWh_PV70_CHG50 |
20 |
0.7 |
0.5 |
5 |
171.16 |
|
SC20kWh_PV70_CHG100 |
20 |
0.7 |
1.0 |
8 |
106.92 |
|
SC20kWh_PV100_CHG50 |
20 |
1.0 |
0.5 |
5 |
171.49 |
|
SC20kWh_PV100_CHG100 |
20 |
1.0 |
1.0 |
8 |
107.25 |
|
SC30kWh_PV70_CHG50 |
30 |
0.7 |
0.5 |
5 |
171.49 |
|
SC30kWh_PV70_CHG100 |
30 |
0.7 |
1.0 |
7 |
107.58 |
|
SC30kWh_PV100_CHG50 |
30 |
1.0 |
0.5 |
5 |
170.49 |
|
SC30kWh_PV100_CHG100 |
30 |
1.0 |
1.0 |
8 |
104.92 |
Figure 12. Engineering variant comparison across supercapacitor (SC) capacity, photovoltaic (PV) derating and charger capacity
Table 13 lists twenty routed-path feasibility and constraint checks, including the added quality-derated PV-to-Grid export constraints.
All hard feasibility checks pass. The maximum power-balance residual is 7.28e-12 kW, consistent with numerical round-off. The derated photovoltaic-to-grid export check confirms that export remains within the dynamic grid-quality-dependent limit, and the EV service tracking gap is reported as an informational value reflecting full utilization of the 60 kW outlet during high-demand intervals.
Table 13. Routed-path feasibility and constraint checks
|
Check |
Status |
Value |
|
EV charge path limit |
Pass |
Max 60.00 kW <= 60.00 kW |
|
EV discharge path limit |
Pass |
Max 5.06 kW <= 30.00 kW |
|
No simultaneous EV charge/discharge |
Pass |
Overlap samples = 0 |
|
No simultaneous supercapacitor (SC) charge/discharge |
Pass |
Overlap samples = 0 |
|
No simultaneous grid import/export |
Pass |
Overlap samples = 0 |
|
SC charge path limit |
Pass |
Max 43.69 kW <= 60.00 kW |
|
SC discharge path limit |
Pass |
Max 60.00 kW <= 60.00 kW |
|
Grid sink path limit |
Pass |
Max 60.00 kW <= 60.00 kW |
|
PV -> Grid export limit |
Pass |
Max 60.00 kW <= 60.00 kW |
|
PV -> Grid derating respected during connected weak-grid operation |
Pass |
Max 60.00 kW <= dynamic limit 60.00 kW |
|
PV -> Grid blocked during severe grid-quality violation |
Pass |
Severe-quality samples with PV export = 0 |
|
No grid import during outage |
Pass |
Outage samples with import = 0 |
|
No grid export during outage |
Pass |
Outage samples with export = 0 |
|
No EV -> Grid during outage |
Pass |
Outage samples with EV -> Grid = 0 |
|
No Grid -> SC during outage |
Pass |
Outage samples with Grid -> SC = 0 |
|
SC SOC operating bounds |
Pass |
SC SOC 23.14 to 95.00% within 15.0 to 95.0% |
|
Power-balance residual |
Pass |
Max 7.28e-12 kW |
|
EV service tracking gap |
Info |
Max 6e+04 W |
|
Phase-shift encoding check |
Pass |
Encoded max 90.00 deg <= 90.00 deg |
|
Duty-reference limit |
Pass |
Range 0.000 to 0.410 p.u. |
The sensitivity of the system to supercapacitor capacity under quality-derated photovoltaic-to-grid export is summarized in Table 14.
Table 14. Supercapacitor sensitivity under quality-derated photovoltaic-to-grid export
|
Metric |
SC30 Main |
SC50 Sensitivity |
|
Supercapacitor (SC) capacity (kWh) |
30 |
50 |
|
Completed EV targets |
8 |
8 |
|
Unserved energy (kWh) |
104.92 |
97.14 |
|
PV→EV energy (kWh) |
171.76 |
171.76 |
|
PV→SC energy (kWh) |
32.39 |
38.39 |
|
PV→Grid energy (kWh) |
288.00 |
288.00 |
|
Residual PV curtailment (kWh) |
514.21 |
508.21 |
|
SC state of charge (SOC) range (%) |
23.14–95.00 |
24.91–95.00 |
A 50 kWh supercapacitor sensitivity case was added to determine whether residual photovoltaic curtailment is mainly storage-limited or constrained by the combined charger/export bottleneck. The 30 kWh supercapacitor remains the main base configuration, while the 50 kWh case is used only as an engineering sensitivity. The 50 kWh case reduces unserved energy from 104.92 kWh to 97.14 kWh and residual photovoltaic curtailment from 514.21 kWh to 508.21 kWh, indicating that additional local buffering helps but the remaining curtailment is still dominated by the single-outlet and grid-interface bottleneck.
A seasonal photovoltaic sensitivity was also performed to determine whether the high residual curtailment is only a summer sizing artifact or whether the station remains stressed under low winter irradiation. The same WOA-tuned controller was used without winter retuning. As shown in Table 15, the January case reduces residual photovoltaic curtailment from 514.21 to 56.76 kWh because the available photovoltaic energy falls from 1006.36 to 442.80 kWh. However, the lower photovoltaic availability increases grid-to-electric-vehicle energy from 59.83 to 71.50 kWh and slightly increases unserved energy from 104.92 to 107.25 kWh, while the number of completed electric-vehicle targets remains 8/10. January is selected as the explicit representative month because it has the lowest monthly photovoltaic production in the PVGIS benchmark, while the interpretation is extended cautiously to the broader low-production period that includes January, February, November, and December. This confirms that the 150 kWp array is not reduced solely to improve summer curtailment; its rating supports service resilience during low-photovoltaic months and outage-constrained operation. The January representative sensitivity confirms that the 150 kWp photovoltaic rating should not be downsized solely to reduce summer residual curtailment. Although only January is explicitly simulated, it represents the low-photovoltaic production period that includes January, February, November, and December. Although the January case reduces residual photovoltaic curtailment because available solar energy is much lower, it also increases grid-to-electric-vehicle energy and slightly increases unserved energy under the same outage and demand conditions. Therefore, the selected photovoltaic rating is interpreted as a seasonal sizing trade-off between low-irradiance service resilience and summer surplus management.
Table 15. Seasonal photovoltaic (PV) sensitivity under summer and January availability
|
Metric |
Summer High-PV Stress |
January Winter Low-PV |
|
PV scale |
1.00 |
0.44 |
|
Available PV energy (kWh) |
1006.36 |
442.80 |
|
Completed EV targets |
8/10 |
8/10 |
|
Unserved energy (kWh) |
104.92 |
107.25 |
|
PV→EV energy (kWh) |
171.76 |
143.59 |
|
PV→SC energy (kWh) |
32.39 |
45.62 |
|
PV→Grid energy (kWh) |
288.00 |
196.82 |
|
Residual PV curtailment (kWh) |
514.21 |
56.76 |
|
Grid→EV energy (kWh) |
59.83 |
71.50 |
|
Supercapacitor (SC) SOC range (%) |
23.14–95.00 |
23.45–95.00 |
The framework coordinates PV, grid, SC and EV resources at supervisory level under weak-grid conditions representative of northern Iraq. The remaining residual PV curtailment represents only the surplus that cannot be absorbed by EV charging, SC charging or quality-derated grid export. It is therefore a sizing and operating limitation caused by the single 60 kW outlet, finite SC capacity, grid-interface export rating, outage periods and the near-peak summer PV stress profile, rather than a disabled export path. The WOA-tuned EMS is interpreted primarily through its service-oriented objective, which gives dominant weight to EV target completion, unserved-energy reduction, feasibility, and weak-grid constraint satisfaction. Therefore, the controller comparison should not be read as a universal dominance claim across all secondary energy-accounting indicators. In the nominal stress day, the WOA-tuned EMS gives the strongest primary service outcome, while the Rule-Based controller can show favorable secondary indicators such as PV export or residual PV curtailment. For metrics where statistical significance was not established, the comparison is reported as a numerical trend and interpreted alongside the primary service-priority objective. The WOA-tuned fuzzy EMS improved the primary service-priority performance under the tested weak-grid outage scenario, while secondary energy-routing indicators revealed expected trade-offs between EV service delivery, PV export, and residual PV curtailment.
The authors thank the University of Mosul, College of Engineering, for their valuable contribution to improving the quality of this work.
[1] International Energy Agency, Iraq’s Energy Sector: A Roadmap to a Brighter Future. Paris, France: IEA. https://www.iea.org/reports/iraqs-energy-sector-a-roadmap-to-a-brighter-future.
[2] International Renewable Energy Agency, Energy Transition Assessment: Iraq. Abu Dhabi, UAE: IRENA. https://www.irena.org/Publications/2025/Jul/Energy-Transition-Assessment-Iraq.
[3] Aldarraji, M., Vega-Márquez, B., Pontes, B., Mahmood, B., Riquelme, J.C. (2024). Addressing energy challenges in Iraq: Forecasting power supply and demand using artificial intelligence models. Heliyon, 10(4): e25821. https://doi.org/10.1016/j.heliyon.2024.e25821
[4] Abraham, D.S., Verma, R., Kanagaraj, L., et al. (2021). Electric vehicles charging stations’ architectures, criteria, power converters, and control strategies in microgrids. Electronics, 10(16): 1895. https://doi.org/10.3390/electronics10161895
[5] Alrubaie, A.J., Salem, M., Yahya, K., Mohamed, M., Kamarol, M. (2023). A comprehensive review of electric vehicle charging stations with solar photovoltaic system considering market, technical requirements, network implications, and future challenges. Sustainability, 15(10): 8122. https://doi.org/10.3390/su15108122
[6] Saadaoui, A., Ouassaid, M., Maaroufi, M. (2023). Overview of integration of power electronic topologies and advanced control techniques of ultra-fast EV charging stations in standalone microgrids. Energies, 16(3): 1031. https://doi.org/10.3390/en16031031
[7] Bhatti, A.R., Tamoor, M., Liaqat, R., et al. (2024). Electric vehicle charging stations and the employed energy management schemes: A classification based comparative survey. Discover Applied Sciences, 6(10): 1-35. https://doi.org/10.1007/s42452-024-06190-9
[8] Motlagh, S.G., Oladigbolu, J., Li, L. (2025). A review on electric vehicle charging station operation considering market dynamics and grid interaction. Applied Energy, 392: 126058. https://doi.org/10.1016/j.apenergy.2025.126058
[9] Alamgir, S., Hassan, S.J.U., Mehdi, A., et al. (2025). A comprehensive review of vehicle–to–grid (V2G) technology as an ancillary services provider. Results in Engineering, 27: 106813. https://doi.org/10.1016/j.rineng.2025.106813
[10] Bianchi, F., Falsone, A., Vignali, R. (2023). Vehicle-to-Grid and ancillary services: A profitability analysis under uncertainty. IFAC-PapersOnLine, 56(2): 7077-7083. https://doi.org/10.1016/j.ifacol.2023.10.571
[11] Channi, H.K. (2024). Optimizing electric vehicle charging infrastructure: A site selection strategy for Ludhiana, India. Mechatronics and Intelligent Transportation Systems, 3(3): 179-189. https://doi.org/10.56578/mits030304
[12] CENELEC, EN 50160:2022, Voltage characteristics of electricity supplied by public electricity networks. Brussels, Belgium: European Committee for Electrotechnical Standardization. https://www.nen.nl/en/nen-en-50160-2022-en-305139.
[13] Kar, R.R., Wandhare, R.G. (2023). Energy management system for electric vehicle charging stations with photovoltaic integration in weak grids. In 2023 IEEE 20th India Council International Conference (INDICON), Hyderabad, India, pp. 398-402. https://doi.org/10.1109/INDICON59947.2023.10440858
[14] Yadav, A.K., Bharatee, A., Ray, P.K. (2023). Solar powered grid integrated charging station with hybrid energy storage system. Journal of Power Sources, 582: 233545. https://doi.org/10.1016/j.jpowsour.2023.233545
[15] Abraham, D.S., Chandrasekar, B., Rajamanickam, N., et al. (2023). Fuzzy-based efficient control of DC microgrid configuration for PV-energized EV charging station. Energies, 16(6): 2753. https://doi.org/10.3390/en16062753.
[16] Borhani, A., Ouadi, H. (2024). PV and energy storage systems management for EV charging optimization in residential parks. IFAC-PapersOnLine, 58(13): 398-403. https://doi.org/10.1016/j.ifacol.2024.07.515
[17] Çakmak, R., Bayrak, G., Koç, M. (2025). A fuzzy logic-based energy management approach for fuel cell and photovoltaic powered electric vehicle charging station in DC microgrid operations. IEEE Access, 13: 49905-49921. https://doi.org/10.1109/access.2025.3552253
[18] European Commission Joint Research Centre, Photovoltaic Geographical Information System (PVGIS): Grid-Connected PV Tool. https://re.jrc.ec.europa.eu/pvg_tools/en/.
[19] Keya, D.R., Farangis, B., Sirwan, R.A.N.J., Behler, K. (2023). Gis-based analysis of the solar radiation mapping and potential assessment for the North Iraq-Kurdistan Region. Journal of Engineering Science and Technology, 18(5): 2269-2280.
[20] Buticchi, G., Costa, L.F., Barater, D., Liserre, M., Amarillo, E.D. (2017). A quadruple active bridge converter for the storage integration on the more electric aircraft. IEEE Transactions on Power Electronics, 33(9): 8174-8186. https://doi.org/10.1109/tpel.2017.2781258
[21] Zubieta, L., Bonert, R. (2000). Characterization of double-layer capacitors for power electronics applications. IEEE Transactions on Industry Applications, 36(1): 199-205. https://doi.org/10.1109/28.821816
[22] Zadeh, L. (1965). Fuzzy sets. Information and Control, 8(3): 338-353. https://doi.org/10.1016/s0019-9958(65)90241-x.
[23] Mamdani, E., Assilian, S. (1975). An experiment in linguistic synthesis with a fuzzy logic controller. International Journal of Man-Machine Studies, 7(1): 1-13. https://doi.org/10.1016/s0020-7373(75)80002-2
[24] Vivas, F., Segura, F., Andújar, J. (2022). Fuzzy logic-based energy management system for grid-connected residential DC microgrids with multi-stack fuel cell systems: A multi-objective approach. Sustainable Energy, Grids and Networks, 32: 100909. https://doi.org/10.1016/j.segan.2022.100909.
[25] Mirjalili, S., Lewis, A. (2016). The whale optimization algorithm. Advances in Engineering Software, 95: 51-67. https://doi.org/10.1016/j.advengsoft.2016.01.008
[26] International Energy Agency, Global EV Outlook 2025: Electric Vehicle Charging. Paris, France: IEA, 2025. [Online]. https://www.iea.org/reports/global-ev-outlook-2025/electric-vehicle-charging.
[27] Sechilariu, M., Reinders, A.H.M.E., Krim, Y., et al. (2021). PV-powered electric vehicle charging stations: Preliminary requirements and feasibility conditions. International Energy Agency. https://doi.org/10.69766/GCNI2656
[28] Kim, S., Hur, J. (2020). A probabilistic modeling based on Monte Carlo simulation of wind powered EV charging stations for steady-states security analysis. Energies, 13(20): 5260. https://doi.org/10.3390/en13205260