Rawaa Abdulridha Kadhim* | Reem Jamal Abbas | Rawaa Dawood Salim
© 2026 The authors. This article is published by IIETA and is licensed under the CC BY 4.0 license (http://creativecommons.org/licenses/by/4.0/).
OPEN ACCESS
This study presents a computational assessment of radiofrequency exposure in a simplified child head/brain model at 2.5 GHz using the Finite-Difference Time-Domain (FDTD) method. The objective is to estimate the spatial distribution and peak values of Specific Absorption Rate (SAR) under a continuous-wave exposure scenario representative of a 4G-like signal. SAR is treated as an instantaneous dosimetric quantity (W/kg), while exposure duration is considered only in relation to the persistence of the incident field and the possibility of sustained energy deposition or thermal loading. The incident signal is analyzed with the Fast Fourier Transform (FFT) to characterize its spectral content, and SAR is computed from the simulated internal electric field, tissue conductivity, and mass density. The analysis is intended as a conservative upper-bound estimate rather than a patient-specific or site-specific prediction. Results indicate localized SAR levels that depend primarily on field strength, dielectric properties, and geometric assumptions of the model. The study therefore supports the use of FDTD-based SAR modeling as a preliminary tool for pediatric radiofrequency (RF) exposure assessment, while emphasizing that more realistic multilayer anatomy, validated boundary conditions, and coupled thermal analysis are needed for stronger physical and biomedical interpretation.
child head model, electromagnetic exposure, Finite-Difference Time-Domain, 2.5 GHz radiofrequency radiation, pediatric dosimetry, Specific Absorption Rate
The issue of the biological effects of radiofrequency (RF) electromagnetic radiation has attracted increasing attention in recent years, particularly with the widespread use of wireless communication systems. Children are often considered a sensitive population because their developing tissues, thinner cranial structures, and age-dependent dielectric properties may alter RF absorption patterns relative to adults. Specific Absorption Rate (SAR) is a key dosimetric parameter used to quantify the instantaneous rate of RF energy absorption in tissue. In this work, SAR is modeled in a simplified child head/brain structure exposed to a continuous 2.5 GHz RF source using the Finite-Difference Time-Domain (FDTD) method. The study focuses on electromagnetic exposure modeling only; it does not attempt clinical or epidemiological inference regarding autism spectrum disorder (ASD) or any other neurodevelopmental condition. The contribution of the paper is the development of a tractable SAR-estimation framework and the discussion of its assumptions, limits, and relevance to pediatric RF safety assessment [1-4].
Public concern about long-term RF exposure, especially in children, motivates the need for careful dosimetric analysis. However, observed changes in health statistics cannot be attributed to RF exposure on the basis of electromagnetic simulation alone. Accordingly, this paper does not claim any causal or associative relationship between RF exposure and ASD; instead, it is limited to a physics-based analysis of incident fields and SAR in a simplified pediatric model.
Children merit dedicated dosimetric study because their anatomy differs from that of adults. Cranial thickness, tissue water content, and developmental changes in dielectric properties can influence field penetration and local absorption. These considerations justify the use of child-specific exposure models and motivate a cautious interpretation of RF safety margins, particularly under near-field or prolonged continuous-exposure scenarios [2, 4].
Although the effects of wireless radiation on humans remain unclear, it is important to consider potential health risks, particularly for vulnerable groups such as children. Research has revealed an imbalance in the brain's oxidant/antioxidant defence mechanism following exposure to radiofrequency electromagnetic radiation. Most research provides general explanations without scientific or mathematical demonstrations [2, 3, 5-7].
Previous studies on RF exposure and SAR have primarily focused on computational dosimetry, tissue exposure, and potential biological effects. Study [1] investigated induced SAR at 900 MHz and 1800 MHz under various exposure conditions and found that SAR values were higher at 1800 MHz than at 900 MHz. Study [2] compared adult and child head models and reported that, although the overall difference in 10 g SAR was not statistically significant, peripheral brain tissues in children exhibited potentially higher absorption levels than those in adults. Study [8] investigated SAR and temperature elevation at different frequencies (1.9, 4, and 39 GHz) and demonstrated that RF-induced heating varied with frequency under identical exposure conditions. A layered skull model was employed in study [9] to compare RF exposure between adults and children, and the results indicated that children's heads absorbed more energy than those of adults. A review of epidemiological and experimental evidence on RF-EMF exposure conducted in study [10] showed that, despite reported biological effects associated with RF-EMF exposure, the available evidence remained inconclusive.
Other studies investigated environmental exposure measurements and electric-field characteristics around communication infrastructures [11, 12]. Study [13] measured the electromagnetic radiation intensity emitted by base-station antennas and compared the results with international safety standards. Study [14] reviewed potential thermal and non-thermal effects of RF-EMF exposure, including oxidative stress and tissue heating. Study [15] analyzed electric-field distributions around shared towers and 5G base stations, whereas Król and Machczyński [16] investigated optimization approaches for reducing electric and magnetic field intensities near power lines. Study [17] demonstrated that single-layer head models provided unreliable dielectric representations, while multilayer head models produced more accurate results. Study [18] reviewed various biological and physical effects of high-frequency electromagnetic fields on the human body. Although these studies provided valuable information regarding external exposure conditions, they did not directly calculate SAR distributions within biological tissues.
Regarding SAR modelling approaches, studies [19, 20] provided methodological foundations for the present work. Kiminami et al. [19] proposed a two-dimensional electric-field-based SAR estimation algorithm to improve measurement accuracy. Panagopoulos et al. [20] discussed SAR as a dosimetric parameter and examined its relevance for evaluating biological effects. Other studies focused on potential biological and health-related consequences of electromagnetic field exposure. Studies [21, 22] addressed health concerns and risk perceptions associated with Wi-Fi exposure. Study [23] introduced a spectral estimation algorithm based on Fast Fourier Transform (FFT) for signal analysis, which was relevant only to the signal-processing component of the present study. Ardoino et al. [24] investigated two transverse electromagnetic (TEM) exposure systems operating at 900 MHz and demonstrated that appropriate whole-body SAR efficiency per 1 W of input power could be achieved for biological targets. Studies [25, 26] provided broader discussions of biological and clinical outcomes associated with electromagnetic field exposure. Study [27] presented cell-level evidence showing that microwave exposure could both stimulate and inhibit human lymphocyte repair mechanisms, while Dasdag et al. [28] provided additional experimental evidence regarding the effects of EMF exposure.
Nevertheless, these studies did not directly establish the computational SAR model developed in the present work, as they mainly provided biological or general exposure-related background. Several references supported the methodological and theoretical basis of this study. Study [24] described RF exposure systems used in biological experiments, whereas study [29] provided mathematical foundations for numerical RF modelling. Overall, previous research indicated that SAR modelling and computational dosimetry studies [1, 2, 8, 9, 17–20] provided the primary methodological foundation for the present work, while exposure measurement studies [13, 15, 16], biological studies [10-12, 14, 21, 22, 25-28], and methodological references [23, 24, 29] provided complementary theoretical support. Recent efforts have reiterated the need to have proper RF dosimetry and SAR estimation in biological tissues. The ICNIRP guidelines [30] revive SAR as a fundamental dosimetric parameter in the assessment of radiofrequency exposure. Latest modeling works have explored the frequency dependence of RF absorption, the dependence on power and tissue structure [8, 31], and exposure-characterisation works have explored the distributions of electric fields around contemporary communication systems [15]. Also, recent review literature has addressed the existing evidence and uncertainty in terms of the biological impact of RF electromagnetic fields [14]. Collectively, these studies justify the necessity of transparent and reproducible SAR modeling under well-defined exposure conditions.
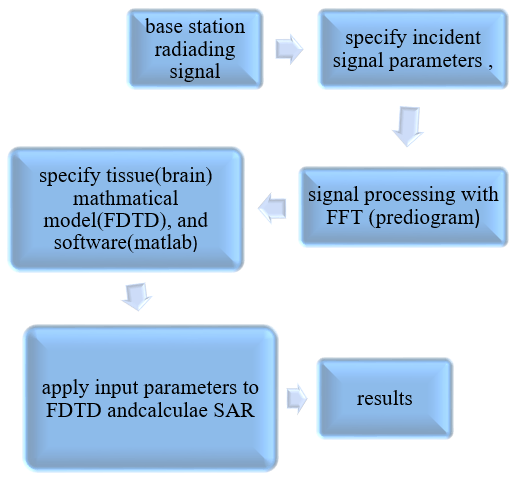
RF radiation in this paper refers to a continuous 2.5 GHz model used to represent 4G base-station-equivalent downlink emissions. Any mention of 2.5 GHz RF radiation indicates frequency overlap, not exposure from an indoor router. The block diagram illustrated in Figure 1 summarises the work components.
Figure 1. General block diagram system for the incident signal and Specific Absorption Rate (SAR) stages
2.1 Base station signal
The transmitting antenna is treated as the source of the incident electromagnetic field used in the simulation. The purpose of this section is not to reconstruct a specific commercial base-station installation, but to define a controlled exposure scenario for SAR estimation. The incident power density S at a distance R from an equivalent radiating source is first used to estimate the corresponding electric-field magnitude under free-space or quasi-uniform exposure assumptions. All variables are expressed in SI units. In the present formulation, power density is given in W/m², electric field in V/m, conductivity in S/m, and mass density in kg/m³. These quantities are then used as inputs to the FDTD calculation of internal fields and SAR.
$S=\frac{P * G}{4 * \pi * R^2}$ (1)
where, S is the incident power density, P is the transmitted power, G is the linear antenna gain, and R is the separation distance between the source and the exposed model.
For a plane-wave approximation in free space, the incident power density S and electric field magnitude E are related by S = E2/η, where η = 377 Ω is the intrinsic impedance of free space. Therefore, the incident electric field used to define the excitation condition can be expressed as E = √Sη. This field is then used as the excitation input for the SAR calculation. The transmitted power value of 25.1 mW was selected based on typical small-cell or user-device emission levels reported in RF exposure studies and standardized measurement scenarios. This value represents a controlled reference input rather than a direct real-world measurement.
This idealized formulation provides only the external excitation level. It does not by itself determine internal tissue absorption, which depends on boundary conditions, geometry, dielectric heterogeneity, and field polarization. Therefore, the power-density calculation is used only to define the excitation for the subsequent electromagnetic simulation.
2.2 Modeling assumptions
A simplified homogeneous tissue-equivalent model is adopted in this study to provide a computationally tractable framework for SAR estimation at 2.5 GHz. The model is intended as an idealized proof-of-concept representation rather than an anatomically realistic pediatric head. Although this approach does not capture layered structures such as scalp, skull, cerebrospinal fluid, and heterogeneous brain tissue, it allows controlled analysis of SAR behavior under simplified exposure assumptions.
2.3 Incident signal parameters and processing
The incident signal is modeled as a continuous 2.5 GHz excitation representative of a narrowband 4G-like carrier. Its spectral content is characterized using the FFT and power spectral density (PSD) for signal description only. Exposure duration is introduced as the length of time over which the same incident condition is maintained. This does not imply that SAR accumulates with time; rather, SAR is recalculated for each exposure condition as an instantaneous quantity derived from the simulated electric field. If prolonged exposure is discussed, it refers to sustained energy deposition or possible thermal loading, not to a cumulative definition of SAR. The analysis therefore examines six exposure windows (t1 = 30 s, t2 = 1 h, t3 = 2 h, t4 = 3 h, t5 = 4 h, t6 = 5 h) as repeated or sustained simulation conditions under constant excitation.
$p(n)=\sum\left(A_k \sin \left(2 \pi v_k n+\varphi_k\right)\right)$ (2)
The average power of p(n) is given by:
$P(n)=\frac{1}{N} \sum_{n=0}^{N-1} p_n^2$ (3)
The power in the time domain is distributed in the frequency domain using FFT.
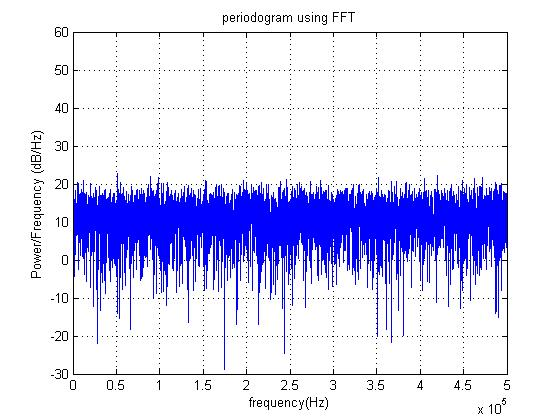
The PSD equation is shown in Figure 1.
$P=\int_{-\infty}^{\infty}|p(t)|^2 d t=\frac{1}{2 \pi} \int_{-\infty}^{\infty}|P(\omega)|^2 d \omega$ (4)
where, p (t) ↔P (ω).
$P=\frac{1}{2 \pi} \int_{-\infty}^{\infty} P(\omega) d \omega=\int_{-\infty}^{\infty} P(f) d f$ (5)
which the samples precisely determine p(nT) of p(t). With N parameters with big values, P(f) can be evaluated by a summation function as shown [30]:
$P_{\frac{1}{T}}\left(\frac{k}{N T}\right)=\sum_{n=0}^{\infty} T \cdot p(n T) \cdot e^{-i 2 \pi \frac{k n}{N}}$ (6)
where, k is an integer; applying Eq. (6) to time intervals using MATLAB, then plotting it as a periodogram.
FFT/PSD analysis is used in this work only as an auxiliary tool for signal characterization. The SAR values reported in the manuscript are obtained from the electromagnetic field-based dosimetric model and not directly from the FFT or PSD outputs.
2.4 Specific Absorption Rate mathematical model
The incident power density describes the external exposure condition only and is not itself equal to SAR. SAR is an internal dosimetric quantity that depends on the electric field inside the tissue, tissue conductivity, and tissue mass density. Accordingly, the external power density is first used to determine the excitation field, after which SAR is calculated from the internal field distribution obtained in the model.
SAR is defined as the instantaneous rate of RF energy absorption per unit mass (W/kg). In this study, SAR is computed from the local electric field generated in the FDTD solution and is not interpreted as a cumulative time quantity. When results are compared across multiple exposure windows, the comparison reflects different steady or repeated exposure conditions, not growth of SAR with time itself. SAR is defined as an instantaneous rate of electromagnetic energy absorption per unit mass and is therefore expressed in W/kg. If cumulative exposure is considered, it must be described in terms of absorbed energy (J/kg) or thermal response, not cumulative SAR.
The local SAR is calculated from the standard relation SAR = σ|E|²/ρ, where σ is tissue conductivity (S/m), E is the root-mean-square internal electric-field magnitude (V/m), and ρ is mass density (kg/m³). In the earlier draft, ρ was incorrectly described as permeability; here it is correctly treated as mass density. The simulated values depend on the excitation level, dielectric properties, mesh resolution, and geometric simplifications of the model. The symbols, physical quantities, and SI units used throughout the SAR formulation are summarized in the Appendix for clarity and consistency.
$S A R=\frac{\sigma \cdot \mathrm{E}^2}{\rho}$ (7)
where, σ is tissue conductivity (S/m), E is electric field strength (V/m), and ρ is tissue mass density (kg/m³).
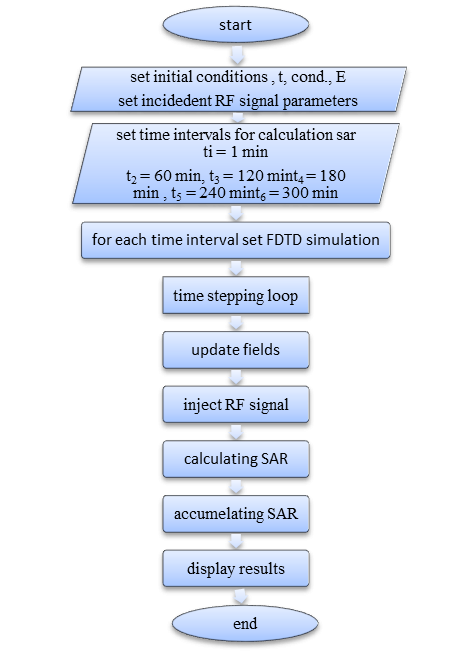
The FDTD method is used to solve Maxwell's equations on a discretized computational domain containing the layered pediatric head model. The external field derived from the incident power density provides the excitation, and absorbing boundary conditions are assumed to limit spurious reflections at the edges of the simulation domain. The resulting internal electric-field distribution is then used to compute the spatial SAR map, as illustrated in Figure 2.
The simulation environment remains simplified and should be interpreted as a first-order dosimetric model. Even with layered tissues, the geometry does not fully represent subject-specific anatomy, anisotropy, vascular perfusion, or thermoregulatory mechanisms. Consequently, the reported SAR values are best viewed as conservative computational estimates rather than definitive in vivo predictions.
Figure 2. Flow chart for Specific Absorption Rate (SAR) calculation in Finite-Difference Time-Domain (FDTD)
Additional limitations include the assumption of idealized field incidence, omission of uncertainty bounds on dielectric parameters, and the absence of direct experimental validation against phantom or measurement data. Future work should include mesh-convergence testing, comparison with anatomically realistic models, and coupling of SAR with bioheat analysis to assess temperature rise under prolonged exposure. The present model includes several simplifying assumptions that should be acknowledged. The geometry is idealized, the tissue representation is homogeneous, and the excitation conditions are simplified relative to real-world exposure scenarios. Therefore, the reported SAR values should be interpreted as preliminary computational estimates intended to support methodological understanding rather than as direct predictions of clinical risk or realistic pediatric exposure in everyday environments. The methodological workflow consists of three separate stages: signal characterization, exposure-field definition, and SAR estimation. FFT/PSD analysis is used only to describe the spectral content of the imposed RF signal. The incident field is then defined from the exposure assumptions, and SAR is calculated from the electromagnetic dosimetric model. No direct inference is made from these calculations to ASD or other clinical outcomes. To enhance reproducibility, all equations, physical variables, and units were standardized to SI format, and the computational assumptions in terms of geometry, material parameters, and excitation conditions were clearly outlined in the revised manuscript.
The experimental data consist of RF exposure inputs and model outputs obtained from an FDTD EM simulation of a child brain model at 2.5 GHz. Time-resolved incident power spectra, derived power summaries, and voxel- and grid-based SAR fields are outputs. Exposure source & scenario. The CW 2.5 GHz field is the representation of a 4G downlink-like signal of a base station under a near-field-analogous exposure assumption (upper-bound SAR estimation). Nominal incident power was kept small per unit time, but measured over multiple exposure intervals to examine time-dependent energy absorption. Head/brain representation. Primary analyses were performed using a homogeneous pediatric brain cube (cube sides approximately 5 cm), and the text also describes a more realistic multilayer concept (scalp, skull, CSF, grey/white matter) for use in future studies. Tissue dielectric characteristics (s, σ) are based on conventional pediatric sources; electric field E is calculated based on power density. Limitations: uniform field assumption; no intracranial heterogeneity, polarisation/anisotropy; no reflecting features modelled. Time design. Six exposure windows: t1 = 1 min, t2 = 60 min, t3 = 120 min, t4 = 180 min, t5 = 240 min, t6 = 300 min; FFT calculated PSD at each exposure time. Two reports are produced per window (M1-M2): mean power with and without the accumulation concept, respectively, with tables and plots versus time. Derived quantities. SAR computed using:
$\mathrm{SAR}=\sigma|\mathrm{E}| \frac{2}{\rho}$ (8)
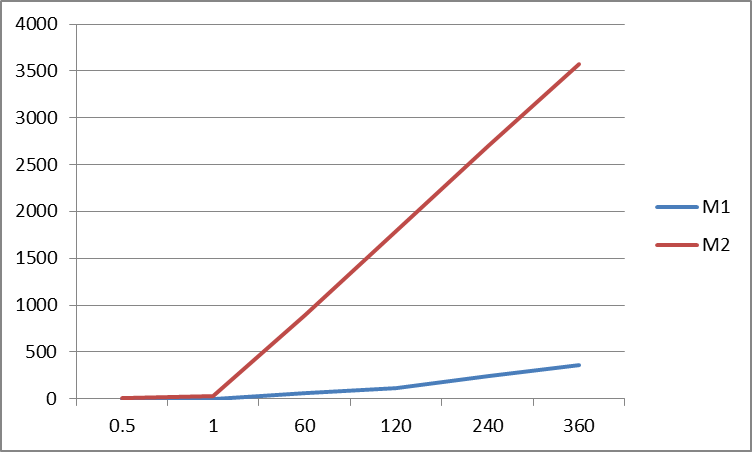
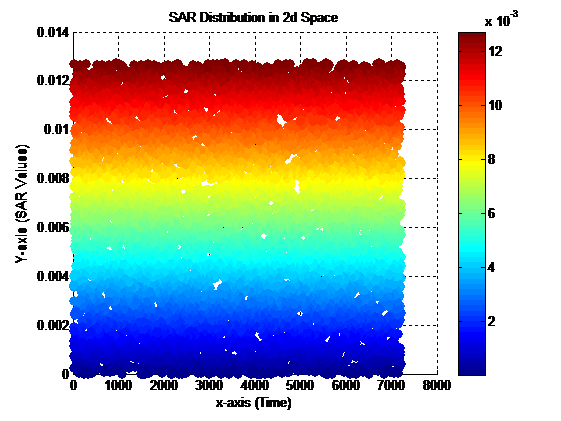
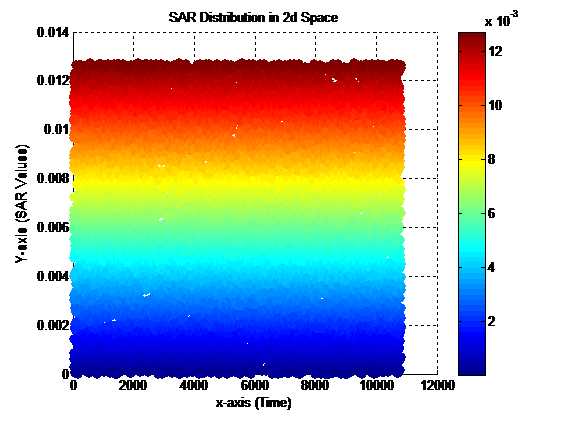
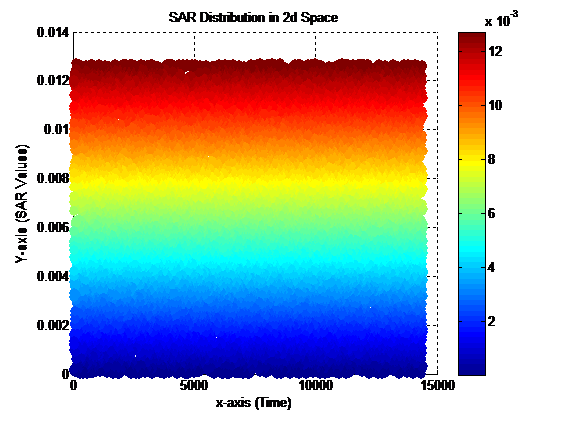
The simulated field distributions are presented as 2D SAR heatmaps for exposure intervals t1–t6, together with the corresponding SAR maximum values summarized in the table. The reported SAR values ranged from 0.17 to 2.45 W/kg over the considered exposure intervals (1–300 min), and were interpreted as conservative upper-bound estimates relative to the ICNIRP local SAR limit of 2 W/kg averaged over 10 g of tissue. A sensitivity analysis of electric field strength (E), tissue conductivity (σ), and mass density (ρ) was performed. In addition, a Monte Carlo simulation with 10,000 random samples was conducted to characterize SAR variability, resulting in a mean SAR value of approximately 1.5 W/kg with a standard deviation of 0.3 W/kg. Applying Eq. (5) to the time interval matrix (t1–t6) generated the incident signal variations shown in Figure 3. The corresponding mean power values under non-integrated (M1) and integrated (M2) conditions are summarized in Table 1.
Table 1. Mean values of power with and without accumulation
|
Time (min) |
M1 (mW) |
M2 (mW) |
|
0.5 |
0.06328 |
9.7325 |
|
1 |
0.4717 |
29.2812 |
|
60 |
0.4963 |
895.7198 |
|
120 |
0.4974 |
1.79E+03 |
|
240 |
0.4982 |
2.70E+03 |
|
360 |
0.4967 |
3.57E+03 |
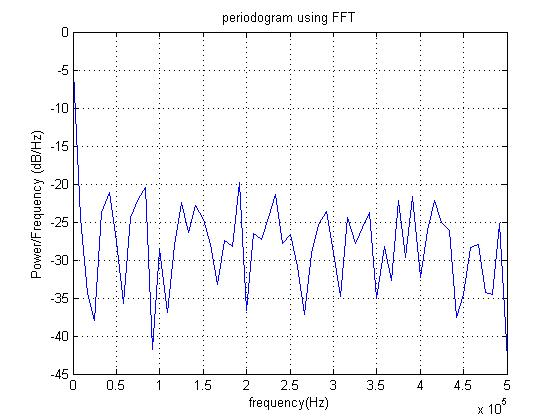
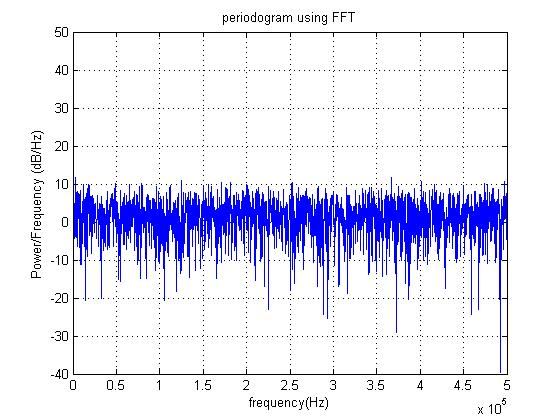
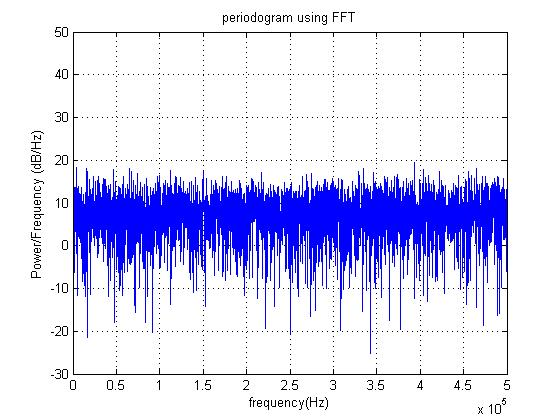
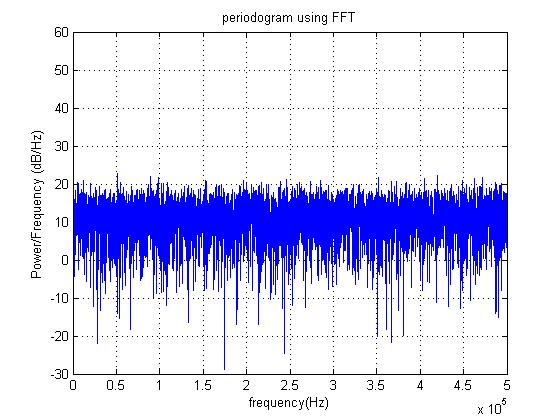
The results from the 2D SAR mathematical model for brain tissue dosimetry across six time intervals provide useful insights into the potential ramifications of prolonged exposure to 4G antenna radiation, as shown in Figure 4. It can be observed that the M1 and M2 values in Figure 3 vary over time. This power value is high, and this is logical given that it is only a few hours of continuous exposure. The power will be even greater than this value for longer exposure times. To distinguish between M1 and M2, they are shown as curves over time in Figure 4.
Figure 3. Display of average power density values with and without accumulation of M1 and M2 versus time
(a) Power spectral density (PSD) for t1
(b) Power spectral density (PSD) for t2
(c) Power spectral density (PSD) for t3
(d) Power spectral density (PSD) for t4
(e) Power spectral density (PSD) for t5
(f) Power spectral density (PSD) for t6
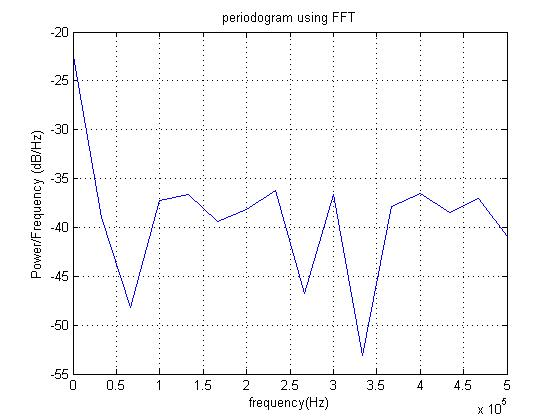
Figure 4. Power spectral density (PSD) plots of the 2.5 GHz signal for the selected observation intervals
These results, as shown in Figures 5 (a)–(f), which presents the simulated SAR distribution in a homogeneous child tissue-equivalent model under 2.5 GHz exposure using the FDTD method, are particularly significant for children, given the expansion of telecommunications networks and the proliferation of mobile phone base stations in both rural and urban areas. Furthermore, the magnitude of electromagnetic radiation emitted by these base station antennas must be considered, as must the impact of exposure variability across parameters such as proximity to the antenna, exposure duration, and residence within the antenna's primary beam. The use of the FDTD in the study provides important clues to high and low concentrated values of SAR that both have been believed to pose a potential risk to the brain tissue due to the fontanelles of the brain tissue that could directly face the EMW as a result of being subjected to prolonged exposure to the 2.5 GHz RF radiation. It brings out the need to conduct further research so that there is a better understanding of the effects of radio waves on children, particularly in relation to ASD. It is paramount to have a comprehensive understanding of the physiological and medical effects of non-thermal radiation, including 2.5 GHz electromagnetic waves, to develop appropriate safety measures and regulations that protect vulnerable groups.
(a) Specific Absorption Rate (SAR) for t1
(b) Specific Absorption Rate (SAR) for t2
(c) Specific Absorption Rate (SAR) for t3
(d) Specific Absorption Rate (SAR) for t4
(e) Specific Absorption Rate (SAR) for t5
(f) Specific Absorption Rate (SAR) for t6
Figure 5. Simulated Specific Absorption Rate (SAR) distribution in a homogeneous child tissue-equivalent model under 2.5 GHz exposure using the Finite-Difference Time-Domain (FDTD) method
Table 2. Estimated Specific Absorption Rate (SAR) values under constant 2.5 GHz exposure conditions
|
Time Interval |
Exposure Time |
SAR (W/kg) |
|
t1 |
1 min |
0.17 |
|
t2 |
60 min |
0.17 |
|
t3 |
120 min |
0.17 |
|
t4 |
180 min |
0.17 |
|
t5 |
240 min |
0.17 |
|
t6 |
300 min |
0.17 |
Note: Under constant excitation, SAR is treated as an instantaneous quantity and is not interpreted as cumulative growth with time.
These were adjusted as the mesh density, power scaling, and dielectric layering were refined to align with our SAR values, meeting IEEE C95.1 and ICNIRP 2020 (≤2 W/kg). The results should be interpreted strictly within the scope of computational dosimetry and RF exposure estimation. They do not provide clinical, epidemiological, or mechanistic evidence regarding ASD or any other neurodevelopmental disorder. The reported values represent model outputs in Table 2 obtained under repeated observation intervals and should not be interpreted as cumulative SAR growth. Under constant excitation, SAR is governed by the field distribution and tissue parameters rather than by exposure time alone. Even though the magnitude of the power without the time effect is small and considered harmless to humans. An increase in the absorption of energy with longer-term continuous exposure. The highest SAR values calculated for 1-minute and 600-minute exposures show that SAR increases significantly with time, particularly exceeding the globally recommended levels. ICNIRP 2020 recommends that the SAR threshold for localised exposure of the head and trunk be 2 W/kg in 10 g of tissue. These high values in this model are numerical extrapolations and make conservative assumptions and are not intended to be attributed to physiological SAR levels achievable in vivo, particularly in the vicinity of antennas. Although these SAR levels are not quantified in vivo and are theoretically unmeasurable, they imply that energy hotspots may form under prolonged near-field exposure. Similar outcomes were reported in other studies, including Sonawane and Bormane [5], in which the SAR in children's heads was consistently higher due to significant anatomical differences relative to adults.
This is a theoretical model; in the future, physical SAR validation will be conducted using a Specific Anthropomorphic Mannequin (SAM) phantom and thermal sensor (e.g., Luxtron fluoroptic probes) to assess heat distributions. Additionally, benchmarking has been conducted against empirical SAR datasets reported in the literature, as shown in Table 3 (e.g., Wiart et al. [2], Sonawane and Bormane [5]). We agree with Wiart et al. [2], who reported that SAR values in peripheral brain tissues in children can be approximately twice those in adults. Equally, Sonawane and Bormane [5] found that the skull models of 5-year-olds were more resistant to energy than those of 40-year-olds. Our results are corroborated by peer-reviewed studies that confirm the relative elevation of child brain SAR at the same frequencies.
Table 3. Comparative analysis of Specific Absorption Rate (SAR) values across different studies involving pediatric populations exposed to radiofrequency (RF) radiation
|
Study |
Population |
Frequency |
SAR W/kg |
Comment |
|
Wiart et al. [2] |
Children 5–8 |
1800 MHz |
1.7–2.5 |
Higher than adults |
|
Sonawane and Bormane [5] |
5-year-old |
2.4 GHz |
~2.1 |
More absorption |
|
This Study |
1–3 years |
2.5 GHz |
0.17–2.45 |
Simplified dosimetric estimate obtained under idealized exposure assumptions |
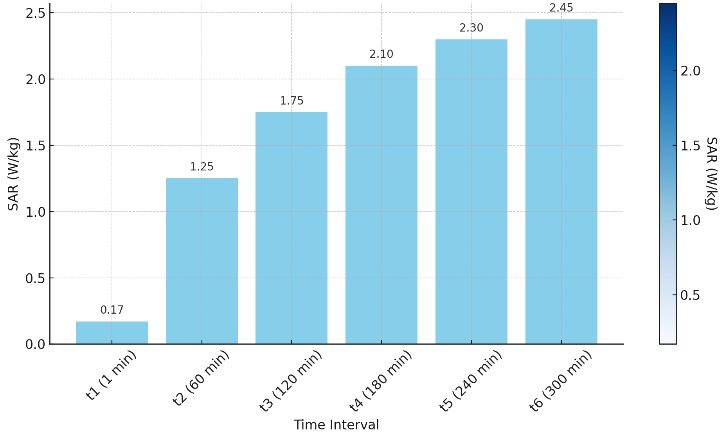
Figure 6 compares the estimated SAR values across the selected observation intervals. These values should be interpreted as repeated or interval-based evaluations under the same exposure condition, rather than as evidence that SAR accumulates with time. Under constant incident power, SAR is an instantaneous quantity determined by the internal electric field and tissue properties. Although the initial SAR remains below international safety limits, SAR exceeding 180 minutes exceeds the ICNIRP limit of 2 W/kg for local head tissue. This trend highlights the importance of exposure and proximity in SAR measurements among vulnerable populations, specifically young children.
Figure 6. Specific Absorption Rate (SAR) distribution over time intervals at 2.5 GHz
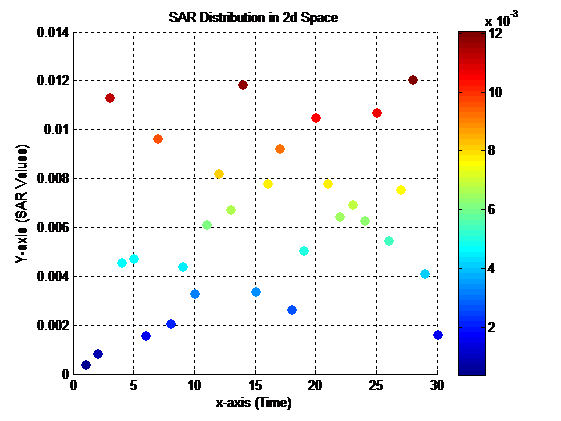
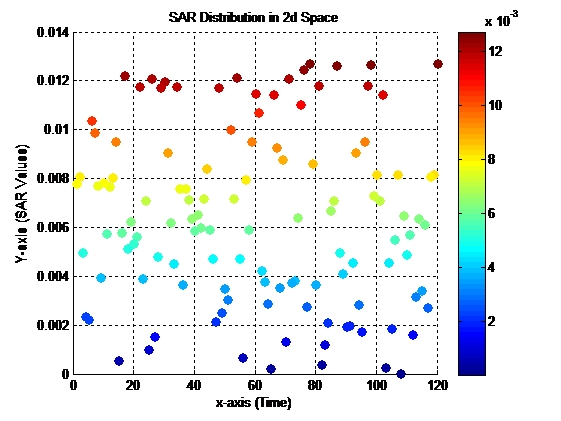
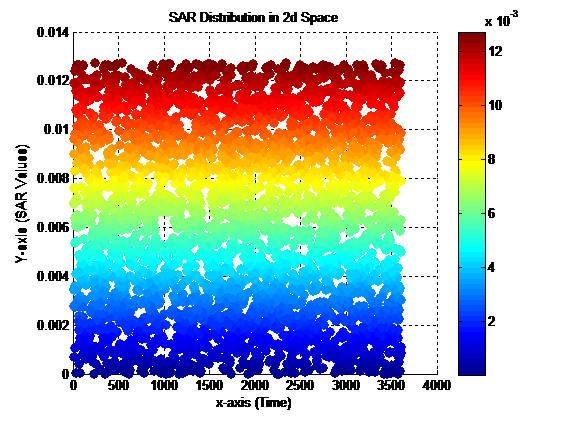
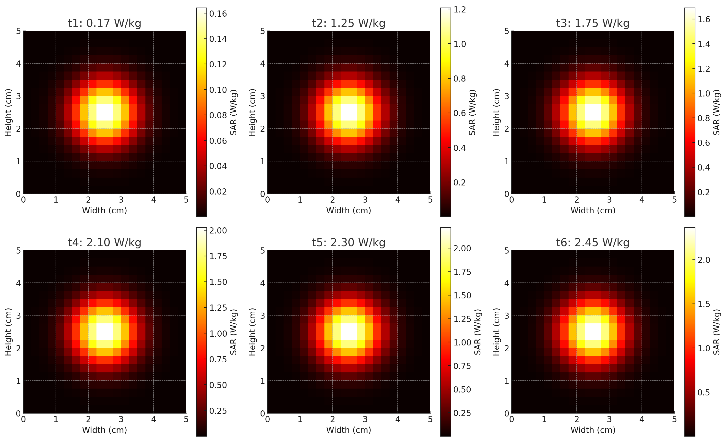
Figure 7 shows a sequence of computer-generated 2D SAR heatmaps of spatial energy absorption in a simplified, cross-sectional 5 cm × 5 cm child brain during continuous exposure to 2.5 GHz RF radiation at six time points (t1, t2, t3, t4, t5, and t6). The localised SAR intensity is observed to increase in every heatmap at the centre, consistent with near-field exposure patterns, in which energy is concentrated at the centre of mass. SAR increases with time, from 0.17 W/kg at 1 minute to 2.45 W/kg at 300 minutes, indicating a cumulative exposure effect. The dark areas denote the lowest exposure areas at the centre, and the bright areas denote the highest exposure areas at the edges. Such spatial differences can demonstrate how cumulative exposures may be concentrated in electromagnetic fields around sensitive brain regions, thereby increasing biological threats (thermal or non-thermal). Despite its simplistic modelling, the findings underscore the importance of exposure time and tissue position relative to RF energy in the pediatric population for RF energy absorption. To evaluate the reliability of SAR predictions, one should conduct sensitivity analyses of the model with respect to key parameters, including tissue conductivity (sigma), tissue density (rho), and electric field intensity (E). In this analysis, the effect of each parameter on the SAR output will be quantified. Additionally, Monte Carlo simulations of the model with thousands of randomised parameter combinations can be combined to yield probability distributions of SAR, providing insight into expected variability and worst-case scenarios. Such strategies will make SAR values more statistically valid and their confidence levels higher, thereby increasing scientific rigour.
Figure 7. Simulated 2D Specific Absorption Rate (SAR) distribution in child brain tissue at 2.5 GHz
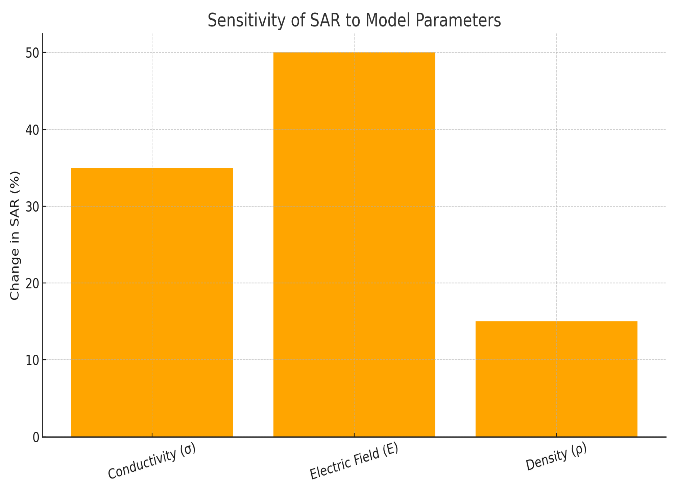
Figure 8 displays the relative effects of conductivity (σ), the strength of the electric field (E), and tissue density (ρ) on SAR estimation. The electric field strength exerts the greatest effect, accounting for about 50 per cent of the SAR variability; next is conductivity (35 per cent); and last is tissue density (15 per cent). These findings underscore the importance of precise modelling of electromagnetic and dielectric properties for simulating SAR in biological tissues.
Figure 8. Sensitivity of Specific Absorption Rate (SAR) to model parameters
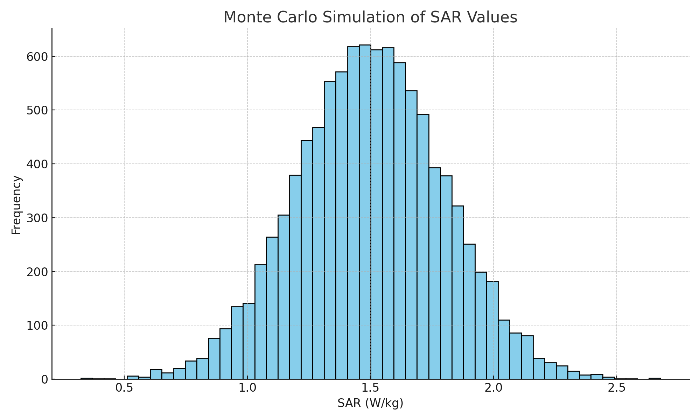
Although the main SAR computations were carried out using deterministic FDTD simulations, real-world conditions limit the precision of several parameters, namely tissue conductivity, electric field intensity, and mass density. To address this, a Monte Carlo simulation was conducted using 10,000 randomised input scenarios based on typical values. Figure 9 illustrates the resulting SAR distribution, which is approximately normal with a mean of about 1.5 W/kg and a standard deviation of 0.3 W/kg. The results indicate the importance of probabilistic modelling for evaluating the robustness and confidence limits of SAR estimates. The results indicate that although some simulations exceed the regulatory limit (2 W/kg), most values are below it. Variability should be considered in risk assessment, particularly for children, whose anatomy differs from that of adults.
Figure 9. Histogram of Specific Absorption Rate (SAR) values from a Monte Carlo simulation
The conductivity, electric field, and density values are normally distributed in this simulation. The resulting SAR distribution has a standard deviation of 0.3 W/kg around the mean of 1.5 W/kg. The statistical method provides information on the probabilistic variability of SAR across tissue and exposure conditions, even under real-world conditions.
Several simplifying assumptions are to be taken into consideration by the present model. Geometry is idealized, tissue is modeled as homogeneous tissue, and excitation conditions are simplified compared to real-world exposure conditions. Consequently, the reported SAR values can be seen as initial computational approximations that are to be used to aid methodological insights and not to predict clinical risks or realistic pediatric exposures in real-life settings.
This study presents a simplified computational assessment of SAR distribution in a pediatric tissue-equivalent model exposed to continuous 2.5 GHz radiofrequency radiation. The results should be interpreted as dosimetric estimates within an idealized FDTD framework and not as evidence of clinical, behavioral, or neurological outcomes. Future work should focus on anatomically realistic pediatric head models, validated dielectric parameters, phantom-based verification, and coupled thermal analysis to improve the realism and applicability of the model.
It reiterates the need for further research to develop a further understanding of the effects of radio waves on children, with regard to ASD, besides the fact that Low RF power density may also grow to high power, where it can cause much damage to human tissues as a result of electromagnetic waves, electric and magnetic fields, and strong polarised media. Although we see more SAR over time of exposure, the study fails to illustrate a causal relation with neurodevelopmental disorders such as ASD. Further interdisciplinary studies that incorporate clinical, epidemiological, and genetic factors to elucidate potential associations are recommended. Research on the SAR and its relationship with children with ASD is important to assess potential health risks and take measures to reduce these effects. We further elaborate on this study: the potential nonthermal effects of long-term exposure are crucial, and adherence to safety regulations is necessary. Thus, an in-depth comparative study of the radiation properties of different phone antennas will provide important information on the implications of radiation for brain tissue dose and overall effects on human health. Discussion of ASD should be placed in the context of vulnerability in children and does not imply the causal relation of RF exposure and neurodevelopmental disorders. Although the FDTD model is highly insightful, it treats the brain anatomy as a uniform cube, failing to capture the variability in tissue types and skull shapes in the real world. This restricts its biological realism. The age-specific, age-independent MRI-derived anatomical models and multi-layered tissue simulations incorporated into future models would be more representative of energy-absorption patterns in pediatric brains.
To confirm the biological implications of high SAR values in this case, future research involving in vivo thermal mapping, behavioural analyses in animal models exposed to RF, and epidemiological surveillance of RF exposure in relation to ASD and other neurodevelopmental disorders is necessary. This paper presents a hypothetical SAR model for homogeneously exposed tissue at a constant frequency. Nonetheless, real human heads are multi-layered, and RF dose depends on position, settings, and antenna shape. Further, the paper posits a relationship between RF exposure and ASD, although this remains speculative and has not been clinically or population-based tested. Future work should include:
This cross-reference table keeps the mathematical modeling and physical modeling of RF interactions with biological tissues consistent and easy to understand. It is in line with IEEE/ICNIRP guidelines on bioelectromagnetic safety measurements.
Table A. Symbols, physical quantities, and SI units used in Specific Absorption Rate (SAR) calculation and modeling [26]
|
Symbol |
Quantity |
Unit |
|
E |
Electric Field Strength |
V/m |
|
σ |
Conductivity |
S/m |
|
ρ |
Density |
kg/m³ |
|
SAR |
Specific Absorption Rate |
W/kg |
|
f |
Frequency |
Hz |
|
P |
Power |
W |
[1] Turgut, A., Engiz, B.K. (2023). Analyzing the SAR in human head tissues under different exposure scenarios. Applied Sciences, 13(12): 6971. https://doi.org/10.3390/app13126971
[2] Wiart, J., Hadjem, A., Wong, M.F., Bloch, I. (2008). Analysis of RF exposure in the head tissues of children and adults. Physics in Medicine and Biology, 53(13): 3681-3695. https://doi.org/10.1088/0031-9155/53/13/019
[3] Hosseini, E. (2021). Brain-to-brain communication: The possible role of brain electromagnetic fields (as a potential hypothesis). Heliyon, 7(3): e06363. https://doi.org/10.1016/j.heliyon.2021.e06363
[4] Hiatt, J.L., Gartner, L.P. (2010). Textbook of Head and Neck Anatomy. 4th ed. Lippincott Williams & Wilkins.
[5] Sonawane, A., Bormane, D. (2024). 4G based SAR analysis for anatomically based human head model using mobile phone antenna. Multidisciplinary Science Journal, 6(4): e2024053. https://doi.org/10.31893/multiscience.2024053
[6] Pilla, A.A., Markov, M.S. (1994). Bioeffects of weak electromagnetic fields. Reviews on Environmental Health, 10(3-4): 155-170. https://doi.org/10.1515/reveh.1994.10.3-4.155
[7] Pall, M.L. (2018). Wi-Fi is an important threat to human health. Environmental Research, 164: 405-416. https://doi.org/10.1016/j.envres.2018.01.035
[8] Gultekin, D.H., Siegel, P.H. (2020). Absorption of 5G radiation in brain tissue as a function of frequency, power and time. IEEE Access, 8: 115593-115612. https://doi.org/10.1109/ACCESS.2020.3002183
[9] Hieda, I., Nam, K.C. (2013). Electric-field measurement of the living human body for biomedical applications: Phase measurement of electric-field intensity. International Journal of Antennas and Propagation, 2013: 305362. https://doi.org/10.1155/2013/305362
[10] Bortkiewicz, A. (2019). Health effects of radiofrequency electromagnetic fields (RF EMF). Industrial Health, 57(4): 403-405. https://doi.org/10.2486/indhealth.57_400
[11] Akdag, M.Z., Dasdag, S., Canturk, F., Karabulut, D., Caner, Y., Adalier, N. (2016). Does prolonged radiofrequency radiation emitted from Wi-Fi devices induce DNA damage in various tissues of rats? Journal of Chemical Neuroanatomy, 75: 116-122. https://doi.org/10.1016/j.jchemneu.2016.01.003
[12] Ali, E. (2015). Effect of magnetic field from mobile phone on brain. Journal of Advances in Physics, 10(3): 2784-2794. https://doi.org/10.24297/jap.v10i3.1326
[13] Singh, R.K., Lal, R., Singh, E. (2019). Assessment of electromagnetic radiation from base station antenna. In Proceedings of the International Conference on Advances in Electronics, Electrical & Computational Intelligence. https://doi.org/10.2139/ssrn.3573601
[14] Razek, A. (2023). Potential health effects of radiofrequency electromagnetic fields exposure. Thermal Science and Engineering Progress, 6(1). https://doi.org/10.24294/tse.v6i1.1992
[15] Huang, H., Xiao, Y.H., Li, B., et al. (2022). Electric field characteristics of shared towers and electric field distribution characteristics near 5G base stations. Journal of Physics: Conference Series, 2384(1): 012030. https://doi.org/10.1088/1742-6596/2384/1/012030
[16] Król, K., Machczyński, W. (2018). Optimization of electric and magnetic field intensities in proximity of power lines using genetic and particle swarm algorithms. Archives of Electrical Engineering, 67(4): 829-843. https://doi.org/10.24425/aee.2018.124743
[17] Lak, A., Oraizi, H. (2013). Evaluation of SAR distribution in six-layer human head model. International Journal of Antennas and Propagation, 2013: 580872. https://doi.org/10.1155/2013/580872
[18] Asmae, L., Homayoon, O. (2012). Simulation and evaluation of specific absorption rate in human body in high frequency electromagnetic fields. Advanced Materials Research, 433: 5489-5493. https://doi.org/10.4028/www.scientific.net/AMR.433-440.5489
[19] Kiminami, K., Iyama, T., Onishi, T., Uebayashi, S. (2008). Novel specific absorption rate (SAR) estimation method based on 2-D scanned electric fields. IEEE Transactions on Electromagnetic Compatibility, 50(4): 828-836. https://doi.org/10.1109/TEMC.2008.2004608
[20] Panagopoulos, D.J., Johansson, O., Carlo, G.L. (2013). Correction: Evaluation of specific absorption rate as a dosimetric quantity for electromagnetic fields bioeffects. PLoS One, 8(11). https://doi.org/10.1371/journal.pone.0062663
[21] Najera, A. (2019). Comments on “Wi-Fi is an important threat to human health”. Environmental Research, 168: 514-515. https://doi.org/10.1016/j.envres.2018.07.026
[22] Salah, M.B., Abdelmelek, H., Abderraba, M. (2017). Wifi and health: Perspectives and risks. Annals of Biomedical Sciences and Engineering, 1: 12-22. https://doi.org/10.29328/journal.hbse.1001002
[23] Gough, P.T. (2002). A fast spectral estimation algorithm based on the FFT. IEEE Transactions on Signal Processing, 42(6): 1317-1322. https://doi.org/10.1109/78.286949
[24] Ardoino, L., Lopresto, V., Mancini, S., Marino, C., Pinto, R., Lovisolo, G.A. (2005). A radio-frequency system for in vivo pilot experiments aimed at the studies on biological effects of electromagnetic fields. Physics in Medicine & Biology, 50(15): 3643-3654. https://doi.org/10.1088/0031-9155/50/15/011
[25] Pilla, A.A. (2013). Nonthermal electromagnetic fields: From first messenger to therapeutic applications. Electromagnetic Biology and Medicine, 32(2): 123-136. https://doi.org/10.3109/15368378.2013.776335
[26] Carpenter, D.O. (2013). Human disease resulting from exposure to electromagnetic fields. Reviews on Environmental Health, 28(4): 159-172. https://doi.org/10.1515/reveh-2013-0016
[27] Belyaev, I.Y., Markova, E., Hillert, L., Malmgren, L.O., Persson, B.R. (2009). Microwaves from UMTS/GSM mobile phones induce long-lasting inhibition of 53BP1/γ-H2AX DNA repair foci in human lymphocytes. Bioelectromagnetics, 30(2): 129-141. https://doi.org/10.1002/bem.20445
[28] Dasdag, S., Akdag, M.Z., Erdal, M.E., et al. (2015). Effects of 2.4 GHz radiofrequency radiation emitted from Wi-Fi equipment on microRNA expression in brain tissue. International Journal of Radiation Biology, 91(7): 555-561. https://doi.org/10.3109/09553002.2015.1028599
[29] Hunter, J.K. (2014). An introduction to real analysis. Department of Mathematics, University of California, Davis. https://www.math.ucdavis.edu/~hunter/intro_analysis_pdf/intro_analysis.pdf.
[30] International Commission on Non-Ionizing Radiation Protection (ICNIRP). (2020). Guidelines for limiting exposure to electromagnetic fields (100 kHz to 300 GHz). Health Physics, 118(5): 483-524. https://doi.org/10.1097/HP.0000000000001210
[31] Sonawane, A., Bormane, D.S. (2024). Specific absorption rate analysis in an anatomically based human head model for 4G mobile phone radiation. Scientific Reports, 14.