Hermin K. Sari | Faridah* | Sunu Wibirama | Sunarno | Dwi J. Suroso
© 2026 The authors. This article is published by IIETA and is licensed under the CC BY 4.0 license (http://creativecommons.org/licenses/by/4.0/).
OPEN ACCESS
Accurate cardiovascular sensing is required before photoplethysmography (PPG)-derived features can be used in physiology-driven thermal comfort experiments. This study presents a preliminary laboratory validation of a 25 Hz board-level PPG sensor (HRM-2511E) against a clinical-grade electrocardiography (ECG) reference under one controlled indoor condition, namely 27 ℃, 60% relative humidity, and a resting low-motion seated posture. Post-acquisition aligned PPG and ECG recordings were collected from 15 healthy adults during a five-minute neutral-video protocol. Agreement and reliability were assessed using error metrics, Bland–Altman analysis, intraclass correlation coefficients (ICC), and Pearson correlation as a supporting measure of linear association. The sensor showed high reliability for heart rate (Heart Rate (HR); ICC = 0.928, r = 0.94, Root Mean Square Error (RMSE) = 3.21 bpm) and reliable performance for basic time-domain HRV metrics, including Root Mean Square of Successive Differences (RMSSD) (ICC = 0.885, r = 0.88, RMSE = 2.96 ms) and Standard Deviation of Normal-to-Normal intervals (SDNN) (ICC = 0.783, r = 0.88, RMSE = 19.68 ms). However, the 25 Hz sampling rate provides only 40 ms temporal resolution, which fundamentally limits pNN20 and reduces reliability for pNN50, successive-difference metrics, and frequency-domain heart rate variability (HRV). The LF/HF ratio showed poor reliability (ICC = 0.534), indicating that frequency-domain autonomic interpretation is not supported by this sensor configuration. These findings indicate that the evaluated PPG sensor is suitable for HR monitoring and basic time-domain HRV trend assessment in future controlled thermal comfort experiments, but not for pNN20-based or frequency-domain HRV analysis.
electrocardiography, heart rate variability, photoplethysmography, sensor validation, thermal comfort
Thermal comfort has emerged as a critical determinant of health, productivity, and overall well-being, particularly as modern indoor environments accommodate increasingly diverse patterns of work, study, and daily living [1, 2]. Contemporary research highlights that thermal comfort is closely linked to cognitive performance, physiological stability, and user satisfaction across buildings and urban microclimates [1, 3]. As indoor environmental quality becomes a central component of sustainable building design, recent studies emphasize the need for more adaptive and individualized approaches to thermal comfort research, reflecting variations in human physiology, behavior, and real-time interaction with the built environment [2, 4].
Recent studies in thermal comfort science also emphasize the importance of activity-specific evaluation, given the differences in human thermal sensation and thermoregulatory responses across sedentary, cognitive, and low-intensity physical states. Research indicates that thermal discomfort can lead to a measurable decline in cognitive performance, particularly affecting attention and task execution [3, 5]. This evidence shows the limitations of static thermal comfort models when applied to dynamic settings characterized by varied activity levels [3, 5]. To address these limitations, researchers have increasingly incorporated physiological monitoring to complement environmental measurements. Cardiovascular markers, such as heart rate (HR) and heart rate variability (HRV), have demonstrated potential for quantifying autonomic adjustments triggered by thermal exposure under sedentary and low-motion conditions [6, 7]. HRV features have also been reported to exhibit modulation as individuals transition between cooler, neutral, and warmer environments, highlighting the potential relationship between autonomic nervous system activity and thermal perception [8]. These developments have encouraged the integration of wearable physiological sensing with environmental data in future personalized thermal comfort studies [9-11]. Accurate physiological sensing is an important prerequisite for developing future physiology-driven thermal comfort experiments. Recent thermal comfort research has shown increasing interest in integrating cardiovascular markers, such as HR and HRV, with environmental measurements to better understand individual physiological responses in indoor environments [1, 2]. However, before these physiological features can be used in experimental thermal comfort protocols, the sensing modality used to acquire them must first be validated against a reliable reference method. This requirement is particularly important when low-cost or board-level sensors are used, because measurement errors in cardiovascular signals can directly affect the interpretation of physiological responses. Photoplethysmography (PPG) offers a practical and non-invasive approach for monitoring cardiovascular activity in laboratory and wearable-sensing applications. Compared with electrocardiography (ECG), PPG sensors are easier to deploy, lower in cost, and more suitable for embedded or portable experimental systems [10, 12]. Nevertheless, PPG does not directly measure cardiac electrical activity. Instead, it detects peripheral blood-volume changes, which are influenced by pulse transit time (PTT), vascular tone, sensor contact pressure, skin characteristics, ambient conditions, and motion artifacts [12]. These factors can introduce timing deviations in inter-beat interval estimation and may reduce the reliability of HRV features, especially those requiring high temporal precision. Although many studies have evaluated PPG performance in exercise, stress, and free-living conditions, validation evidence for board-level PPG sensors under thermally stable and low-motion laboratory conditions remains limited. This gap is relevant to future thermal comfort experiments, where participants are commonly seated, exposed to controlled indoor environments, and expected to minimize movement during physiological recording. Board-level PPG modules, such as the HRM-2511E, differ from consumer wearable devices in optical configuration, signal conditioning, contact interface, and sampling characteristics. Therefore, their performance cannot be assumed to be equivalent to that of commercial wearable systems without dedicated PPG-ECG validation.
The present study addresses this gap by conducting a preliminary laboratory validation of a 25 Hz board-level PPG sensor against a clinical-grade ECG reference. The validation was performed under one controlled indoor condition, namely 27 ℃, 60% relative humidity, and resting low-motion seated posture. No thermal exposure variation, thermal sensation vote, thermal comfort prediction model, emotional-state scale, and stress-score measurement were included in this experiment. Accordingly, the study does not directly assess thermal comfort and does not verify emotional relaxation. Instead, it evaluates whether HR and selected HRV features derived from the HRM-2511E PPG sensor can provide reliable cardiovascular measurements under conditions representative of a controlled laboratory setup for future thermal comfort experiments. By comparing PPG-derived and ECG-derived cardiovascular features, this study establishes baseline evidence regarding which parameters can be reliably extracted from a low-cost 25 Hz board-level PPG sensor under thermally stable and low-motion conditions. The findings are intended to support sensor selection, preprocessing design, and feature-selection decisions in future physiology-driven thermal comfort studies. The contribution of this work is therefore limited to sensor feasibility and validation, with particular attention to the sampling-resolution constraints affecting pNN20, pNN50, and frequency-domain HRV metrics.
Recent advances in thermal comfort research have increasingly emphasized the integration of physiological signals to complement conventional environmental and subjective measurements. Studies published report that cardiovascular indicators, particularly HR and HRV, exhibit measurable sensitivity to thermal exposure and thermoregulatory adjustments under sedentary and low-activity conditions [1, 2, 6, 7]. These findings have motivated the development of physiology-driven thermal comfort models that aim to improve personalization, responsiveness, and predictive accuracy beyond traditional static indices. However, such studies mainly demonstrate the potential relevance of physiological signals for thermal comfort modelling and do not eliminate the need to validate the sensing modality used to acquire these signals.
In thermal comfort studies, physiological sensing should therefore be understood as a potential input for future modelling frameworks rather than as an automatically valid predictor across all sensor types and experimental settings. The reliability of HR and HRV features depends not only on the physiological relationship between autonomic activity and thermal perception, but also on the accuracy of the sensor, the sampling rate, the signal quality, and the preprocessing method. Consequently, before PPG-derived cardiovascular features are incorporated into future thermal comfort experiments, their agreement with ECG-derived reference measurements must be examined under conditions relevant to those experiments.
In parallel with developments in thermal comfort modeling, extensive research has investigated PPG as a practical alternative to ECG for cardiovascular monitoring [10]. Recent studies consistently report that PPG offers substantial advantages in terms of cost efficiency, ease of deployment, and suitability for continuous and non-invasive sensing [13, 14]. At the same time, these studies emphasize inherent limitations associated with optical pulse sensing, including sensitivity to motion artifacts, peripheral vascular dynamics, and PTT variability, all of which can compromise inter-beat interval accuracy [10, 13, 14]. Such constraints become particularly critical in HRV analysis, where small timing errors can propagate into significant distortions of time- and frequency-domain indices, thereby limiting the reliability of advanced autonomic markers derived from PPG signals.
Within the last five years, validation studies have examined the agreement between PPG- and ECG-derived HR and HRV metrics, predominantly in contexts involving exercise, stress induction, or free-living conditions [12, 15, 16]. These studies generally report strong correlation for HR, moderate correlation for time-domain HRV metrics, and weak or inconsistent performance for parasympathetic-dominant and frequency-domain indices. Recent work has further demonstrated that low sampling rates and simplified peak detection pipelines significantly constrain the reliability of advanced HRV features derived from wearable or embedded PPG systems [17, 18].
Despite these advances, relatively few studies have explicitly validated board-level PPG sensor modules under thermally controlled and low-motion laboratory conditions representative of thermal comfort experiments. Most existing investigations focus on commercial wearable devices, which differ substantially from board-level sensors in optical configuration, signal conditioning, and susceptibility to environmental influences [13, 14]. Moreover, prior thermal comfort studies that incorporate physiological sensing often assume the validity of PPG-derived HRV features without rigorous modality-level validation against ECG references [7, 19].
The present study addresses this gap by conducting a synchronized PPG–ECG validation experiment using a reflective board-level sensor (HRM-2511E) under stable thermal and resting low-motion conditions. By systematically evaluating HR and multiple HRV indices across modalities, this work contributes empirical evidence clarifying which cardiovascular features can be reliably extracted from low-cost PPG sensors in thermal comfort research settings. In doing so, this study bridges physiological sensing for future thermal comfort research and sensor-level validation, while clearly limiting its contribution to sensor feasibility rather than direct thermal comfort prediction.
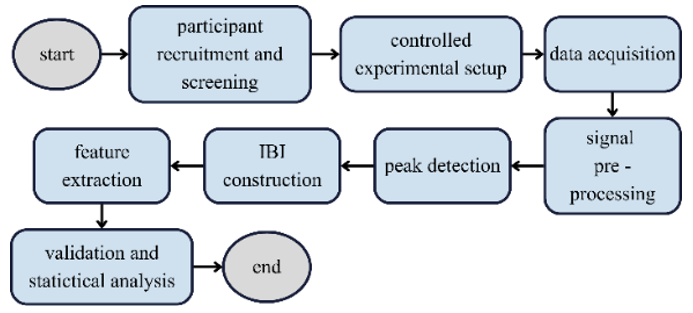
Figure 1 illustrates the overall experimental and data-analysis workflow used for synchronized PPG–ECG validation under controlled thermal and low-motion conditions.
Figure 1. Methodology
3.1 Physiological signal acquisition using HRM-2511e and Elitech 1200G
The PPG analog output was connected to a microcontroller-based acquisition unit and sampled at 25 Hz using a 12-bit analog-to-digital converter. ECG reference signals were recorded concurrently using an Elitech 1200G clinical-grade electrocardiograph configured in a three-lead arrangement. The ECG signal was sampled at 500 Hz, exported as raw waveform data for offline analysis, and used as the reference modality for R-peak timing. Device-level filtering and internal preprocessing were retained as part of the acquisition chain before the same offline preprocessing workflow was applied consistently during analysis. Let the discrete PPG and ECG signals be represented as $x_{P P G}[n]$ with $n=0,1, \ldots, N-1$ and $x_{E C G}[m]$ with $m=0,1, \ldots, M-1$ with corresponding time indices, $t_n^{P P G}=\frac{n}{f_s^{P P G}}$, and $t_m^{E C G}=\frac{m}{f_s^{E G G}}$. The 12-bit ADC resolution supported digitization of the PPG waveform for subsequent systolic-peak detection. In the validation framework, ECG R-peaks were treated as reference cardiac electrical events, whereas PPG systolic peaks were treated as peripheral pulse-arrival events.
To address potential temporal mismatches, post-acquisition temporal alignment was implemented instead of exact temporal synchronization. While both systems were initially started within a 3-second window, the bulk lag was estimated using normalized cross-correlation between the preprocessed ECG and PPG waveform envelopes over the common recording window. The optimal time lag was determined from the maximum cross-correlation coefficient and then applied as a coarse time shift. The average synchronization delay applied across all subjects was -113.87 ± 126.91 ms. After this coarse alignment, residual beat-level offsets were preserved because ECG and PPG represent different physiological events: cardiac electrical activation and peripheral pulse arrival. These residual offsets were therefore interpreted as physiological pulse-transit effects and measurement jitter rather than synchronization errors.
During the acquisition phase, participants were seated comfortably and instructed to minimize movement while viewing a neutral five-minute video. This procedure was used to maintain a resting low-motion seated posture; no emotional-state scale or stress-score measurement was collected. Ambient conditions were maintained at 27 ℃ and 60% relative humidity, as monitored using a calibrated digital hygrometer-thermometer. These conditions were selected to minimize peripheral vasoconstriction and maintain PPG signal stability, as environmental factors have been shown to significantly influence PPG waveform morphology [16]. The outputs were exported as Comma-Separated Values (CSV) files containing raw waveforms and timestamps for reproducibility.
3.2 Data collection
3.2.1 Ethics approvals
This study received an ethical exemption from the Health Research Ethics Committee of Poltekkes Kemenkes Yogyakarta (Approval No. DP.04.03/e-KEPK.1/115/2025). The research protocol was reviewed and deemed ethically appropriate in accordance with the seven WHO (2011) ethical standards, which encompass social values, scientific values, equitable assessment and benefits, risks, persuasion and exploitation, confidentiality and privacy, and informed consent, as outlined in the CIOMS 2016 Guidelines. The ethical exemption is valid from February 4, 2025, to February 4, 2026. All participants provided written informed consent prior to data collection and were informed about the study’s objectives, data handling procedures, and their right to withdraw at any time without consequence. All procedures were conducted in full compliance with WHO and CIOMS ethical principles and approved by the authorized ethics committee to ensure participant protection and data integrity throughout the research process.
3.2.2 Participants
We recruited participants via public announcements to the Universitas Gadjah Mada students. Inclusion criteria required that participants be right-handed, physically healthy adults aged 20–30 years with no self-reported cardiovascular, neurological, or metabolic disorders. Individuals with a history of smoking, use of vasoactive medication, or prior cardiovascular disease diagnosis were excluded, as such factors can alter peripheral vascular tone and confound PPG signal physiology [15]. A total of 15 participants (8 females) with a mean age of 24.1 ± 2.3 years participated in the study after providing written informed consent. The sample therefore represents a limited and relatively homogeneous group of healthy young adults. Skin tone, finger geometry, contact pressure, and sex-related physiological differences were not stratified in the analysis and are treated as limitations of this preliminary laboratory validation. The sample size (n = 15) is consistent with prior PPG–ECG validation studies conducted under controlled laboratory conditions, where participant numbers between 10 and 20 are commonly adopted to establish baseline agreement and sensor accuracy. Such sample sizes have been shown to be sufficient for detecting moderate-to-strong correlations in criterion-validity analyses when motion and environmental confounders are minimized.
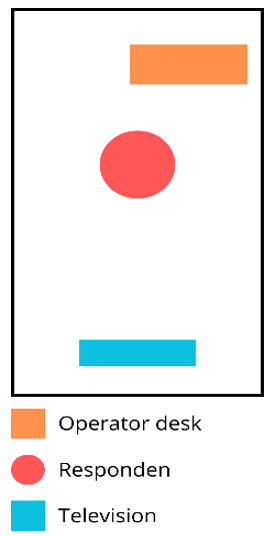
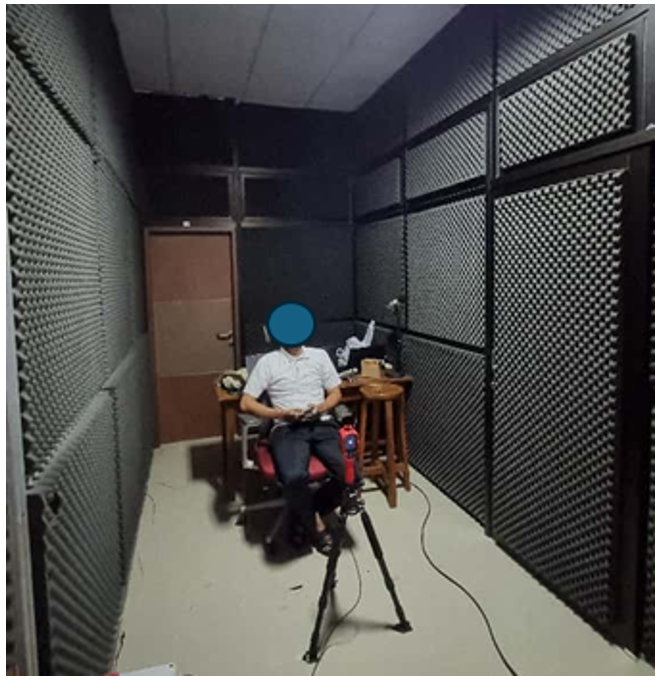
Figure 2. Experiment setup: (a) the layout of the chamber and (b) sensor setup
3.2.3 Collection setup
All recordings were performed in a climate-controlled chamber (2 m × 4 m) maintained at 27 ℃ and 60% relative humidity, as environmental stability has been shown to improve peripheral blood flow and reduce PPG signal variability [18]. This single controlled indoor condition was used only for laboratory sensor validation and was not designed as a multi-condition thermal exposure protocol. The spatial arrangement of the chamber and sensor setup is presented in Figure 2. Participants were seated in an ergonomic chair, positioned 1.5 m from a display screen, and instructed to remain still while watching a five-minute neutral video stimulus. The stimulus was used to support a resting low-motion posture rather than to verify a specific emotional state. PPG was recorded using an HRM-2511E reflective optical sensor module (940 nm infrared LED, integrated photodiode) secured to the participant’s left index finger to ensure consistent contact pressure. Contact pressure was controlled procedurally by using the same placement protocol, although it was not quantitatively measured. The analog output was connected to a microcontroller-based acquisition unit, sampling at 25 Hz with onboard analog filtering. ECG signals were recorded concurrently using a clinical-grade Elitech 1200G three-lead system, sampled at 500 Hz, with leads placed in standard limb configuration for accurate R-wave detection [20]. Before each session, sensors were visually inspected, cables were arranged to avoid strain artifacts, and signal quality was confirmed in real-time. Participants underwent a 5-minute adaptation period before recording to acclimatize to the environment and prevent novelty-induced autonomic fluctuations [12]. Data from both devices were saved in raw waveform form along with synchronized timestamps, enabling subsequent alignment and cross-modal HR/HRV analysis.
3.3 Signal processing
3.3.1 Signal pre–processing
Raw PPG and ECG waveforms were visually inspected to identify segments affected by motion artifacts, saturation, or baseline drift. Signal-quality screening flagged abrupt spikes, clipped amplitudes, non-physiological baseline shifts, and visually apparent motion artifacts before feature extraction. No participant-level recording was discarded; all 15 five-minute paired recordings were retained after quality control for subsequent analysis. To remove slow-varying non-physiological trends, each signal was detrended using third-order polynomial as shown in Eq. (1).
$p(t)=a_0+a_1 t+a_2 t^2+a_3 t^3$ (1)
with the detrended signal $x_d(t)=x(t)-p(t)$.
Specifically, a 4th-order band-pass Butterworth filter was then applied to isolate cardiac-related frequency components. Filtering was performed at the native acquisition rates of each modality, namely 25 Hz for PPG and 500 Hz for ECG. For PPG signals, the passband was set to 0.5–4 Hz, whereas ECG signals were filtered within 0.5–40 Hz [12]. The filtering operation can be expressed as Eq. (2).
$y[n]=\sum_{k=0}^K b_k x_d[n-k]-\sum_{k=1}^K a_k y[n-k]$ (2)
where, the numerator and denominator terms denote the Butterworth filter coefficients, and the filter order was set to four. Zero-phase forward–reverse filtering was applied to prevent phase distortion.
3.3.2 Peak detection
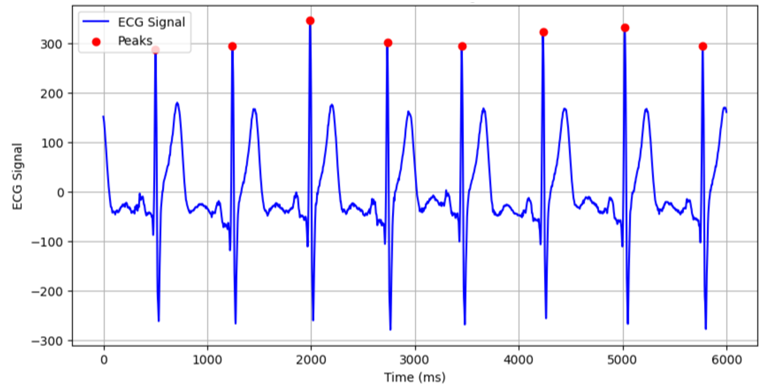
ECG R-Peak Detection. Figure 3 shows ECG R-peak detection. ECG R-peaks were detected using a modified Pan–Tompkin’s algorithm involving differentiation, squaring, adaptive thresholding, and search-back logic. The detection procedure was applied to the 500 Hz ECG reference signal. Detected R-peak times were refined within a ±50 ms local window to correct temporal offsets. Intervals outside the physiological range (300–1500 ms) were manually inspected. Intervals remaining physiologically implausible after inspection were excluded from the beat-level feature calculation.
Figure 3. Electrocardiography (ECG) R-peak detection
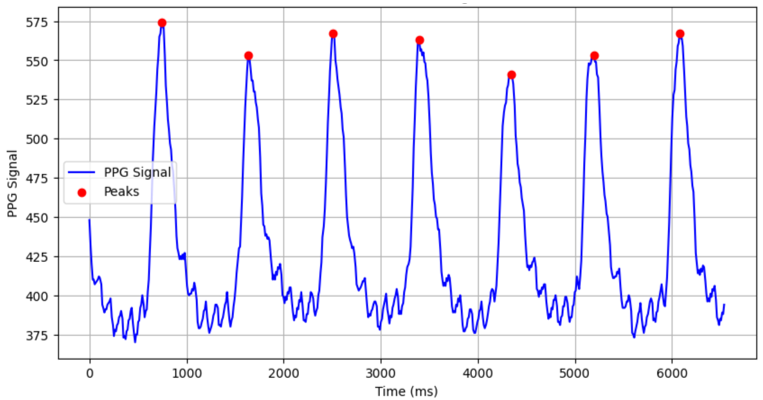
PPG R-Peak Detection. Figure 4 shows PPG systolic-peak detection. PPG systolic peaks were detected using an adaptive derivative-based algorithm. Because the PPG signal was sampled at 25 Hz, peak timing was limited to a 40 ms temporal resolution. Let the detected systolic peak times be denoted as peak events. Spurious detections were removed using an IBI consistency filter defined as $RejectI B I_i \,if \mid I B I_i- median\left(I B I_{i-w i+w}\right) \mid>0.2 \cdot median \left(I B I_{i-w i+w}\right)$, where the moving window length was used to evaluate local IBI consistency. PPG detections with implausible IBIs outside 300–1500 ms or inconsistent local beat intervals were visually rechecked before feature extraction. PTT correction was not applied, as intrinsic timing differences between modalities were explicitly evaluated.
Figure 4. Photoplethysmography (PPG) systolic peak detection
3.3.3 Feature extraction
Following peak detection, inter-beat intervals (IBIs) were derived from both ECG R-peaks and PPG systolic peaks were computed as shown in Eq. (3). ECG-derived IBIs were used as the reference intervals, whereas PPG-derived IBIs represented peripheral pulse intervals.
$\begin{aligned} I B I_i^{E C G} & =t_{i+1}^R-t_i^R \\ I B I_i^{P P G} & =t_{i+1}^S-t_i^S\end{aligned}$ (3)
These IBIs were subsequently cleaned using artifact-rejection and interpolation procedures to obtain time series appropriate for HRV analysis. Time-domain HRV metrics were computed from cleaned normal-to-normal interval series, whereas frequency-domain metrics were computed after interpolation of the unevenly spaced IBI series. Recent studies emphasize the importance of preprocessing accuracy when estimating HRV from wearable sensors due to sensitivity to noise, sampling rate limitations, and beat-detection errors [17, 21]. HR was computed as the reciprocal of the mean IBI, expressed in beats per minute as follows in Eq. (4).
$H R=\frac{60}{I B I}$ (4)
Standard time-domain HRV features were extracted, including the standard deviation of normal-to-normal intervals (SDNN) and the root mean square of successive differences (RMSSD), both of which have been validated as robust indices of autonomic modulation in low-motion experimental protocols [22]. Specifically, the SDNN metric was computed to quantify the overall variability as shown in Eq. (5).
$S D N N=\sqrt{\frac{1}{N-1} \sum_{i=1}^N\left(I B I_i-\overline{I B I}\right)^2}$ (5)
Meanwhile, the RMSSD metric was calculated to estimate the short-term variance in heart rate using Eq. (6).
$R M S S D=\sqrt{\frac{1}{N-1} \sum_{i=1}^{N-1}\left(I B I_{i+1}-I B I_i\right)^2}$ (6)
Additional indices, pNN20 and pNN50, representing the proportion of successive IBI differences ($\Delta$) exceeding 20 ms and 50 ms, respectively, were computed to characterize rapid parasympathetic-driven fluctuations, which have been shown to be strongly relevant in short-duration laboratory recordings [18] which defined in Eq. (7). However, because the 25 Hz PPG signal has a 40 ms temporal resolution, pNN20 is fundamentally constrained by sampling resolution and cannot be interpreted as a reliable PPG-derived metric in this sensor configuration. The same timing limitation may also affect pNN50 and RMSSD, although these metrics are less directly constrained than pNN20.
$p N N_{\Delta}=\frac{1}{N-1} \sum_{i=1}^{N-1} \|\left(\left|I B I_{i+1}-I B I_i\right|>\Delta\right) \times 100 \%$ (7)
Eq. (8) shows frequency-domain HRV estimation that was performed using Welch’s power spectral density (PSD) approach, which remains the recommended method for short-term HRV assessment in wearable-device validation studies due to its robustness to non-stationarity and noise [14]. Before PSD estimation, the cleaned IBI series was interpolated and resampled at 4 Hz to obtain an evenly sampled tachogram for spectral analysis.
$\hat{P}(f)=\frac{1}{L} \sum_{l=1}^L\left|\sum_{k=0}^{M-1} w[k] s_l[k] e^{-j 2 \pi f k}\right|^2$ (8)
where, $w[k]$ is a Hann window with a segment length of 256 data points and a 50% overlap. Spectral power was reported in raw ms² values. Spectral power was integrated over the standard frequency bands shown in Eq. (9), with the low-frequency band defined as 0.04 to 0.15 Hz and the high-frequency band defined as 0.15 to 0.40 Hz.
$\begin{aligned} & L F=\int_{0.04}^{0.15} \hat{P}(f) d f \\ & H F=\int_{0.15}^{0.4} \hat{P}(f) d f\end{aligned}$ (9)
and the autonomic balance index was computed as Eq. (10).
$L F / H F=\frac{L F}{H F}$ (10)
Only clean and stationary IBI segments were included in spectral computations, following best-practice guidelines for short-duration HRV recordings in controlled environments [19]. Because spectral estimates amplify beat-timing errors, frequency-domain HRV results from the 25 Hz PPG configuration were interpreted cautiously and were not treated as primary evidence of autonomic agreement.
3.3.4 Feature correlation and statistical analysis
To evaluate linear association between ECG-derived and PPG-derived cardiovascular features, Pearson correlation coefficients were computed for each HR and HRV metric as shown in Eq. (11). Correlation was not interpreted as measurement agreement.
$r=\frac{\sum\left(F_i^{P P G}-\bar{F}^{P P G}\right)\left(F_i^{E C G}-\bar{F}^{E C G}\right)}{\sqrt{\sum\left(F_i^{P P G}-\bar{F}^{P P G}\right)^2 \sum\left(F_i^{E C G}-\bar{F}^{E C G}\right)^2}}$ (11)
Linear correlation analysis remains a widely adopted method for validating HRV features obtained from emerging or low-cost sensing technologies against clinical-grade references [19]. In this study, Pearson correlation and R² were used only as supporting measures of linear association. Agreement and reliability were evaluated primarily using error metrics, Bland–Altman analysis, and intraclass correlation coefficients (ICC). This statistical structure enabled the characterization of both feature association and measurement discrepancy between modalities under stable thermal and minimal-motion conditions.
3.3.5 Error analysis
Error-based statistical analyses were performed to complement correlation findings and quantify absolute discrepancies between modalities. Mean absolute difference (MAD), root mean square error (RMSE), and mean squared error (MSE) were calculated to assess the magnitude and variability of estimation error across features. The units of each error metric followed the corresponding feature units: bpm for HR, ms for SDNN and RMSSD, percentage points for pNN20 and pNN50, ms² for LF and HF power, and dimensionless values for LF/HF. Error-based metrics were computed using Eqs. (12)-(14).
$M A D=\frac{1}{N} \sum\left|\left(F_i^{P P G}-F_i^{E C G}\right)\right|$ (12)
$R M S E=\sqrt{\frac{1}{N} \sum\left(F_i^{P P G}-F_i^{E C G}\right)^2}$ (13)
$M S E=\frac{1}{N} \sum\left(F_i^{P P G}-F_i^{E C G}\right)^2$ (14)
These metrics are commonly employed in validation studies comparing wearable or optical sensors against ECG because they capture both systematic bias and random fluctuations inherent to pulse-derived intervals [22]. The coefficient of determination (R²) was additionally used to quantify the proportion of variance in ECG-derived features explained by PPG-derived estimates. Bland–Altman analysis was used to estimate mean bias and 95% limits of agreement, whereas ICC was used to summarize measurement reliability between the two modalities. Collectively, these statistical measures provided a comprehensive evaluation of the accuracy, reliability, and limitations of the HRM-2511E PPG sensor for HR and HRV estimation under thermally stable, low-artifact conditions.
4.1 Feature correlation
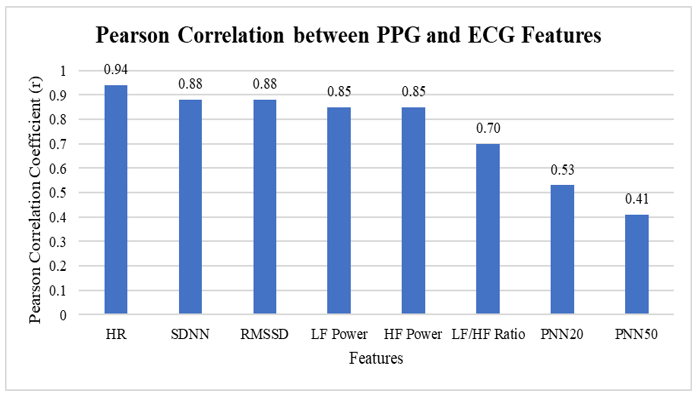
Figure 5 illustrates the Pearson correlation coefficients (r) between PPG-derived and ECG-derived cardiovascular features. HR demonstrated the strongest correlation (r = 0.94), indicating high agreement between the two modalities under relaxed and thermally stable conditions. Time-domain HRV metrics showed strong correlations, with SDNN (r = 0.88) and RMSSD (r = 0.88) maintaining robust linear relationships. Frequency-domain metrics, LF power (r = 0.85) and HF power (r = 0.85), also exhibited strong correlations, suggesting that the PPG sensor captured general autonomic spectral trends despite expected timing variability in inter-beat intervals. In contrast, beat-difference indices pNN20 (r = 0.53) and pNN50 (r = 0.41) showed weaker correlations, indicating challenges in capturing high-frequency parasympathetic fluctuations with reflective PPG. The LF/HF ratio yielded a moderate correlation (r = 0.70), consistent with error propagation when two spectral components are combined into a ratio metric.
These correlation results indicate the ability of the PPG signal to track general variations in ECG-derived features under thermally stable and low-motion conditions. However, correlation is interpreted only as evidence of linear association and not as direct evidence of measurement agreement. Therefore, the validation interpretation is supported by error metrics, Bland-Altman analysis, and ICC reliability estimates.
Figure 5. Pearson correlation between photoplethysmography (PPG) and electrocardiography (ECG) features
4.2 Error analysis
Table 1 summarizes the absolute estimation errors for each physiological feature. The feature units are indicated in the table: HR is reported in bpm, SDNN and RMSSD in ms, pNN20 and pNN50 in %, LF and HF power in ms2, and LF/HF as a dimensionless ratio. HR exhibited the lowest error across all metrics (RMSE = 3.21 bpm, MAD = 2.05 bpm), confirming that HR is the most robust parameter derived from PPG under the tested condition. Time-domain HRV features showed higher error magnitudes, with SDNN and RMSSD producing RMSE values of 19.68 ms and 2.96 ms, respectively.
Table 1. Error metrics analysis
|
Features (unit) |
Error Metrics |
|||
|
R2 |
MAD |
RMSE |
MSE |
|
|
HR (bpm) |
0.8826 |
2.0530 |
3.2135 |
10.3270 |
|
SDNN (ms) |
0.7686 |
14.0823 |
19.6760 |
387.1463 |
|
RMSSD (ms) |
0.7739 |
2.1890 |
2.9556 |
8.7356 |
|
pNN50 (%) |
0.1673 |
8.1038 |
10.3083 |
106.2613 |
|
pNN20 (%) |
0.2809 |
7.2064 |
9.7048 |
94.1849 |
|
LF (ms2) |
0.7268 |
499.5128 |
809.2833 |
654999.5000 |
|
HF (ms2) |
0.7298 |
877.4393 |
1622.7242 |
2633324.6000 |
|
LF/HF |
0.4893 |
1.5272 |
3.5891 |
12.8821 |
The weak pNN20 result reflects a fundamental sampling-resolution limitation because the 25 Hz PPG signal provides a 40 ms temporal resolution and therefore cannot reliably resolve a 20 ms successive-difference threshold. pNN50 and RMSSD are also affected by beat-timing uncertainty, although they are less directly constrained than pNN20. The LF and HF power errors were interpreted cautiously because raw spectral-power values in ms2 can be numerically large and sensitive to timing jitter, interpolation, and distributional skewness.
4.3 Statistical agreement and reliability analysis
While correlation and aggregate error metrics provide useful supporting information, they do not by themselves establish agreement between PPG and ECG measurements. Therefore, agreement-focused analysis was conducted using Bland-Altman plots and ICC with 95% confidence intervals. To clarify the data structure, all cardiovascular features were computed over a single continuous five-minute segment per participant, yielding 15 paired observations for each feature. The ICC was reported using a two-way random-effects, absolute-agreement, single-measure model, denoted as ICC(2,1). Table 2 summarizes the agreement and reliability results.
Table 2. The statistical agreement and reliability analyses
|
Features |
Bland-Altman |
ICC (95% CI) |
||
|
Bias |
Lower LoA |
Upper LoA |
||
|
HR |
0.00 bpm |
-6.30 |
6.30 |
0.928 |
|
SDNN |
0.00 ms |
-38.57 |
38.57 |
0.783 |
|
RMSSD |
0.00 ms |
-5.79 |
5.79 |
0.885 |
|
LF/HF |
0.00 |
-7.03 |
7.03 |
0.534 |
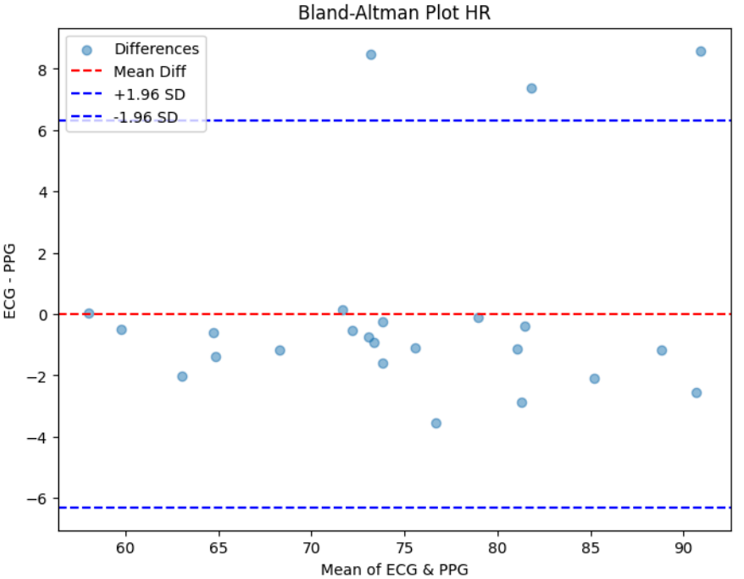
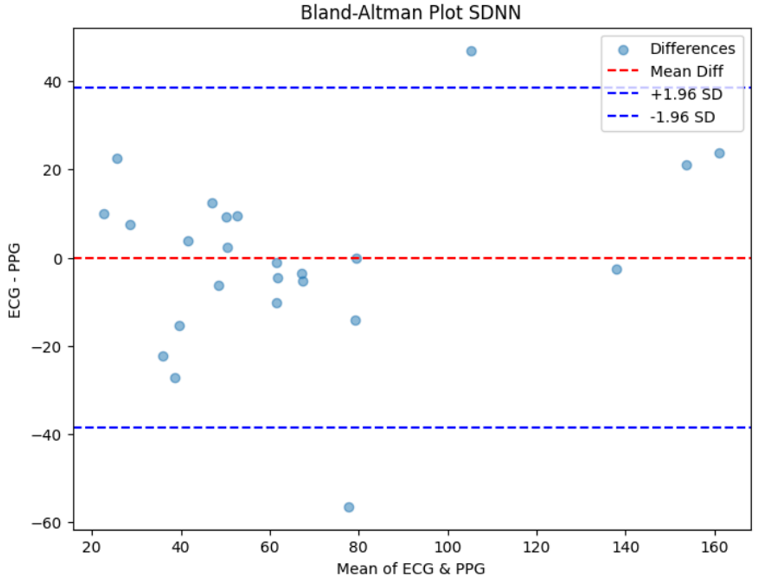
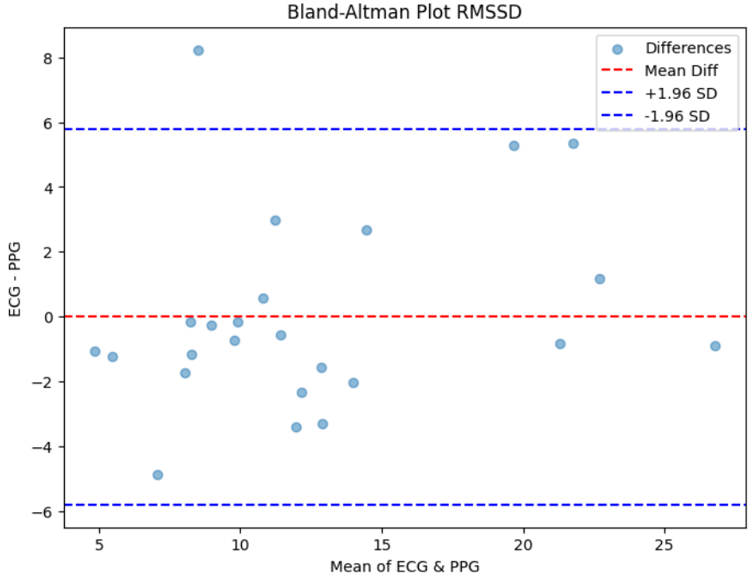
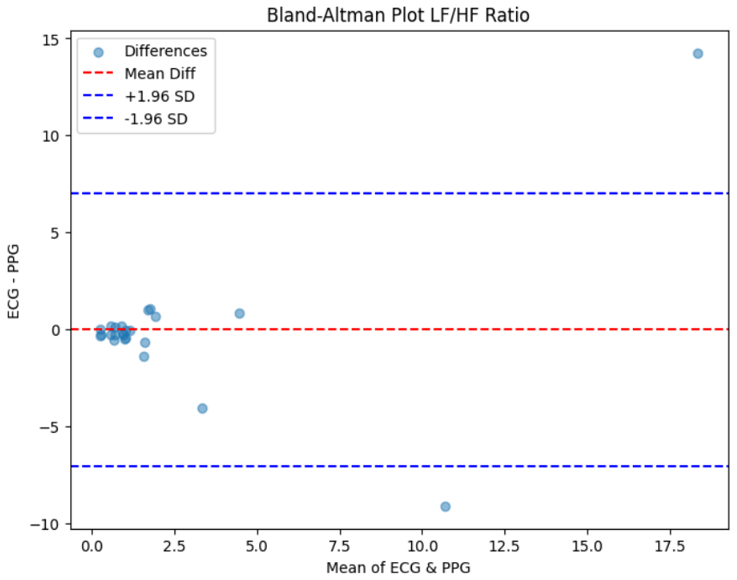
The Bland-Altman analysis was performed to quantify the mean difference and the 95% limits of agreement (LoA) between the PPG and ECG modalities. As illustrated in Figure 6, the Bland-Altman plots for HR, SDNN, RMSSD, and LF/HF demonstrate the spread of subject-level differences. HR showed a near-zero mean bias with LoA from -6.30 to 6.30 bpm. SDNN showed near-zero mean bias with wider LoA from -38.57 to 38.57 ms, whereas RMSSD showed near-zero mean bias with LoA from -5.79 to 5.79 ms. For the LF/HF ratio, the LoA ranged from -7.03 to 7.03, indicating that ratio-based frequency-domain interpretation remains unstable for this 25 Hz PPG configuration. The wide LoA values, particularly for SDNN and LF/HF, indicate that small average bias should not be interpreted as equivalent agreement across all subjects.
Figure 6. Bland-Altman plots demonstrating the agreement between the electrocardiography (ECG) reference and the photoplethysmography (PPG) sensor under thermally stable and relaxed conditions
Furthermore, the ICC analysis indicated excellent reliability for HR and good reliability for RMSSD, while SDNN showed moderate reliability and LF/HF showed low reliability. These results confirm that the 25 Hz HRM-2511E sensor is more reliable for HR and basic time-domain HRV monitoring than for beat-difference and frequency-domain indices. In particular, the poor performance of pNN20 is attributable to the 40 ms sampling interval, and the reduced reliability of pNN50, RMSSD, LF/HF, LF power, and HF power reflect the propagation of beat-timing uncertainty into HRV calculations.
The present study demonstrates differentiated sensor performance across HR, time-domain HRV, beat-difference indices, and frequency-domain HRV features derived from the HRM-2511E reflective PPG sensor under thermally stable and resting low-motion conditions. The main contribution of this work is sensor feasibility evidence for future thermal comfort experiments, not direct thermal comfort assessment or thermal comfort prediction. The strong performance observed for HR indicates that reflective PPG can reliably capture cardiac chronotropic responses when motion artifacts and environmental disturbances are minimized [20, 23]. Within future physiology-driven thermal comfort experiments, this supports the use of PPG-based HR monitoring as a practical candidate measurement under controlled laboratory conditions.
In contrast, time-domain HRV metrics, particularly SDNN and RMSSD, showed lower agreement than HR. This indicates that the HRM-2511E can capture general autonomic variability trends but does not provide ECG-level temporal precision. Similar performance patterns have been reported in recent wearable and PPG-based HRV studies, which attribute such discrepancies to PTT variability, waveform morphology distortion, sampling-rate limitations, and peripheral optical-sensing constraints [22, 23]. Therefore, PPG-derived SDNN and RMSSD should be treated as feasible candidate features for future thermal comfort studies rather than proven predictors of thermal comfort in the present experiment.
The weakest performance was observed for pNN20 and pNN50 because these indices rely on short-latency beat-to-beat differences and are highly sensitive to peak-timing uncertainty. The pNN20 result is fundamentally constrained by the 25 Hz sampling rate, which corresponds to a 40 ms temporal resolution and makes reliable evaluation of a 20 ms successive-difference threshold infeasible. Frequency-domain HRV metrics also showed limited reliability, particularly the LF/HF ratio, because spectral-power estimation amplifies small beat-timing deviations introduced by sampling, interpolation, PTT variability, and peak-detection uncertainty. Consequently, autonomic interpretation based on pNN20, pNN50, LF power, HF power, and LF/HF should be avoided for this 25 Hz PPG configuration.
From a broader perspective, this study provides baseline sensor-validation evidence for a board-level PPG sensor in a controlled laboratory context relevant to future thermal comfort experiments. This contribution is limited to identifying which cardiovascular features are feasible to extract from a low-cost 25 Hz PPG sensor under thermally stable and low-motion conditions. The findings do not demonstrate that HR, SDNN, or RMSSD improve thermal comfort modelling, because no thermal exposure variation, thermal sensation vote, skin-temperature measurement, metabolic response, or thermal comfort prediction model was included in the experiment.
Table 3. The comparative analysis of recent studies
|
Ref. |
Sensor/Device Type |
Stimulus |
Sampling Rate |
R2 |
||
|
HR/RR |
HRV Time Domain |
HRV Frequency Domain |
||||
|
[13] |
Wearable PPG (MAX30102) |
Mental Stress |
100 Hz |
0.983 |
0.89 |
0.78 |
|
[16] |
Garmin Fenix 6 Smartwatch |
Free-living |
N/A (High-res IBI) |
N/A (Anomaly Detection) |
N/A (Risk Score Only) |
N/A (Risk Score Only) |
|
[22] |
Simulated Commercial Wearables |
Free-living |
5-second interval |
N/A |
0.82 - 0.84 |
0.52 |
|
Board-level PPG (HRM-2511E) |
Controlled indoor resting low-motion condition |
25 Hz |
0.8826 |
0.7686 - 0.7739 |
0.4893 |
|
Comparison with state-of-the-art methods
To contextualize the present findings, Table 3 summarizes selected recent studies related to PPG-based cardiovascular monitoring. This comparison is presented as background context rather than a direct performance benchmark, because the listed studies differ in device type, sampling structure, experimental stimulus, participant context, and validation target. Therefore, the table is used to position the present work within the broader PPG-validation literature rather than to claim direct superiority over previous methods.
The comparative metrics in Table 3 are grouped into three broad dimensions of cardiovascular sensing validation: HR/RR accuracy, time-domain HRV, and frequency-domain HRV. HR/RR accuracy reflects the ability of the sensor to capture basic cardiac timing, whereas time-domain HRV metrics such as SDNN and RMSSD describe overall and short-term variability in inter-beat intervals. Frequency-domain HRV, represented by LF/HF, remains the most challenging dimension for low-resolution PPG sensors because it depends on spectral-power estimation and is highly sensitive to sampling-induced jitter and interpolation artifacts.
The HR estimation result in the present study (R2 = 0.8826) is comparable with values reported in controlled and wearable PPG studies, particularly when the measurement condition is thermally stable and low motion. However, this comparison should be interpreted cautiously because some previous studies used higher sampling rates, commercial wearable algorithms, different physiological stimuli, and different validation endpoints [13, 16, 22]. Thus, the present result indicates feasibility under a controlled laboratory condition rather than general superiority over other PPG systems.
Regarding HRV metrics, the present findings are consistent with previous reports showing that basic time-domain HRV features are more stable than beat-difference and frequency-domain indices when derived from PPG signals [16, 22]. The lower reliability observed for LF/HF (R2 = 0.4893; ICC = 0.534) supports the conclusion that frequency-domain autonomic interpretation is not sufficiently robust for the 25 Hz HRM-2511E configurations. By explicitly reporting this limitation, the present study provides a practical boundary for using board-level PPG sensors in future controlled thermal comfort experiments.
Several limitations should be acknowledged. First, the relatively small and homogeneous sample limits population-level generalizability, particularly because the participants were healthy adults aged 20-30 years and sex-related physiological differences were not examined. Second, the study was conducted under a single controlled indoor condition and resting low-motion posture; it did not include thermal exposure variation, thermal sensation votes, skin-temperature measurements, metabolic-response measurements, emotional-state validation, or stress-score assessment. Third, the low sampling rate of the PPG sensor constrains the estimation of high-resolution HRV metrics, particularly pNN20, pNN50, and frequency-domain indices. Fourth, reflective PPG measurements may be affected by skin tone, finger geometry, local vascular characteristics, and contact-pressure variability, none of which were explicitly controlled in this preliminary validation. Future research should therefore investigate multi-condition thermal exposures, higher-sampling-rate PPG systems, more diverse participants, and sensor-fusion approaches combining PPG with complementary physiological signals [23, 24].
This study conducted a controlled validation of HR and HRV features derived from the HRM-2511E PPG sensor against a clinical-grade ECG reference under thermally stable, low-motion conditions within one controlled laboratory setting. The results indicate that the HRM-2511E provides reliable HR estimation and supports basic time-domain HRV trend assessment, particularly for SDNN and RMSSD, within the tested condition. However, the sensor should not be interpreted as a direct substitute for ECG for detailed HRV analysis. Beat-difference indices, particularly pNN20 and pNN50, showed limited reliability because they are sensitive to sampling resolution and peripheral pulse timing variability.
Despite these contributions, several limitations must be acknowledged. The experimental protocol was conducted in a controlled thermal environment with minimal participant movement, and it did not include thermal exposure variation, thermal sensation votes, skin-temperature measurements, metabolic-response measurements, emotional-state validation, or stress-score assessment. These conditions minimize signal artifacts but do not represent broader real-world settings where peripheral perfusion, thermal variability, and motion can significantly degrade PPG quality. The relatively small and homogeneous participant sample, together with unexamined individual factors such as skin tone, finger geometry, vascular characteristics, and contact-pressure variability, further limits generalizability. Moreover, PTT differences between cardiac electrical activation and peripheral pulse arrival were not corrected; while this aligns with the goal of assessing intrinsic modality differences, it introduces systematic offsets that can affect HRV estimation.
Overall, the findings indicate that the HRM-2511E is a viable sensing modality strictly for HR monitoring and basic time-domain HRV trend assessment, such as SDNN and RMSSD, under controlled resting low-motion laboratory conditions for future thermal comfort experiments. Claims related to direct thermal comfort modelling were removed from the conclusion. We explicitly advise against using this 25 Hz sensor configuration for frequency-domain autonomic interpretation, including LF/HF and absolute spectral-power analysis, because the 40 ms temporal resolution and interpolation requirements make such metrics unstable. Future work should validate PPG performance across dynamic thermal conditions, incorporate advanced artifact suppression and PTT compensation techniques, and evaluate higher-sampling-rate optical modules to improve HRV estimation accuracy. Expanding participant diversity and incorporating more ecologically valid study designs will further clarify the robustness of PPG-derived physiological indicators for future physiology-driven thermal comfort research.
The authors gratefully acknowledge the financial support provided by the Program Riset Konsorsium Unggulan Berdampak (RIKUB) 2026, Directorate of Research and Community Service, Ministry of Higher Education, Science, and Technology, Republic of Indonesia. This study was funded under Contract Numbers 013/C3/DT.05.00/RIKUB/2026 and 1270/UN1/DITLIT/Dit-Lit/PT.01.03/2026. The authors also extend their appreciation to all participants and laboratory personnel who contributed to the successful execution of this research.
|
$a_0, a_1, a_2, a_3$ |
polynomial coefficients for the signal detrending process, dimensionless |
|
$a_k$ |
denominator filter coefficients, dimensionless |
|
$b_k$ |
numerator filter coefficients, dimensionless |
|
f |
frequency, Hz |
|
$f_s$ |
sampling frequency, Hz |
|
$F_i$ |
cardiovascular feature value at the i-th index |
|
$\bar{F}$ |
mean value of the cardiovascular feature |
|
HF |
High-Frequency spectral power, m.s2 |
|
HR |
Heart Rate, bpm |
|
IBI |
Inter-Beat Interval, m.s |
|
K |
filter order, dimensionless |
|
L |
number of segments in the Welch power spectral density method, dimensionless |
|
LF |
Low-Frequency spectral power, m.s2
|
|
m |
discrete time index for the ECG signal, dimensionless |
|
M |
total number of samples in the ECG signal, dimensionless |
|
n |
discrete time index for the PPG signal, dimensionless |
|
N |
total number of samples or data points, dimensionless |
|
$p(t)$ |
third-order polynomial trend function |
|
$\hat{P}(f)$ |
estimated power spectral density |
|
$p N N_{\Delta}$ |
proportion of successive IBI differences exceeding the δ threshold, % |
|
r |
pearson correlation coefficient, dimensionless |
|
$R^2$ |
coefficient of determination, dimensionless |
|
$S_l[k]$ |
signal segment for frequency-domain analysis |
|
t |
time variable, m.s |
|
w |
moving window length for the IBI consistency filter, dimensionless |
|
$w[k]$ |
Hann window function, dimensionless |
|
$x(t)$ |
raw signal before pre-processing |
|
$x_d(t)$ |
detrended signal |
|
X |
discrete physiological signal |
|
$y[n]$ |
filtered output signal |
|
Greek symbols |
|
|
Δ |
Threshold for successive IBI differences (e.g., 20 ms or 50 ms) |
|
Subscripts |
|
|
d |
detrended component |
|
ECG |
derived from the electrocardiography signal |
|
i |
index of the current peak or interval |
|
PPG |
derived from the photoplethysmography signal |
|
R |
R-peak detected from the ECG signal |
|
S |
systolic peak detected from the PPG signal |
[1] Wang, C., Zhang, F., Wang, J., et al. (2021). How indoor environmental quality affects occupants’ cognitive functions: A systematic review. Building and Environment, 193: 107647. https://doi.org/10.1016/j.buildenv.2021.107647
[2] Hong, D., Cheng, R., Lei, H., et al. (2026). Comprehensive review on the impact of building envelopes on indoor thermal comfort in office buildings: Balancing occupant comfort and energy efficiency. Building and Environment, 289: 114018. https://doi.org/10.1016/j.buildenv.2025.114018
[3] Lan, K., Li, S., Wu, Y., Chang, G., Peng, F. (2025). Experimental study on the impact of indoor lighting and thermal environment on university students’ learning performance in summer. Energy and Buildings, 339: 115774. https://doi.org/10.1016/j.enbuild.2025.115774
[4] Avci, A.B. (2025). Federated machine learning for indoor thermal comfort: Real-time zone-based personalization and HVAC control. Journal of Building Engineering, 114: 114476. https://doi.org/10.1016/j.jobe.2025.114476
[5] Jiang, J., Liu, F., Jiang, Z., Zhang, J., Ma, C. (2025). Experimental evaluation of short-term thermal experiences on students’ thermal comfort and cognitive performance. Building and Environment, 285: 113613. https://doi.org/10.1016/j.buildenv.2025.113613
[6] Sahoh, B., Wongsontham, F., Tipsavak, A., et al. (2026). Deep learning-based comparative evaluation of EEG, HRV, and EDA biomarkers for personal thermal comfort prediction. Biomedical Signal Processing and Control, 113: 108972. https://doi.org/10.1016/j.bspc.2025.108972
[7] Zhang, W., Calautit, J.K., Wu, Y. (2024). Novel dynamic thermal comfort prediction in buildings with single-shot vision-based deep learning method and low-cost thermographic imaging. Building and Environment, 285: 113549. https://doi.org/10.1016/j.buildenv.2025.113549
[8] Gopi, G., Ju, D.Y., Kim, J.K. (2025). Physiological-signal-based prediction of occupant thermal comfort in a nonuniform transient vehicular cabin during winter. Building and Environment, 271: 112561. https://doi.org/10.1016/j.buildenv.2025.112561
[9] Cen, C., Cheng, S., Wong, N.H. (2022). Physiological sensing of personal thermal comfort with wearable devices in fan-assisted cooling environments in the tropics. Building and Environment, 225: 109622. https://doi.org/10.1016/j.buildenv.2022.109622
[10] Zou, R., Chen, H., Pan, H., et al. (2024). Self-powered and self-sensing wearable devices from a comfort perspective. Device, 2(11): 100466. https://doi.org/10.1016/j.device.2024.100466
[11] Lin, C.Y., Zhang, Y. (2026). Frame-by-frame processing-based robot system integrating multimodal body language feature recognition and fusion for thermal comfort monitoring. Building and Environment, 287: 113814. https://doi.org/10.1016/j.buildenv.2025.113814
[12] Allen, J., Kyriacou, P.A. (2024). Editorial: Advances in basic and applied research in photoplethysmography. Frontiers in Physiology, 15: 1415049. https://doi.org/10.3389/fphys.2024.1415049
[13] Tsai, Y.Y., Chen, Y.J., Lin, Y.F., Hsiao, F.C., Hsu, C.H., Liao, L.D. (2025). Photoplethysmography-based HRV analysis and machine learning for real-time stress quantification in mental health applications. APL Bioengineering, 9(2): 026103. https://doi.org/10.1063/5.0256590
[14] Banani Ardecani, F., Shoghli, O. (2025). Assessing workers’ neuro-physiological stress responses to augmented reality safety warnings in immersive virtual roadway work zones. Automation in Construction, 180: 106565. https://doi.org/10.1016/j.autcon.2025.106565
[15] Kim, C., Song, J.H., Kim, S.H. (2023). Validation of wearable digital devices for heart rate measurement during exercise test in patients with coronary artery disease. Annals of Rehabilitation Medicine, 47(4): 261-271. https://doi.org/10.5535/arm.23019
[16] Gaur, P., Temple, D.S., Hegarty-Craver, M., et al. (2024). Continuous monitoring of heart rate variability in free-living conditions using wearable sensors: Exploratory observational study. JMIR Formative Research, 8: e53977. https://doi.org/10.2196/53977
[17] Leogrande, E., Botrugno, C., Trono, G., et al. (2025). A multiwavelength photoplethysmography dataset with blood pressure and heart rate reference measurements. Data in Brief, 63: 112284. https://doi.org/10.1016/j.dib.2025.112284
[18] Seong, S., Park, J., Kim, J.H. (2025). A new measurement for workload assessment in agricultural tasks: EDA-based real-time model. International Journal of Industrial Ergonomics, 108: 103771. https://doi.org/10.1016/j.ergon.2025.103771
[19] Feli, M., Kazemi, K., Azimi, I., Wang, Y., Rahmani, A.M., Liljeberg, P. (2023). End-to-end PPG processing pipeline for wearables: From quality assessment and motion artifacts removal to HR/HRV feature extraction. In 2023 IEEE International Conference on Bioinformatics and Biomedicine (BIBM), Istanbul, Turkiye, pp. 1895-1900. https://doi.org/10.1109/BIBM58861.2023.10385998
[20] Scardulla, F., Cosoli, G., Spinsante, S., et al. (2023). Photoplethysmographic sensors, potential and limitations: Is it time for regulation? A comprehensive review. Measurement, 218: 113150. https://doi.org/10.1016/j.measurement.2023.113150
[21] Hardon, H.J., Van Kerkhof, Y.N., Bartelds, B., Kammeraad, J.A.E., Van Deutekom, A.W. (2025). The validation and accuracy of wearable heart rate trackers in children with heart disease: Prospective cohort study. JMIR Formative Research, 9: e70835. https://doi.org/10.2196/70835
[22] Li, X., Onoguchi, G., Komatsu, H., et al. (2026). Calculation of approximate heart rate variability indicators based on low-resolution heart rate data provided by widely used commercially available wearable devices. Biomedical Signal Processing and Control, 112: 108579. https://doi.org/10.1016/j.bspc.2025.108579
[23] Charlton, P.H., Kyriacou, P.A., Mant, J., Marozas, V., Chowienczyk, P., Alastruey, J. (2022). Wearable photoplethysmography for cardiovascular monitoring. Proceedings of the IEEE, 110(3): 355-381. https://doi.org/10.1109/JPROC.2022.3149785
[24] Wu, Y., Liu, H., Li, B., et al. (2021). Individual thermal comfort prediction using classification tree model based on physiological parameters and thermal history in winter. Building Simulation, 14(6): 1651-1665. https://doi.org/10.1007/s12273-020-0750-y