Jenni Ria Rajagukguk* | Danang Aditya Pranoto | Edi Purwanto
© 2026 The authors. This article is published by IIETA and is licensed under the CC BY 4.0 license (http://creativecommons.org/licenses/by/4.0/).
OPEN ACCESS
Aircraft spare parts inventory systems operate under high uncertainty, strict safety requirements, and multi-echelon distribution structures. While prior studies predominantly focus on service-level optimization and forward allocation efficiency, limited attention has been given to internal reverse material flows generated by maintenance operations. This study investigates the determinants and implications of Return to Warehouse (RTW) within a multi-echelon aircraft spare parts system in a maintenance, repair, and overhaul (MRO) environment. Using two years of operational data from a major aircraft MRO provider, this research examines the structural relationship between maintenance type, aircraft type, procurement activity, inventory level, and RTW intensity. Variance-based empirical analysis reveals that maintenance heterogeneity and inventory status significantly influence reverse material flow, whereas aircraft type and procurement requests do not exhibit statistically significant effects. The findings indicate that RTW is primarily driven by maintenance-driven allocation uncertainty and inventory buffering behavior rather than fleet composition. The study conceptualizes RTW as an internal reverse logistics inefficiency indicator and introduces Reverse Logistics Intensity (RLI) as a measurable performance metric within maintenance-driven supply chains. The results extend spare parts inventory theory by integrating forward allocation dynamics with internal closed-loop material flows in high-reliability industries. From a managerial perspective, the findings suggest the need for maintenance-specific allocation policies, RTW-aware procurement controls, and dynamic buffer calibration to improve capital efficiency without compromising service reliability. This research contributes to the literature by providing empirical evidence on internal reverse logistics in aviation MRO systems and offers a practical framework for diagnosing inventory–maintenance misalignment in multi-echelon spare parts networks.
aircraft spare parts, reverse logistics, multi-echelon inventory, maintenance heterogeneity, Return to Warehouse, maintenance, repair, and overhaul supply chain
Aircraft maintenance, repair, and overhaul (MRO) operations constitute one of the most capital-intensive and operationally critical activities in the aviation industry. Unlike conventional manufacturing supply chains, aircraft spare parts systems operate under stringent safety regulations, strict traceability requirements, unpredictable demand patterns, and extremely high unit costs [1, 2]. The absence of a single critical component may ground an aircraft, leading to substantial operational disruptions and financial losses. Therefore, spare parts inventory in aviation represents not merely a cost component but a strategic enabler of fleet availability and service reliability [2].
Aircraft spare parts demand is inherently stochastic and largely driven by maintenance activities, inspection findings, and component reliability behavior. Scheduled maintenance events such as A-checks and C-checks generate relatively predictable material requirements, while unscheduled findings introduce significant variability and uncertainty [3]. This stochastic demand structure complicates inventory planning and increases the risk of either stockouts or excessive stocking. In multi-echelon systems, where central warehouses support satellite stores and hangars, these uncertainties propagate across the network and amplify inventory inefficiencies [4].
Existing research on aircraft spare parts inventory has predominantly focused on service-level optimization, multi-echelon modeling, and simulation-based inventory policies under uncertainty. For example, Gu et al. [2] developed efficient inventory management strategies for aircraft spare parts under demand uncertainty. Similarly, Reményi and Staudacher [5] demonstrated the role of simulation-based approaches in optimizing maintenance scheduling and spare parts availability. More recent studies emphasize simulation-optimization techniques to balance cost and availability in complex spare parts systems [6].
However, one operational phenomenon that remains underexplored in the literature is the reverse material flow of pre-allocated but unused spare parts within maintenance operations. In practice, spare parts are frequently issued to hangars in anticipation of maintenance tasks. When these components are ultimately not used, they are returned to the central warehouse, a process referred to in this study as Return to Warehouse (RTW).
In this study, RTW is defined with a dual role as both an operational process and an analytical construct. Operationally, RTW represents the physical reverse flow of pre-allocated spare parts that are not consumed during maintenance execution, while analytically it serves as an ex-post indicator of misalignment between planned allocation and actual material usage. Rather than being treated as an inherent inefficiency, RTW is interpreted as a measurable signal reflecting over-allocation, buffering behavior, and maintenance-driven uncertainty within the system. While conservative allocation policies are intended to avoid aircraft-on-ground (AOG) situations, over-allocation generates reverse logistics movements that increase handling costs, distort demand signals, and inflate inventory valuation [7, 8].
From a supply chain perspective, RTW represents an internal closed-loop logistics process embedded within a forward distribution network. Closed-loop supply chain research has demonstrated that reverse flows can significantly influence inventory policies, cost structures, and network performance [9]. Furthermore, simulation studies in multi-echelon inventory systems indicate that misalignment between demand forecasting and material positioning can produce systematic inefficiencies and excess capital lock-up [10].
Despite its operational relevance, empirical evidence quantifying the structural drivers of internal reverse logistics in aircraft MRO supply chains remains limited. In particular, the interaction between maintenance heterogeneity (e.g., maintenance type intensity), aircraft type diversity, procurement triggers, and inventory level fluctuations in explaining RTW intensity has not been sufficiently examined. Understanding this interaction is critical, as excessive reverse flows may artificially trigger new procurement orders due to system timing mismatches, thereby amplifying inventory inflation.
This study addresses this research gap by empirically investigating the determinants of RTW within a multi-echelon aircraft spare parts inventory system. Using operational data from a major aircraft MRO provider in Southeast Asia, this research evaluates how: (1) type of maintenance activity, (2) aircraft type heterogeneity, (3) procurement patterns, and (4) inventory value levels influence the magnitude of RTW.
Rather than treating RTW as an operational anomaly, this study conceptualizes it as a dependent indicator of inventory misalignment within maintenance-driven supply chains, reflecting the interaction between maintenance uncertainty, allocation policy, and inventory buffering. By integrating empirical analysis with variance-based modeling, this research contributes to the understanding of reverse logistics dynamics in spare parts inventory systems within high-reliability industries.
The contributions of this study are threefold: (1) Theoretical Contribution. The study introduces internal reverse logistics intensity (RLI) as a measurable construct linked to maintenance heterogeneity and inventory buffering behavior within aircraft MRO systems. (2) Methodological Contribution. The research provides an empirical evaluation framework for assessing reverse material flow within multi-echelon spare parts systems using operational data. (3) Managerial Contribution. The findings offer decision-support insights for aligning maintenance planning, procurement timing, and inventory allocation policies to reduce unnecessary reverse flows and improve working capital efficiency.
Aircraft maintenance, repair, and overhaul (MRO) operations constitute one of the most capital-intensive and operationally critical activities in the aviation industry. Unlike conventional manufacturing supply chains, aircraft spare parts systems operate under stringent safety regulations, strict traceability requirements, unpredictable demand patterns, and extremely high unit costs [1, 2]. The absence of a single critical component may ground an aircraft, leading to substantial operational disruptions and financial losses. Therefore, spare parts inventory in aviation represents not merely a cost component but a strategic enabler of fleet availability and service reliability [2].
Aircraft spare parts demand is inherently stochastic and largely driven by maintenance activities, inspection findings, and component reliability behavior. Scheduled maintenance events such as A-checks and C-checks generate relatively predictable material requirements, while unscheduled findings introduce significant variability and uncertainty [3]. This stochastic demand structure complicates inventory planning and increases the risk of either stockouts or excessive stocking. In multi-echelon systems, where central warehouses support satellite stores and hangars, these uncertainties propagate across the network and amplify inventory inefficiencies [4].
Existing research on aircraft spare parts inventory has predominantly focused on service-level optimization, multi-echelon modeling, and simulation-based inventory policies under uncertainty. For example, Gu et al. [2] developed efficient inventory management strategies for aircraft spare parts under demand uncertainty. Similarly, Reményi and Staudacher [5] demonstrated the role of simulation-based approaches in optimizing maintenance scheduling and spare parts availability. More recent studies emphasize simulation-optimization techniques to balance cost and availability in complex spare parts systems [6].
However, one operational phenomenon that remains underexplored in the literature is the reverse material flow of pre-allocated but unused spare parts within maintenance operations. In practice, spare parts are frequently issued to hangars in anticipation of maintenance tasks. When these components are ultimately not used, they are returned to the central warehouse, a process referred to in this study as Return to Warehouse (RTW).
In this study, RTW is defined with a dual role as both an operational process and an analytical construct. Operationally, RTW represents the physical reverse flow of pre-allocated spare parts that are not consumed during maintenance execution, while analytically it serves as an ex-post indicator of misalignment between planned allocation and actual material usage. Rather than being treated as an inherent inefficiency, RTW is interpreted as a measurable signal reflecting over-allocation, buffering behavior, and maintenance-driven uncertainty within the system. While conservative allocation policies are intended to avoid aircraft-on-ground (AOG) situations, over-allocation generates reverse logistics movements that increase handling costs, distort demand signals, and inflate inventory valuation [7, 8].
From a supply chain perspective, RTW represents an internal closed-loop logistics process embedded within a forward distribution network. Closed-loop supply chain research has demonstrated that reverse flows can significantly influence inventory policies, cost structures, and network performance [9]. Furthermore, simulation studies in multi-echelon inventory systems indicate that misalignment between demand forecasting and material positioning can produce systematic inefficiencies and excess capital lock-up [10].
Despite its operational relevance, empirical evidence quantifying the structural drivers of internal reverse logistics in aircraft MRO supply chains remains limited. In particular, the interaction between maintenance heterogeneity (e.g., maintenance type intensity), aircraft type diversity, procurement triggers, and inventory level fluctuations in explaining RTW intensity has not been sufficiently examined. Understanding this interaction is critical, as excessive reverse flows may artificially trigger new procurement orders due to system timing mismatches, thereby amplifying inventory inflation.
This study addresses this research gap by empirically investigating the determinants of RTW within a multi-echelon aircraft spare parts inventory system. Using operational data from a major aircraft MRO provider in Southeast Asia, this research evaluates how: (1) type of maintenance activity, (2) aircraft type heterogeneity, (3) procurement patterns, and (4) inventory value levels influence the magnitude of RTW.
Rather than treating RTW as an operational anomaly, this study conceptualizes it as a dependent indicator of inventory misalignment within maintenance-driven supply chains, reflecting the interaction between maintenance uncertainty, allocation policy, and inventory buffering. By integrating empirical analysis with variance-based modeling, this research contributes to the understanding of reverse logistics dynamics in spare parts inventory systems within high-reliability industries.
The contributions of this study are threefold: (1) Theoretical Contribution. The study introduces internal reverse logistics intensity (RLI) as a measurable construct linked to maintenance heterogeneity and inventory buffering behavior within aircraft MRO systems. (2) Methodological Contribution. The research provides an empirical evaluation framework for assessing reverse material flow within multi-echelon spare parts systems using operational data. (3) Managerial Contribution. The findings offer decision-support insights for aligning maintenance planning, procurement timing, and inventory allocation policies to reduce unnecessary reverse flows and improve working capital efficiency.
2.1 Spare parts inventory under demand uncertainty
Recent developments in aviation MRO supply chains have increasingly emphasized data-driven inventory management, predictive maintenance integration, and dynamic allocation strategies under uncertainty [11-13]. Rather than treating spare parts inventory as a static optimization problem, contemporary studies (2020–2025) conceptualize inventory systems as adaptive, information-driven networks where real-time data, forecasting accuracy, and operational feedback loops jointly determine performance outcomes. Within this evolving paradigm, the interaction between forward allocation decisions and reverse material flows becomes critical, yet remains insufficiently explored in existing literature. Therefore, this review is structured to progressively examine (1) forward inventory optimization under uncertainty, (2) maintenance-induced demand variability, (3) multi-echelon and closed-loop dynamics, and (4) the emerging gap related to internal reverse flows in MRO systems.
Spare parts inventory management differs fundamentally from traditional finished-goods inventory due to low demand frequency, high unit cost, and stochastic failure behavior. In high-reliability industries, such as aviation, service level requirements are extremely stringent because stockouts can result in AOG situations and significant operational losses [2].
Gu et al. [2] demonstrated that aircraft spare parts systems must account for uncertain demand patterns and long replenishment lead times, emphasizing the importance of service-level constrained optimization in aviation inventory management. Similarly, Köchel and Nieländer [4] showed that simulation-based optimization significantly improves performance in multi-echelon spare parts systems under uncertainty.
More recent research highlights the use of simulation-optimization models to balance holding cost and availability in two-echelon inventory systems [6]. These studies emphasize forward material flow efficiency but do not explicitly address the internal reverse movement of spare parts after pre-allocation. Recent studies (2020–2025) incorporate data-driven approaches, including machine learning, condition-based maintenance, and digital twins, to improve forecasting and allocation decisions in spare parts systems [11-13]. However, the literature still predominantly focuses on forward flow optimization, with limited attention to the impact of reverse flows within operational environments.
Thus, while existing literature extensively addresses optimal stocking policies and service-level design, limited attention has been given to the inefficiencies generated by over-allocation and subsequent reverse material flows.
2.2 Maintenance-induced demand variability
Aircraft spare parts demand is not purely failure-driven; it is strongly influenced by maintenance program structure. Scheduled maintenance (A-check, C-check, D-check) generates deterministic baseline demand, whereas unscheduled findings introduce stochastic variability [3].
Maintenance systems are characterized by inspection-based demand revelation. As highlighted by Reményi and Staudacher [5], inspection findings during heavy maintenance may significantly alter planned spare parts consumption, creating discrepancies between allocated and actually installed components.
Dhillon [14] further notes that reliability-centered maintenance frameworks inherently involve probabilistic component replacement decisions, increasing the variance of actual material usage. This maintenance heterogeneity suggests that spare parts pre-positioning strategies may generate systematic misalignment between expected and realized demand.
However, prior research predominantly models demand uncertainty from a forecasting or reliability standpoint, without explicitly examining the operational consequences of over-allocation in maintenance environments. This limitation is particularly relevant in the context of data-driven maintenance systems, where improved forecasting does not necessarily eliminate uncertainty in execution [12, 15, 16]. Even with advanced predictive models, maintenance outcomes remain partially contingent on inspection findings and real-time decision-making. Consequently, discrepancies between planned and actual material usage persist, potentially generating reverse material flows. This suggests that maintenance-induced uncertainty should not only be analyzed from a demand forecasting perspective but also from its downstream impact on inventory circulation and system efficiency.
2.3 Multi-echelon and closed-loop supply chains
Aircraft spare parts systems typically operate under a multi-echelon configuration: a central warehouse supplying satellite stores and maintenance hangars. Multi-echelon inventory theory demonstrates that positioning decisions at upstream levels influence downstream stock variability and total system cost [4].
In parallel, closed-loop supply chain research emphasizes that reverse flows, whether due to returns, remanufacturing, or internal redistribution, can significantly alter inventory dynamics and cost performance [9]. The reverse logistics literature has traditionally focused on product returns in retail or remanufacturing systems. However, in maintenance-intensive industries, reverse flows may occur internally when pre-issued materials are not consumed. Such internal reverse flows are rarely modeled in spare parts optimization frameworks. Recent research on closed-loop and circular supply chains highlights the importance of incorporating feedback mechanisms and reverse flows into system design, particularly in high-value and high-reliability industries [7, 8]. However, these studies predominantly address external returns (e.g., customer returns or remanufacturing loops), leaving internal operational returns, such as those occurring within MRO environments, largely unexplored. This creates a disconnect between theoretical models and actual operational dynamics in maintenance-driven supply chains. Akhtari et al. [10] showed that inventory misalignment across echelons can inflate system-wide cost and environmental impact. This suggests that reverse flow intensity may serve as an indicator of structural inefficiency within multi-echelon systems. Yet, empirical studies quantifying internal RLI in aircraft MRO systems remain limited.
2.4 Research gap and conceptual development
Despite significant advancements in spare parts inventory optimization and MRO supply chain research, a critical gap remains in understanding the role of internal reverse material flows within operational systems. First, while recent studies increasingly adopt data-driven and predictive approaches, they predominantly focus on improving forward allocation efficiency without systematically examining the feedback effects generated by unused pre-allocated materials. Second, although maintenance heterogeneity is widely recognized as a key driver of demand uncertainty, its downstream impact on inventory misalignment and reverse flow generation has not been empirically quantified. Third, existing closed-loop supply chain models primarily address external return processes and fail to capture internal reverse logistics embedded within maintenance operations.
Therefore, this study addresses these gaps by introducing RTW as both an operational phenomenon and a measurable indicator of inventory–maintenance misalignment. By empirically analyzing RTW within a multi-echelon MRO system, this research establishes a missing analytical link between maintenance uncertainty, allocation policy, and reverse material flow intensity, thereby extending both spare parts inventory theory and reverse logistics frameworks.
To ensure theoretical consistency, this study explicitly distinguishes between the ontological and analytical dimensions of RTW. Ontologically, RTW is an internal reverse logistics process embedded within maintenance operations, arising from the mismatch between planned and realized material usage. Analytically, RTW is operationalized as a measurable construct, captured through return frequency or return volume, that serves as a proxy for system inefficiency and allocation inaccuracy. This distinction is critical to avoid conceptual ambiguity and aligns the study with prior supply chain literature that separates physical flow processes from performance measurement constructs.
3.1 Data description
This study utilizes secondary operational data obtained from an aircraft MRO company over a two-year period (2017–2018), representing normal operational conditions prior to the COVID-19 disruption. The dataset is extracted from the company’s ERP system and includes records of spare parts issuance, consumption, RTW, procurement activity, maintenance type, aircraft type, and inventory valuation.
The material flow follows a multi-echelon structure, where spare parts are issued from the central warehouse to satellite stores in the hangar and may be returned if not consumed during maintenance. This RTW constitutes the primary focus of analysis, as it reflects the interaction between maintenance uncertainty, allocation policy, and inventory buffering.
To analyze the determinants of RTW, this study employs Analysis of Variance (ANOVA), which enables comparison of mean differences across categorical variables such as maintenance type and aircraft type. The use of aggregated operational data ensures that the analysis captures structural patterns rather than isolated transaction-level variations.
3.2 Variable definition
To ensure clarity and reproducibility, all variables used in this study are explicitly defined in terms of their operational representation, measurement unit, and analytical role.
(1) RTW. RTW is defined as the quantity of spare parts that are issued to the hangar but not consumed during maintenance and subsequently returned to the central warehouse. In this study, RTW is operationalized as return volume measured in batch units (number of returned part transactions) per observation period. Thus, RTW represents a frequency/volume-based metric, not a monetary value, although cost implications are discussed descriptively.
(2) Inventory Status. Inventory status refers to the total value of spare parts held in the central warehouse at a given time. This variable is measured as monthly inventory valuation in USD, as reported in the company’s ERP system. Therefore, inventory status represents a monetary value-based variable reflecting capital exposure in the inventory system.
(3) Procurement Activity. Procurement activity is defined as the number of spare parts purchase requests triggered by the system or manually initiated by planners. In this study, procurement is measured as frequency of purchase request transactions (count data) per period, rather than procurement value.
(4) Maintenance Type. Maintenance type represents categorical classification of aircraft maintenance activities (e.g., C01–C10, Others). This variable is treated as a categorical independent variable, reflecting different levels of maintenance complexity and uncertainty.
(5) Aircraft Type. Aircraft type refers to the model of aircraft undergoing maintenance (e.g., B737-800, A320). This variable is also treated as a categorical independent variable, representing fleet heterogeneity.
All variables are aggregated at the observation level used in the ANOVA analysis. The dependent variable in this study is RTW, while maintenance type, aircraft type, procurement activity, and inventory status serve as explanatory variables. This explicit operationalization ensures consistency between empirical analysis and theoretical constructs.
3.3 Analytical method
The analysis uses aggregated ERP records covering maintenance type, aircraft type, procurement activity, inventory status, and RTW. These variables are evaluated using two-way ANOVA to assess their individual and interaction effects on reverse material flow. Despite its suitability for group comparison, ANOVA has limitations when applied to count-based operational data such as RTW. Specifically, RTW originates from transaction counts, which may follow non-normal distributions (e.g., Poisson or overdispersed count processes). Therefore, alternative modeling approaches such as Poisson regression or negative binomial regression may provide more precise estimation in future research. However, given the study’s objective of identifying structural differences across operational categories and the use of aggregated data, ANOVA is considered an appropriate and interpretable first-step analytical approach.
To explain system conditions clearly and systematically, it will be accompanied by flow diagrams and sample data. The data used for modeling is secondary data for a period of 2 years (1 January 2017 – 31 December 2018). This section presents the empirical results derived from two years of operational data (2017–2018). The analysis focuses on patterns of spare parts movement, RTW, and their relationship with maintenance and inventory variables.
These data include spare parts delivery data from the Central store to the Hangar, spare parts inventory consumption data in the hangar, spare parts data per aircraft type, spare parts data per type of maintenance, RTW spare parts data to the central store, spare parts purchase data referring to the RTW part number. From this data, it will be obtained how many part numbers are needed for maintenance for each type of maintenance, type of aircraft, how many spare parts are returned to the central warehouse, and how many additional inventories from buying new spare parts. The addition of this inventory is very risky because it risks adding to the costs incurred by the company even though the actual purchased spare parts are still in stock in the Warehouse due to RTW.
Table 1 summarizes the volume of spare parts delivered from the central store to various operational units, reflecting the intensity of forward material flow within the system. These deliveries represent pre-allocation decisions based on maintenance planning and operational requirements.
Table 1. Spare parts delivery from central store period 2017
|
Plant |
Jan. |
Feb. |
Mar. |
Apr. |
May |
Jun. |
Jul. |
Aug. |
Sep. |
Oct. |
Nov. |
Dec. |
Total |
|
FLZ1 |
|
|
|
|
|
|
|
1 |
1 |
|
|
|
2 |
|
GAEM |
825 |
728 |
949 |
780 |
624 |
1106 |
1281 |
762 |
858 |
1137 |
773 |
810 |
10633 |
|
GAH1 |
1109 |
1926 |
2281 |
1541 |
791 |
1254 |
628 |
377 |
785 |
1491 |
1429 |
855 |
14467 |
|
GAH2 |
3165 |
2607 |
3273 |
2892 |
2961 |
3076 |
3039 |
3015 |
3109 |
2932 |
2671 |
2625 |
35365 |
|
GAH3 |
653 |
1332 |
2555 |
1489 |
1410 |
782 |
926 |
838 |
526 |
1567 |
1930 |
1018 |
15026 |
|
GAH4 |
4282 |
3492 |
5503 |
4760 |
4756 |
2439 |
4725 |
4386 |
4461 |
4602 |
4431 |
3155 |
50992 |
|
GNS1 |
|
|
|
|
|
|
|
|
|
|
7 |
3 |
10 |
|
GTO1 |
|
|
|
1 |
|
|
|
|
9 |
|
|
1 |
11 |
|
HKG1 |
3 |
|
|
|
|
|
2 |
|
2 |
2 |
1 |
|
10 |
|
HLP1 |
39 |
40 |
40 |
35 |
50 |
42 |
32 |
62 |
35 |
48 |
59 |
64 |
546 |
|
HND1 |
|
|
|
|
3 |
|
|
|
|
|
|
|
3 |
|
HSUB |
|
|
|
|
|
|
|
|
|
|
1 |
8 |
9 |
|
ICN1 |
|
|
|
|
|
|
|
|
|
|
14 |
|
14 |
|
JED1 |
1 |
|
7 |
|
|
2 |
5 |
22 |
|
43 |
3 |
11 |
94 |
|
JOG1 |
13 |
30 |
17 |
18 |
10 |
19 |
18 |
20 |
18 |
13 |
25 |
31 |
232 |
|
KDI1 |
1 |
|
6 |
5 |
|
2 |
2 |
4 |
|
5 |
1 |
1 |
27 |
|
KIX1 |
14 |
|
|
17 |
|
|
|
|
|
|
|
|
31 |
|
KJT1 |
|
|
|
|
|
6 |
2 |
|
|
|
|
5 |
13 |
|
KNO1 |
197 |
145 |
172 |
115 |
88 |
121 |
162 |
130 |
120 |
93 |
97 |
128 |
1568 |
|
KOE1 |
2 |
8 |
5 |
3 |
3 |
9 |
1 |
4 |
2 |
6 |
4 |
8 |
55 |
|
KUL1 |
|
1 |
|
|
|
|
|
3 |
|
|
|
|
4 |
|
LBJ1 |
3 |
1 |
4 |
1 |
2 |
|
3 |
3 |
3 |
6 |
|
3 |
29 |
|
LHR1 |
|
|
|
|
1 |
|
|
|
1 |
|
|
|
2 |
|
LOP1 |
66 |
37 |
114 |
100 |
82 |
35 |
64 |
25 |
85 |
88 |
34 |
57 |
787 |
|
LUV1 |
|
|
5 |
4 |
5 |
3 |
4 |
2 |
1 |
|
|
2 |
26 |
|
MDC 1 |
31 |
30 |
27 |
25 |
10 |
14 |
5 |
17 |
8 |
8 |
5 |
7 |
187 |
In central store delivery, when there is a request from the hangar for spare parts or certain materials, a request for delivery will appear from the ERP system automatically. The Central Warehouse Operator is tasked with fulfilling these requests with the picking process, starting from material picking activities, checking spare parts taken with requests, updating stock in the Warehouse ERP system, and submitting it to the logistics or shipping department. For this activity, the average operator spends about 4 minutes per spare part. Logistics operators receive components from warehouse operators and carry out packaging according to shipping standards to the warehouse from which they were requested. Then the logistics section looks for the most suitable shipment to the production warehouse, such as for the CGK area using pick-up cars (Wide Body Hangar for domestic aircraft, Hangar Wide Body for foreign aircraft, Hangar Narrow Body), while for warehouses outside CGK using trucks, planes or ships by sea depending on the size of the goods and the target arriving at its destination. The company's central store is a storage place for serviceable spare parts for aircraft originating from new purchases, repairs at internal and external workshops, loans, returns from hangar warehouses in the CGK area and outstations. In this study, full observation of shipments from the central store to narrow body hangars refers to shipping data that most spare parts are sent to narrow body hangars (GAH4).
In terms of inventory consumption, after the spare parts are sent from the Central store, the operator at the satellite store will carry out physical checks and shipping documents and if they are appropriate then a good receive will be carried out in the ERP system. About 5 minutes later, a request for spare parts based on a work order will be printed on the printer and the satellite store operator will process and prepare the spare parts to be picked up by an aircraft technician. In the ERP system, these spare parts have been consumed by the aircraft based on material work orders. As an illustration, the table below shows the consumption of spare parts per batch in the hangar in the 2017 and 2018 periods.
Table 2 presents the corresponding consumption of spare parts in the hangar, indicating actual material usage during maintenance activities. The difference between issued and consumed materials forms the basis for analyzing RTW behavior. RTW spare parts that are not used for production in the hangar will be returned to the satellite store, then the PPC (production plan control) department issues these items on a work order in the ERP system so that the spare parts can be processed and sent to the central store. The warehouse officer at the satellite store makes a stock transport order (STO), posts a good issue and then automatically prints a delivery note (DN) on the ERP system for the spare parts that will be returned to the central store. In 2017 there were RTW spare parts from the narrow body hangar totaling 7,879 batches, then using the pivot table method in Microsoft Excel the author decided to use the ten-part numbers that were mostly done by RTW.
Table 2. Table of hangar inventory consumption in 2017
|
Month |
HG1 |
HG2 |
HG3 |
HG4 |
Total Batch |
|
Jan. |
1,777 |
4,529 |
1,390 |
3,939 |
11,635 |
|
Feb. |
2,131 |
4,158 |
2,579 |
3,245 |
12,113 |
|
Mar. |
1,664 |
4,482 |
2,754 |
5,187 |
14,087 |
|
Apr. |
2,290 |
4,156 |
1,640 |
4,982 |
13,068 |
|
May |
1,618 |
4,428 |
1,135 |
5,531 |
12,712 |
|
Jun. |
673 |
4,190 |
778 |
2,917 |
8,558 |
|
Jul. |
780 |
4,863 |
1,296 |
3,848 |
10,787 |
|
Aug. |
1,060 |
5,086 |
524 |
4,249 |
10,919 |
|
Sep. |
1,024 |
4,222 |
1,460 |
4,296 |
11,002 |
|
Oct. |
3,179 |
4,574 |
2,582 |
5,507 |
15,842 |
|
Nov. |
3,507 |
4,308 |
2,350 |
6,493 |
16,658 |
|
Dec. |
2,173 |
4,366 |
831 |
5,104 |
12,474 |
|
Total Batch |
21,885 |
53,364 |
19,322 |
55,305 |
149,876 |
The top 10 part numbers were selected based on the highest frequency of RTW occurrences during the observation period, following a Pareto-based approach. This selection captures high-impact items that contribute disproportionately to reverse material flow. However, as the analysis focuses on high-frequency items, the findings may not fully represent lower-frequency components, which limits generalizability.
However, it is important to note that this subset is used as a representative sample of high-frequency return items rather than a complete representation of all spare parts. The underlying assumption is that patterns observed in high-impact items reflect broader operational tendencies within the system, particularly in relation to maintenance-driven uncertainty and allocation practices.
Table 3 presents the ten spare parts with the highest RTW frequency from the narrow-body hangar to the central store during the 2017–2018 observation period. These high-frequency return items were selected to represent dominant reverse material flow patterns for subsequent analysis.
Table 3. Return to Warehouse (RTW) from hangar narrow body to central store
|
No. |
Part Number |
2017 |
2018 |
|
1 |
M25988-1-110:81205 |
25 |
10 |
|
2 |
116A7701-1:81205 |
22 |
6 |
|
3 |
AS3578-226:81343 |
20 |
10 |
|
4 |
2215696-1WE:26647 |
20 |
5 |
|
5 |
10-900-21:0DLY8 |
20 |
4 |
|
6 |
M25988-1-127:81205 |
20 |
2 |
|
7 |
D717-01-100:K0673 |
19 |
14 |
|
8 |
D5347504521400:FAPE3 |
19 |
10 |
|
9 |
MS21059L3:96906 |
19 |
9 |
|
10 |
9048156:59501 |
19 |
5 |
Narrow body aircraft maintenance, the narrow body hangar has a capacity of 16 production lines, which means that the hangar can maintain 16 to 32 aircraft, with each production line carrying out maintenance for 2 aircraft together in a nose to tail position. There are several types of aircraft maintenance as discussed earlier in chapter 2. Table 4 summarizes the number of narrow-body aircraft maintenance activities conducted in 2017 and 2018 according to maintenance type.
Table 4. Number of narrow body aircraft maintenance
|
Type of Maintenance |
2017 |
2018 |
Total |
|
C01 |
26 |
32 |
58 |
|
C02 |
21 |
29 |
50 |
|
C03 |
9 |
23 |
32 |
|
C04 |
10 |
30 |
40 |
|
C05 |
5 |
6 |
11 |
|
C06 |
7 |
6 |
13 |
|
C07 |
|
9 |
9 |
|
C08 |
1 |
2 |
3 |
|
C09 |
1 |
2 |
3 |
|
C10 |
4 |
|
4 |
|
Other |
6 |
13 |
19 |
|
Total |
90 |
152 |
242 |
Because the aircraft maintenance process in the hangar is not automatic, the amount of mechanics in the hangar will determine whether or not there is a queue of work. The mechanics in the Hangar consist of various competencies to carry out aircraft maintenance. The work pattern in the narrow body hangar is 2 shifts, with each shift totaling 20 people for each aircraft with the working hours of each shift. Table 5 presents the work shift schedule of mechanics in the narrow-body hangar, which supports continuous maintenance operations throughout the day.
Table 5. Mechanical work patterns in hangar narrow body
|
Shift / Hours |
Entry |
Return |
|
Morning |
07.00 |
16.00 |
|
Afternoon |
15.00 |
23.00 |
Within a week production will enter for 5 days from Monday to Friday. Saturday and Sunday tentative overtime according to workload. There are several types of aircraft as discussed earlier in chapter 2 and Table 6 displays the types of aircraft in 2017 and 2018 that carried out maintenance in narrow body hangars. Table 6 shows the distribution of aircraft types that underwent maintenance in the narrow-body hangar during 2017 and 2018.
Table 6. Number of narrow body aircraft in hangar
|
Aircraft Type |
2017 |
2018 |
Total |
|
737-300 |
1 |
|
1 |
|
737-400 |
1 |
|
1 |
|
737-500 |
5 |
1 |
6 |
|
737-700 |
4 |
1 |
5 |
|
737-800 |
26 |
62 |
88 |
|
737-900 |
14 |
2 |
16 |
|
A319 |
1 |
3 |
4 |
|
A320 |
31 |
60 |
91 |
|
ATR42 |
|
2 |
2 |
|
ATR72 |
4 |
13 |
17 |
|
CRJ1000 |
3 |
8 |
11 |
|
Total |
90 |
152 |
242 |
For RTW spare parts per type of maintenance, from 11 types of aircraft maintenance above, we conducted further research per type of maintenance compared to RTW spare parts. The table below displays the number of RTW spare parts for each type of aircraft maintenance for 2017 and 2018. Table 7 summarizes the frequency of RTW spare parts according to maintenance type during the 2017–2018 observation period, providing the basis for evaluating maintenance-related differences in reverse material flow.
In RTW spare parts per aircraft type, narrow body aircraft have several types, each aircraft manufacturer such as Boeing, Airbus, CRJ, ATR produces this type of aircraft, the table below shows the number of RTW spare parts in each type of aircraft maintained in the hangar narrow body period of 2017 and 2018.
Table 7. Return to Warehouse (RTW) by maintenance type in 2017 and 2018
|
Type of Maintenance |
Total Batch |
|
|
2017 |
2018 |
|
|
C01 |
229 |
941 |
|
C02 |
1542 |
870 |
|
C03 |
880 |
519 |
|
C04 |
878 |
2298 |
|
C06 |
42 |
239 |
|
C07 |
0 |
128 |
|
C08 |
0 |
1157 |
|
C09 |
306 |
31 |
|
C10 |
458 |
31 |
|
Other |
556 |
568 |
|
Total |
4891 |
6782 |
The purchase of spare parts by the material purchaser can be done if the stock status in the warehouse is empty and there is a request from production as follows: (1) Planned requests (planning), (2) Routine requests for minimum stock (min max), and (3) Urgent requests (finding). Speed in processing RTW spare parts is one of the causes for purchasers to purchase materials. The ERP system will see spare parts stock in the central store if there is a request for material from production, along with RTW spare parts which are purchased by the purchaser. In Inventory Status, aircraft spare parts inventory in each company is always controlled and reported for follow-up. In this study, the company gives responsibility to the inventory control section, considering that inventory is the business capital of a company. The table below shows the status of Inventory movements from January to December in 2017 and 2018. Table 8 presents the monthly inventory status for 2017 and 2018, illustrating changes in inventory value throughout the observation period.
Table 8. Status inventory
|
Month |
Year |
|
|
2017 |
2018 |
|
|
Jan. |
$72,943,050 |
$76,245,623 |
|
Feb. |
$71,950,929 |
$79,095,611 |
|
Mar. |
$71,239,571 |
$77,935,840 |
|
Apr. |
$72,689,148 |
$79,581,491 |
|
May |
$71,795,798 |
$79,287,215 |
|
Jun |
$71,981,863 |
$80,450,192 |
|
Jul. |
$72,482,979 |
$80,986,554 |
|
Aug. |
$72,051,639 |
$81,559,365 |
|
Sep. |
$73,516,585 |
$81,474,372 |
|
Oct. |
$74,244,205 |
$83,241,698 |
|
Nov. |
$75,088,636 |
$84,166,210 |
|
Dec. |
$73,822,010 |
$85,530,454 |
From RTW to the Central store, from the data above, the next step is to validate the computer model. The F test or simultaneous regression coefficient test is a statistical test to see whether the independent variables to be entered have a simultaneous and simultaneous effect on the dependent variable or not. This test will use the help of Microsoft Excel software in the data analysis section using the output data from the shipment of RTW spare parts hangar narrow body. The statistical analysis was conducted using Microsoft Excel Data Analysis ToolPak with a significance level (α) of 0.05. Two-way ANOVA was applied to evaluate the main and interaction effects of categorical variables on RTW. Key statistics reported include F-values, p-values, and mean square errors. Although Excel is used for initial analysis, the statistical procedures follow standard ANOVA methodology. Future studies are encouraged to use advanced statistical software (e.g., R, Python, or SPSS) to enable more robust diagnostics and model extensions.
Table 9 presents the results of the F-test comparing the variance of RTW data between 2017 and 2018 as a preliminary step before conducting the two-way ANOVA.
Table 9. Test results F test on Return to Warehouse (RTW) to the central store
|
Year |
2017 |
2018 |
|
Mean |
20.3 |
7.5 |
|
Variance |
3.566667 |
13.38889 |
|
Observations |
10 |
10 |
|
df |
9 |
9 |
|
F |
0.26639 |
|
|
P(F<=f) one-tail |
0.030908 |
|
|
F Critical one-tail |
0.314575 |
|
From the results of the F test above, we get the result that F count ≤ F table, so the sample is homogeneous, and the p-value is smaller than 0.05, so it can be concluded that the data has a different variance. Paired t test is a statistical test performed to compare two population groups and to conclude that the mean of the two data sets cannot be significantly different. From the above results it is found that the p-value = 0.0000038, which is smaller than the error value set at 0.05, it can be concluded that there is sufficient evidence to state that there is a significant difference between the RTW data period 2017 and 2018. After obtaining the results of the F test and paired T test, the next process is the significance test of the comparison of variables, the statistical test carried out is the two-way Anova. Prior to conducting ANOVA, key statistical assumptions were considered. First, the normality assumption was assessed at the aggregated group level. Given that the data represent aggregated observations over multiple transactions and time periods, the distribution of group means is assumed to approximate normality based on the central limit theorem. Second, homogeneity of variance was evaluated using the F-test results, which indicate that variance differences across groups remain within acceptable limits for ANOVA application. While some variance heterogeneity is observed, ANOVA is generally robust to moderate deviations from this assumption, particularly under balanced or near-balanced group structures.
The results of the significance test for the comparison of scenarios using the two-way ANOVA test are as follows: (1) In the sample, it is found that the p-value is 0.493 exceeding the error value set at 0.05, it can be concluded that the type of aircraft and the difference in part number do not affect the number of RTW. (2) In the column, the result is that the p-value is 0.000041, which is smaller than the error value set at 0.05, it can be concluded that the difference in years affects the number of RTW. (3) In interaction, the result is that the P value is 0.741 greater than the error value set at 0.05, it can be concluded that the variable type of aircraft and the difference in part number have no effect on the year period variable.
RTW per maintenance type, based on Table 10, shows (1) In the sample it was found that the p-value of 0.0019 is smaller than the error value set at 0.05, it can be concluded that the aircraft maintenance type and the difference in part number affect the number of RTW. (2) In the column, the result is that the p-value is 0.00000041 which is smaller than the error value set at 0.05, it can be concluded that the difference in years affects the number of RTW. (3) In interaction, the result is that the P value is 0.9797 greater than the error value set at 0.05, it can be concluded that the aircraft maintenance type variable and the difference in part number have no effect on the year period variable.
Table 10 summarizes the results of the two-way ANOVA examining the relationship between RTW and maintenance type across the two-year observation period.
Table 10. Two-way Analysis of Variance (ANOVA) results from Return to Warehouse (RTW) per maintenance type
|
Source of Variation |
SS |
df |
MS |
F |
P-Value |
F Crit |
|
Sample |
1834.709091 |
9 |
203.8565657 |
3.173538384 |
0.001910446 |
1.966053725 |
|
Columns |
3798.009091 |
10 |
379.8009091 |
5.912553071 |
0.0000004 |
1.91782714 |
|
Interaction |
3804.990909 |
90 |
42.27767677 |
0.658158002 |
0.979698998 |
1.389631202 |
|
Within |
7066 |
110 |
64.23636364 |
|
|
|
|
Total |
16503.70909 |
219 |
|
|
|
|
Furthermore, RTW per parts purchase is a significant test for the comparison of RTW spare parts variables with requests to purchase; the statistical test carried out is a two-way ANOVA. The two-way ANOVA results indicate that the sample effect is not statistically significant (p = 0.1291 > 0.05), suggesting that purchase request activity does not influence RTW. In contrast, the column effect (year) is significant (p < 0.05), indicating temporal variation in RTW. The interaction effect is not significant, implying no combined influence between variables.
Table 11 presents the two-way ANOVA results evaluating the relationship between RTW and inventory status during the study period.
In the sample it was found that the value of p-value is smaller than the error value set at 0.05 so it can be concluded that inventory status and differences in part numbers affect the number of RTW. In the column, the result is that the P Value is 0.5238, which is greater than the error value set at 0.05, it can be concluded that the difference in years does not affect the number of RTW. On interaction, the result is that the P value is 0.7915 greater than the error value set at 0.05, it can be concluded that the inventory status variable and the difference in part number have no effect on the year period variable. In actual operational conditions, the central store will serve all requests from the production hangar based on prior requests, the satellite store clerk will make a request for spare parts to the central store and if spare parts are available, they will be sent immediately according to the requestor's destination. In 2017 there were 181,959 batches worth 98,634,127 and in 2018 there were 203,462 batches of spare parts worth 102,807,214 sent from the central store to all satellite stores. Based on RTW data from the narrow body hangar, in 2017 there were 7,879 batches worth 4,749,157 and in 2018 there were 7,857 batches of spare parts worth 5,515,841. Several variable approaches were carried out and analyzed the probabilities of the causes of RTW.
Table 11. Two-way Analysis of Variance (ANOVA) results from Return to Warehouse (RTW) per inventory status
|
Source of Variation |
SS |
df |
MS |
F |
P-Value |
F Crit |
|
Sample |
60405931 |
9 |
6711770.111 |
38.89207549 |
1.57608E-31 |
1.9587632 |
|
Columns |
1746207.333 |
11 |
158746.1212 |
0.919871514 |
0.523814471 |
91.68692904 |
|
Interaction |
14589140 |
99 |
147365.0505 |
0.853922672 |
0.791578471 |
21.23694873 |
|
Within |
20708908 |
120 |
172574.2333 |
|
|
05 |
|
Total |
97450186.33 |
239 |
|
|
|
|
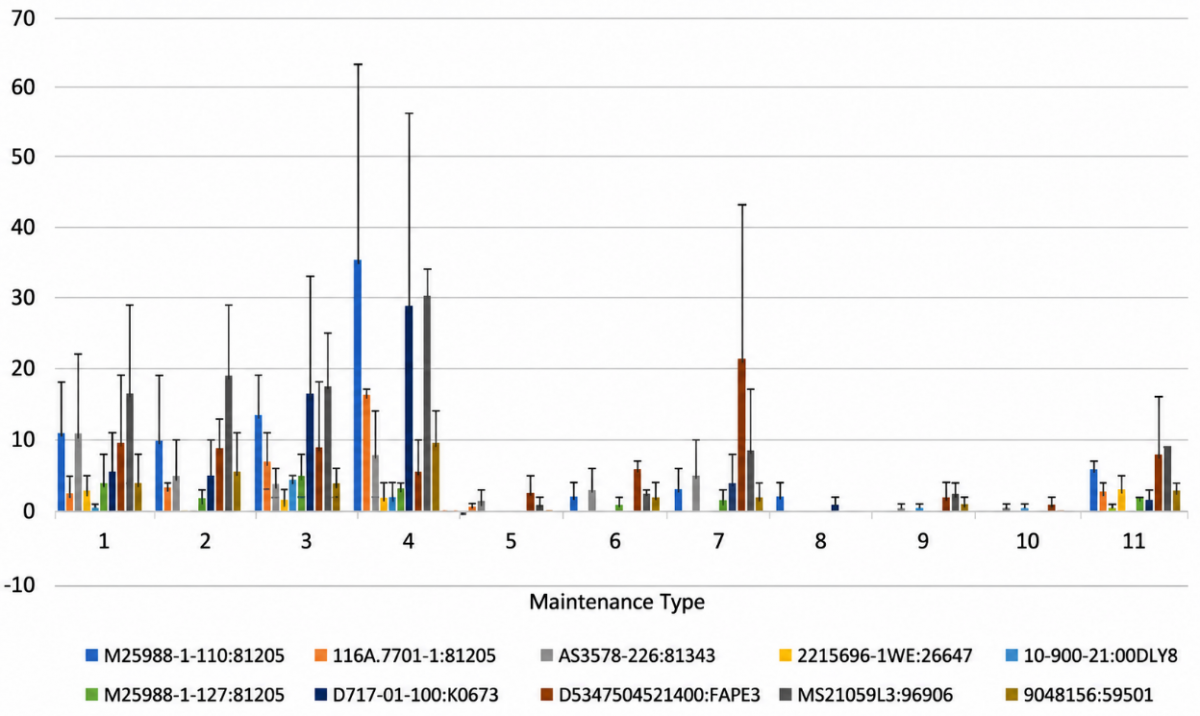
If a relationship is found to increase the value of inventory with RTW and several probabilities of causing RTW, the decision to reduce the amount of RTW is to evaluate the RTW part number and the probability of its occurrence so that it is hoped that there will be no losses due to high production costs which can harm the company. Companies can use RTW percentage data per aircraft type and maintenance type to reduce the number of spare parts purchases, reduce inventory amounts, evaluate the need for part numbers in work orders and evaluate the biggest possible causes of RTW. Companies can also use the model in this study to describe the condition of RTW inventory parts outside the ten-part number as an example. Figure 1 shows the RTW diagram with the variable aircraft maintenance type with a standard error for each part number.
Figure 1. Return to Warehouse (RTW) bar chart per aircraft maintenance type
To avoid redundancy and ensure analytical focus, this discussion emphasizes statistically supported findings and limits conceptual elaboration to variables with significant empirical effects. Non-significant results are interpreted conservatively to prevent overgeneralization.
5.1 Interpreting the key findings: Why internal reverse flow matters
This study empirically demonstrates that RTW is not a random operational anomaly but a systematic manifestation of inventory–maintenance misalignment inside aircraft MRO spare parts networks. In the observed case, RTW represents a non-trivial capital exposure: the narrow-body hangar returned 7,879 batches (USD 4.75 million) in 2017 and 7,857 batches (USD 5.52 million) in 2018, while overall inventory valuation increased substantially across months and years.
Open-access studies on aviation spare parts systems consistently emphasize that uncertainty, service-criticality, and long lead times force firms to pre-position materials to avoid AOG events; however, they typically frame the problem from the forward-flow and availability perspective (e.g., network design, pooling, and allocation). For example, Wang et al. develop an inventory pooling/location selection approach grounded in METRIC logic to improve spare parts availability across a central–satellite structure, highlighting the importance of network structure in aviation spares performance [17]. The present study complements this body of work by showing that within such forward networks, RTW can become a recurring “shadow cost driver” through handling, administrative transactions, and distorted demand signals.
5.2 Maintenance type significantly affects Return to Warehouse: Consistent with maintenance-driven uncertainty literature
The two-way ANOVA indicates that maintenance type significantly affects RTW (sample effect p ≈ = 0.0019), and the year effect is also significant in the maintenance-type comparison. This result is aligned with open-access evidence characteristics, and interval decisions shape spare parts system performance.
In particular, Gallego-García et al. [18] show that planned maintenance interval design and distribution network decisions jointly influence fleet efficiency and spare parts management outcomes, implying that heavier or more uncertain maintenance profiles create higher variability in material needs. Your data display the same pattern empirically: RTW varies substantially across maintenance categories (e.g., C04 and C08 spikes in 2018), which is consistent with the notion that deeper inspections reveal additional findings and cause planned material requirements to deviate from actual consumption.
Mechanistically, maintenance type captures the depth of inspection, uncertainty of findings, and task scope [15, 16]. Research on MRO operations and maintenance planning emphasizes that uncertainty about work scope is often only resolved after inspection stages, which complicates material planning and can amplify replanning and material flow corrections [19]. This supports the interpretation that RTW is largely a “maintenance-driven” phenomenon: the more the scope is uncertain at the time of pre-allocation, the higher the probability that parts issued “just in case” are not eventually installed and must be returned.
5.3 Aircraft type is not significant: A plausible “fleet composition + standardization” effect
Your two-way ANOVA results indicate that aircraft type does not significantly affect RTW (sample p ≈ 0.493), suggesting that differences among aircraft models are not the dominant driver of returns in this dataset. However, this result should be interpreted cautiously, as the statistical analysis indicates no significant effect of aircraft type on RTW. Therefore, any operational explanation should be understood as exploratory rather than confirmatory, and the findings do not provide sufficient evidence to establish a causal relationship. One plausible explanation, consistent with MRO operations logic, is that the case is dominated by narrow-body maintenance with relatively standardized process-dulling routines, and therefore the major variability comes from maintenance event type rather than aircraft platform.
This finding also resonates with open-access work that emphasizes network and planning design effects (pooling, echelon positioning, and maintenance inrs, often exceeding platform effects when a firm operates within a relatively homogeneous fleet segment or standardized MRO processes [17].
At the same time, this “non-significant aircraft type” result should be interpreted cautiously: (i) the analysis is performed on selected part numbers/top-return items, which may be biased toward cross-platform common items; and (ii) aircraft type effects may appear when modeling at a finer granularity (e.g., ATA chapter groups, rotable vs consumable, or platform-specific high-value components).
5.4 Purchase requests are not significant: Evidence of timing mismatch and planning loop gaps
The analysis indicates that purchase request activity does not significantly explain RTW in the two-way ANOVA sample effect (p ≈ 0.1291). Accordingly, the interpretation of procurement-related dynamics is limited, and no strong inference can be made regarding its direct influence on reverse material flow. This suggests that procurement is not reacting linearly to the same patterns that drive RTW, which strengthens the argument that RTW can distort ERP/stock signals and create “lagged” or indirect effects. The research on MRO demand forecasting underscores that improving forecast accuracy alone is insufficient unless forecasting is connected effectively to material planning and production control processes [1, 12, 19]. In your setting, RTW is processed via ERP transactions (STO, GI, DN), implying that system timing and processing speed can decouple procurement triggers from true physical availability. Thus, the non-significance of purchase requests can be interpreted as a symptom of planning loop gaps: procurement decisions may be driven more by perceived shortages at the time of request, rather than by real-time reconciliation of returns that arrive later.
Inventory status shows an extremely strong association with RTW (very small p-value in the inventory-status ANOVA sample effect), confirming that higher inventory levels and inventory variation are linked to RTW magnitude. This aligns with the concept that excessive buffering can amplify internal circulation: when there is more stock in the system and allocation policies are conservative, the volume of parts issued “to be safe” increases, which mechanically increases the opportunity for nrom a closed-loop / reverse logistics perspective, the wider literature (including open-access syntheses) emphasizes that reverse flows interact with inventory policies and can materially affect system performance, especially when decision rules were designed primarily for forward distribution [20]. Your results provide empirical confirmation in a high-reliability context: RTW should be treated as a control variable and KPI in inventory governance (e.g., RLI index), not merely a warehouse operational metric.
5.6 Contribution relative to prior studies
Compared to prior open-access aviation spares research that concentrates on network design, pooling, and forward availability optimization, this study contributes by operationalizing internal RTW as an observable indicator of inefficiency inside MRO supply chains [17].
Compared to open-access MRO planning and forecasting discussions that stress uncertainty of work scope and the need for tighter integration between planning and control, this study provides empirical evidence that maintenance heterogeneity is a statistically significant driver of reverse flows, which can be interpreted as a measurable consequence of scope uncertainty and conservative pre-allocation behavior [19].
Finally, compared to general reverse logistics literature emphasizing simulation-optimization and policy comparisons, your work extends the discussion to internal returns within a safety-critical industrial system, where returns are not customer-driven but maintenance-driven and embedded within a multi-echelon operational workflow [20].
5.7 Managerial implications derived from the discussion
The results imply four concrete interventions: First, mainkitting/allocation rules. For maintenance categories with high RTW, replace blanket pre-allocation with staged kitting (release parts after inspection milestones), consistent with the logic that scope uncertainty resolves over time [19]. Second, RTW-aware procurement gating. Introduce a short “reconciliation window” in ERP procurement triggers to account for in-transit/processing returns before issuing new purchase requests, reducing capital lock-up. Third, Inventory governance using RLI. Track RTW/issued ratio by maintenance type as an operational KPI linked to continuous improvement (lean logistics) and planning accuracy. Fourth, network-level policy check. Revisit central–satellite stocking thresholds for classes of parts with recurrent returns; pooling and network design improvements can reduce over-positioning [17].
5.8 Limitations and future research
A potential limitation of this study relates to the selection of part numbers for analysis. The empirical analysis focuses on the top 10 part numbers with the highest RTW frequency, which may introduce selection bias by emphasizing high-return items. While this approach allows for deeper insight into dominant operational patterns, it may limit the generalizability of findings to lower-frequency or less critical components. Future research should consider full-population analysis or stratified sampling approaches to capture a more comprehensive representation of spare parts behavior across different categories.
This study is limited by the use of ANOVA and selected part number sets, which may mask heterogeneous effects across part categories (rotatable VFT subsystems. Future research should implement count-data econometric models (e.g., negative binomial) and incorporate additional operational covariates (lead time, criticality, shelf life, repair turnaround, and inspection findings). Moreover, integrating predictive maintenance/PHM information may enable earlier scope clarification and reduce conservative over-allocation—an avenue supported by open-access simulation evidence linking maintenance information quality to spare parts investment and availability [21].
This study examines the determinants of RTW within a multi-echelon aircraft spare parts system using empirical operational data from an MRO environment. The results show that maintenance type and inventory status significantly influence RTW, while aircraft type and procurement activity do not have a statistically significant effect. These findings indicate that RTW is primarily driven by maintenance-driven uncertainty and inventory buffering behavior rather than fleet characteristics or purchasing decisions. In particular, maintenance heterogeneity increases the likelihood of misalignment between planned allocation and actual consumption, while higher inventory levels amplify internal material circulation. From a practical perspective, the results highlight three key implications. First, spare parts allocation should be differentiated based on maintenance type, with staged or conditional release policies to reduce over-allocation. Second, procurement decisions should incorporate RTW reconciliation mechanisms to prevent unnecessary purchasing triggered by delayed return flows. Third, RTW should be monitored as a performance indicator (e.g., Reverse Logistics Intensity) to support continuous inventory optimization. Quantitatively, the findings suggest that even a modest reduction in reverse flow intensity can generate significant operational benefits. A reduction of approximately 1% in RTW may correspond to a decrease of 1,800–2,000 return transactions annually, with potential cost savings in the range of USD 0.8–1.2 million.
This study contributes by positioning RTW as a measurable indicator of inventory–maintenance misalignment and by providing an empirical basis for integrating reverse flow considerations into spare parts inventory management. Future research should extend this analysis using more advanced modeling approaches and broader datasets to improve generalizability.
[1] Van der Auweraer, S., Boute, R. (2019). Forecasting spare part demand using service maintenance information. International Journal of Production Economics, 213: 138-149. https://doi.org/10.1016/j.ijpe.2019.03.015
[2] Gu, J., Zhang, G., Li, K.W. (2015). Efficient aircraft spare parts inventory management under demand uncertainty. Journal of Air Transport Management, 42: 101-109. https://doi.org/10.1016/j.jairtraman.2014.09.006
[3] Al-Fares, H.K., Duffuaa, S.O. (2009). Maintenance forecasting and capacity planning. In Handbook of Maintenance Management and Engineering, Springer London, pp. 157-190. https://doi.org/10.1007/978-1-84882-472-0_8
[4] Köchel, P., Nieländer, U. (2005). Simulation-based optimisation of multi-echelon inventory systems. International Journal of Production Economics, 93: 505-513. https://doi.org/10.1016/j.ijpe.2004.06.046
[5] Reményi, C., Staudacher, S. (2014). Systematic simulation based approach for the identification and implementation of a scheduling rule in the aircraft engine maintenance. International Journal of Production Economics, 147: 94-107. https://doi.org/10.1016/j.ijpe.2012.10.022
[6] Alharkan, I., Saleh, M., Ghaleb, M., Farhan, A., Badwelan, A. (2020). Simulation-based optimization of a two-echelon continuous review inventory model with lot size-dependent lead time. Processes, 8(9): 1014. https://doi.org/10.3390/pr8091014
[7] Simonetto, M., Sgarbossa, F., Battini, D., Govindan, K. (2022). Closed loop supply chains 4.0: From risks to benefits through advanced technologies. A literature review and research agenda. International Journal of Production Economics, 253: 108582. https://doi.org/10.1016/j.ijpe.2022.108582
[8] Govindan, K., Soleimani, H., Kannan, D. (2015). Reverse logistics and closed-loop supply chain: A comprehensive review to explore the future. European Journal of Operational Research, 240(3): 603-626. https://doi.org/10.1016/j.ejor.2014.07.012
[9] Godichaud, M., Amodeo, L. (2013). Comparing inventory policies for closed-loop supply chain using simulation-based optimization. IFAC Proceedings Volumes, 46(9): 418-423. https://doi.org/10.3182/20130619-3-RU-3018.00384
[10] Akhtari, S., Sowlati, T., Siller-Benitez, D.G., Roeser, D. (2019). Impact of inventory management on demand fulfilment, cost and emission of forest-based biomass supply chains using simulation modelling. Biosystems Engineering, 178: 184-199. https://doi.org/10.1016/j.biosystemseng.2018.11.015
[11] Dursun, İ., Akcay, A., van Houtum, G.J. (2024). How good must failure predictions be to make local spare parts stock superfluous?. International Journal of Production Economics, 267: 109060. https://doi.org/10.1016/j.ijpe.2023.109060
[12] Zhu, S., van Jaarsveld, W., Dekker, R. (2020). Spare parts inventory control based on maintenance planning. Reliability Engineering & System Safety, 193: 106600. https://doi.org/10.1016/j.ress.2019.106600
[13] de Pater, I., Mitici, M. (2021). Predictive maintenance for multi-component systems of repairables with Remaining-Useful-Life prognostics and a limited stock of spare components. Reliability Engineering & System Safety, 214: 107761. https://doi.org/10.1016/j.ress.2021.107761
[14] Dhillon, B.S. (2009). Human reliability and error in maintenance. In Handbook of Maintenance Management and Engineering, Springer London, pp. 695-710. https://doi.org/10.1007/978-1-84882-472-0_25
[15] Liu, Y.Y., Chang, K.H., Chen, Y.Y. (2023). Simultaneous predictive maintenance and inventory policy in a continuously monitoring system using simulation optimization. Computers & Operations Research, 153: 106146. https://doi.org/10.1016/j.cor.2023.106146
[16] Zhang, J., Zhao, X., Song, Y., Qiu, Q. (2022). Joint optimization of condition-based maintenance and spares inventory for a series–parallel system with two failure modes. Computers & Industrial Engineering, 168: 108094. https://doi.org/10.1016/j.cie.2022.108094
[17] Wang, R., Qin, Y., Sun, H. (2021). Research on location selection strategy for airlines spare parts central warehouse based on METRIC. Computational Intelligence and Neuroscience, 2021(1): 4737700. https://doi.org/10.1155/2021/4737700
[18] Gallego-García, S., Gejo-García, J., García-García, M. (2021). Development of a maintenance and spare parts distribution model for increasing aircraft efficiency. Applied Sciences, 11(3): 1333. https://doi.org/10.3390/app11031333
[19] Lucht, T., Alieksieiev, V., Kämpfer, T., Nyhuis, P. (2022). Spare parts demand forecasting in maintenance, repair & overhaul. In 3rd Conference on Production Systems and Logistics, Hannover, pp. 525-534. https://doi.org/10.15488/12179
[20] Abid, S., Mhada, F.Z. (2021). Simulation optimisation methods applied in reverse logistics: A systematic review. International Journal of Sustainable Engineering, 14(6): 1463-1483. https://doi.org/10.1080/19397038.2021.2003470
[21] Rodrigues, L.R., Yoneyama, T. (2013). Maintenance planning optimization based on PHM information and spare parts availability. Annual Conference of the PHM Society, 5(1): 2215. https://doi.org/10.36001/phmconf.2013.v5i1.2215