Achmad Fuad*![]() | Muhamad Sabri Ahmad
| Muhamad Sabri Ahmad![]() | Arifandy Mario Mamonto
| Arifandy Mario Mamonto![]()
© 2026 The authors. This article is published by IIETA and is licensed under the CC BY 4.0 license (http://creativecommons.org/licenses/by/4.0/).
OPEN ACCESS
Stock price prediction is a challenging problem due to the nonlinear and noisy nature of financial time series. This study proposes a multimodal framework for stock return prediction by integrating historical price data, news-based sentiment, and financial indicators. Unlike conventional approaches that directly predict price levels, this study formulates the problem in terms of return prediction to reduce the dominance of persistence effects. Experiments are conducted using daily stock data from 2018 to 2025 across two prediction horizons, namely short-term (t + 1) and medium-term (t + 5). The performance is evaluated using both error-based metrics and directional measures, including Directional Accuracy (DA) and Hit Ratio (HR). The results show that naive models remain highly competitive in terms of error metrics, highlighting the difficulty of outperforming simple baselines in price-level prediction. However, machine learning models, particularly ElasticNet, provide more stable directional performance. Furthermore, multimodal integration does not significantly improve prediction accuracy but contributes to directional prediction, achieving an HR exceeding 52%. These findings indicate that multimodal features capture weak but meaningful signals related to market direction. The study also identifies a feature–horizon mismatch as a key limitation, emphasizing the importance of aligning feature characteristics with prediction objectives.
stock return prediction, multimodal learning, financial time series, sentiment analysis, feature integration, Directional Accuracy, machine learning, financial forecasting
Stock price prediction remains a challenging problem due to the nonlinear, non-stationary, and noisy nature of financial time series. The dynamics of stock markets are influenced not only by historical price movements but also by company fundamentals and external information such as news and public sentiment. Traditional statistical models, including autoregressive frameworks, often fail to capture complex dependencies embedded in financial data, leading to limited predictive performance in volatile market conditions [1, 2].
To address these limitations, recent studies have increasingly adopted machine learning and hybrid approaches to enhance prediction accuracy. Hybrid models combining statistical techniques with intelligent algorithms have demonstrated improved performance by capturing both linear and nonlinear patterns in complex systems [3, 4]. In addition, data-driven modeling approaches have been widely applied in various engineering and prediction domains, highlighting their capability in handling high-dimensional and nonlinear data structures [5, 6]. These developments indicate the growing importance of hybrid and data-driven frameworks in modeling complex systems, including financial markets.
Another important advancement in time series prediction is the use of decomposition-based approaches, such as Empirical Mode Decomposition (EMD) and related techniques, which aim to reduce data complexity by separating signals into multiple components with distinct characteristics [5, 6]. These approaches enable models to focus on more stable patterns, improve learning efficiency, and mitigate the impact of noise. Despite their effectiveness, many studies still rely on integrating decomposed components into a unified predictive framework without explicitly considering the different roles of each component.
Despite these advancements, most existing studies directly integrate heterogeneous data sources-including price data, technical indicators, and fundamental variables-into a single predictive model. Such direct integration often ignores the structural differences between long-term trends and short-term fluctuations, which can degrade model interpretability and stability [4, 7, 8]. Furthermore, the inclusion of multiple financial indicators without appropriate selection mechanisms may introduce multicollinearity, reducing the robustness and reliability of the prediction model.
More recently, multimodal approaches incorporating textual information, such as financial news and sentiment analysis, have gained attention for improving predictive performance [9, 10]. While these approaches provide valuable insights into market behavior, they also increase model complexity and often require large-scale datasets and computational resources. Moreover, most multimodal models still follow a unified modeling paradigm, where all features are processed simultaneously without considering their distinct roles across different temporal components.
In this context, there is a need for a modeling framework that not only integrates multiple data sources but also preserves the structural characteristics of stock price movements. This study proposes a structure-aware multimodal hybrid model based on signal decomposition, where the stock price series is first decomposed into trend, seasonal, and residual components using Seasonal and Trend Decomposition using Loess (STL). Unlike conventional approaches, the proposed model selectively integrates multimodal information by assigning financial fundamentals and news sentiment to the trend component, while modeling short-term fluctuations separately.
The main contributions of this study are threefold. First, a structure-aware hybrid modeling framework is introduced to address the limitations of conventional multimodal integration. Second, a selective feature integration strategy is proposed to align different data modalities with their corresponding temporal roles. Third, the effectiveness of the proposed model is validated through experiments on real-world stock data spanning multiple years, demonstrating improved prediction accuracy and directional performance compared to baseline models.
2.1 Stock price prediction models
Stock price prediction has been extensively studied using statistical, machine learning, and hybrid approaches. Traditional statistical models such as autoregressive integrated moving average (ARIMA) have been widely applied due to their simplicity and interpretability. However, these models often struggle to capture nonlinear relationships and complex temporal dependencies in financial data [10, 11].
To overcome these limitations, machine learning techniques, including Random Forest and regression-based models, have been introduced to improve predictive performance. These approaches are capable of capturing nonlinear patterns and interactions among variables, leading to better performance compared to purely statistical models [11, 12]. More recently, deep learning models, particularly Long Short-Term Memory (LSTM) networks and attention-based architectures, have gained popularity for modeling sequential dependencies in stock price data [6, 8].
Despite their success, deep learning models often require large datasets, extensive parameter tuning, and high computational resources. In addition, they may suffer from overfitting and limited interpretability, which can reduce their applicability in real-world financial decision-making scenarios [8].
2.2 Decomposition-based time series modeling
Decomposition-based approaches have emerged as an effective strategy to improve time series prediction by separating complex signals into simpler components. Techniques such as EMD, Ensemble EMD (EEMD), and related methods have been widely used to decompose financial time series into intrinsic mode functions with different frequency characteristics [6, 13].
By decomposing the original signal, these methods allow predictive models to focus on more stable patterns, reducing the impact of noise and improving learning efficiency. Several studies have combined decomposition techniques with machine learning or deep learning models to enhance prediction accuracy [13, 14]. For example, hybrid models integrating decomposition with LSTM or other predictive algorithms have demonstrated improved performance in financial forecasting tasks.
However, most existing approaches treat decomposed components uniformly, applying the same modeling strategy across all components. This approach does not fully exploit the structural differences between long-term trends and short-term fluctuations, which may limit the effectiveness and interpretability of the model.
2.3 Multimodal and hybrid modeling approaches
In recent years, multimodal approaches that integrate multiple data sources, such as price data, technical indicators, financial fundamentals, and textual information, have gained increasing attention in stock price prediction [15, 16]. These approaches aim to capture a more comprehensive representation of market behavior by combining heterogeneous information sources.
Hybrid modeling techniques have also been widely explored in various domains, including engineering and control systems, where combining multiple models can improve system performance and robustness [17, 18]. Data-driven and intelligent modeling approaches have demonstrated strong capabilities in handling complex and high-dimensional datasets [19, 20].
Despite these advancements, most multimodal models adopt a unified integration strategy, where all features are combined into a single predictive framework. This approach often overlooks the asynchronous nature of different data modalities and their distinct roles in influencing stock price movements. For example, financial fundamentals typically affect long-term trends, while market sentiment influences short-term fluctuations.
Therefore, there is a growing need for hybrid modeling frameworks that not only integrate multiple data sources but also consider their structural and temporal characteristics. This motivates the development of structure-aware multimodal models that can selectively incorporate different types of information based on their relevance to specific components of the time series.
3.1 Overall framework
This study proposes a structure-aware multimodal framework for stock return prediction by integrating heterogeneous data sources, including historical price data, financial fundamentals, and news-based sentiment indicators. The overall process consists of data collection, preprocessing, feature construction, multimodal integration, model training, and evaluation.
The workflow of the proposed method is illustrated in Figure 1, which presents the complete pipeline from raw data sources to prediction outputs.

Figure 1. Proposed research framework
3.2 Data and preprocessing
Three types of datasets are utilized in this study. First, daily stock price data are collected, including open, high, low, close, and volume information from 2018 to 2025. Second, financial data are obtained from annual reports, including key indicators such as total assets, total liabilities, revenue, and net income. Third, textual data are collected through financial news scraping and transformed into sentiment indicators.
Due to differences in temporal frequency, all datasets are aligned into a unified daily time series. Missing sentiment values are treated as neutral, and financial data are forward-filled to match the daily resolution.
Financial indicators are reported at annual frequency, while stock prices and sentiment data are available daily. To align the heterogeneous temporal resolutions, financial variables were forward-filled within the corresponding reporting period. This approach preserves the latest available company condition while avoiding future information leakage. Nevertheless, this strategy may introduce temporal rigidity because financial indicators remain constant within the reporting interval. This limitation is acknowledged and discussed further in the experimental analysis section.
3.2.1 Dataset distribution
Table 1 presents the distribution of the dataset after preprocessing and STL decomposition.
Table 1. Dataset distribution
|
Dataset Split |
Number of Samples |
Period |
|
Training Set |
1171 |
2018–2022 |
|
Validation Set |
240 |
2023 |
|
Test Set |
452 |
2024–2025 |
|
Total |
1863 |
2018–2025 |
The dataset originally contained 1894 daily observations. After preprocessing, missing value handling, and STL decomposition, 1863 observations remained and were used for modeling and evaluation.
3.3 Feature construction
Feature engineering is performed to capture both temporal dependencies and multimodal characteristics. Price-based features include lagged returns, moving averages, and volatility indicators to represent short-term market dynamics.
To reduce noise in textual data, sentiment features are smoothed using rolling window aggregation. This approach enables the model to capture short-term sentiment trends rather than relying on highly volatile daily signals.
Financial data are transformed into ratio-based indicators, including return on assets (ROA), return on equity (ROE), debt-to-equity ratio (DER), and net profit margin. In addition, first-order differences of these ratios are computed to capture temporal changes in company performance.
3.4 Problem formulation
Instead of directly predicting stock price levels, this study formulates the prediction task as a stock return prediction problem. Return-based modeling is adopted to reduce the dominance of persistence effects commonly observed in financial time series.
The return at time t is defined as:
$\frac{r_{\mathrm{t}}=\left(C_{\mathrm{t}}-C_{\mathrm{t}-1}\right)}{C_{\mathrm{t}-1}}$ (1)
where,
rt denotes the stock return at time t,
Ct denotes the closing price at time t,
Ct−1 denotes the closing price at time t-1.
This formulation enables the model to focus on relative price movement rather than absolute price magnitude, making it more suitable for evaluating directional prediction capability.
3.5 Modeling approach
To improve model stability and reduce overfitting, Ridge regression is employed as the primary prediction model. Ridge regression introduces L2 regularization to stabilize coefficient estimation in high-dimensional feature spaces.
The objective function is defined as:
$J(\omega)=\sum_{i=1}^N\left(y_i-x_{\mathrm{i}}^T w\right)^2+\lambda \sum_{j=1}^p \omega_j^2$ (2)
where,
y represents the target variable,
X denotes the feature matrix,
w denotes the regression coefficients,
λ controls the regularization strength.
In addition, Random Forest is implemented as a nonlinear ensemble baseline model to evaluate multimodal learning performance.
The hyperparameter configurations used in this study are summarized in Table 2.
Table 2. Hyperparameter configuration
|
Model |
Hyperparameter |
Value |
|
Ridge Regression |
alpha (λ) |
1.0 |
|
Random Forest |
n_estimators |
200 |
|
Random Forest |
max_depth |
10 |
|
Random Forest |
min_samples_split |
5 |
|
Random Forest |
random_state |
42 |
3.6 Experimental setup
A time-based split is applied to prevent data leakage. The training set includes data up to 2022, the validation set covers 2023, and the test set includes data from 2024 to 2025.
Two prediction horizons are considered in this study: short-term (t + 1) and medium-term (t + 5). This allows the analysis of model performance under different forecasting scenarios.
3.7 Evaluation metrics
Model performance is evaluated using both error-based and directional metrics. Mean Absolute Error (MAE), Root Mean Square Error (RMSE), and Mean Absolute Percentage Error (MAPE) are used to evaluate numerical prediction accuracy.
Directional Accuracy (DA) is used to measure the correctness of predicted movement direction and is defined as:
$\mathrm{DA}=\frac{1}{N} \sum_{i=0}^n I\left(\operatorname{sign}\left(\hat{\mathrm{y}}_{\mathrm{t}}\right)=\operatorname{sign}\left(\mathrm{y}_{\mathrm{t}}\right)\right)$ (3)
$\hat{\mathrm{y}}_{\mathrm{t}}$ denotes the predicted return,
$\mathrm{y}_{\mathrm{t}}$ denotes the actual return,
I(.) is the indicator function,
N is the number of observations.
In addition, Hit Ratio (HR) is used to evaluate directional prediction performance while excluding neutral movement cases. HR measures the proportion of correctly predicted upward or downward movements relative to the total number of non-neutral observations.
3.8 Feature correlation analysis
To reduce redundancy and evaluate potential multicollinearity among multimodal features, correlation analysis was performed before model training. Pearson correlation coefficients were computed across numerical variables, including price-based indicators, sentiment features, and financial ratios. The analysis indicates that several financial indicators exhibit moderate correlation due to their derivation from similar accounting variables. However, no severe multicollinearity was observed that would significantly affect Ridge regression stability. Furthermore, the use of regularization in Ridge regression helps mitigate the impact of correlated features during parameter estimation.
3.9 Baseline models
To ensure a fair comparison, several baseline models are implemented. A naive model is used as a reference, assuming that the next price is equal to the current price. In addition, ElasticNet regression and Random Forest are employed as baseline models using price-based features. These baselines are used to evaluate whether multimodal integration provides meaningful improvements over simpler approaches.
4.1 Experimental results
The performance of the proposed models is evaluated using both error-based and directional metrics across two prediction horizons, namely short-term (t + 1) and medium-term (t + 5). The results are compared with baseline models, including a naive approach, ElasticNet regression, and Random Forest.
The results in Table 3 indicate that the ElasticNet model using price-based features achieves the best performance among the tested models, slightly outperforming the naive baseline in terms of MAE and RMSE. Specifically, the ElasticNet model achieves an MAE of 111.21 compared to 111.56 for the naive model.
Table 3. Performance comparison for the t + 1 prediction horizon
|
Model |
MAE |
RMSE |
MAPE (%) |
DA |
|
Naive Close(t) |
111.56 |
148.37 |
1.21 |
0.0819 |
|
ElasticNet - Price Only |
111.21 |
147.93 |
1.21 |
0.5111 |
|
Random Forest - Price Only |
113.41 |
151.46 |
1.24 |
0.4779 |
|
Random Forest - Price + Sentiment |
113.43 |
151.55 |
1.24 |
0.4779 |
|
Random Forest - Full Multimodal |
113.43 |
151.52 |
1.24 |
0.4823 |
However, the difference is marginal, suggesting that price persistence dominates short-term prediction. This finding is consistent with the efficient market hypothesis, where short-term price movements are difficult to predict using historical data alone.
From a directional perspective, the ElasticNet model achieves a DA of 0.511, which is higher than the naive baseline. This indicates that although the model does not significantly improve error metrics, it provides better directional signals for predicting price movement.
4.2 Medium-term prediction (t + 5)
The performance of the models for the medium-term prediction horizon (t + 5) is presented in Table 4. Unlike the short-term scenario, the gap between the naive baseline and machine learning models becomes more apparent in terms of error metrics. The naive model achieves the lowest MAE of 206.38, indicating that price persistence still plays a dominant role even at a longer prediction horizon.
Table 4. Performance comparison for the t + 5 prediction horizon
|
Model |
MAE |
RMSE |
MAPE (%) |
DA |
|
Naive Close(t) |
206.38 |
272.77 |
2.26 |
0.0649 |
|
ElasticNet - Price Only |
212.56 |
274.18 |
2.31 |
0.4966 |
|
Random Forest - Price Only |
219.48 |
284.25 |
2.40 |
0.4966 |
|
Random Forest - Price + Sentiment |
220.27 |
285.06 |
2.40 |
0.4966 |
|
Random Forest - Full Multimodal |
223.35 |
289.04 |
2.43 |
0.4989 |
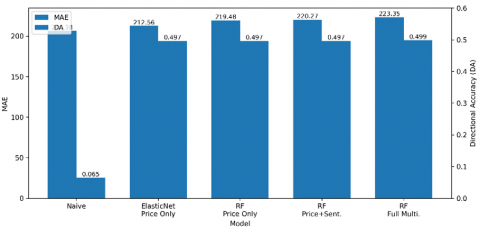
Among the machine learning models, ElasticNet with price-based features demonstrates the best performance, achieving an MAE of 212.56, followed by Random Forest-based models with slightly higher error values. The results suggest that linear models remain competitive for medium-term forecasting, while more complex models do not necessarily provide additional benefits in terms of prediction accuracy. However, when considering directional performance, a different pattern emerges. All machine learning models achieve a DA close to 0.50, indicating that they perform better than random guessing in predicting price movements. In particular, the multimodal models show slight improvements in directional performance, with the highest DA of 0.4989. Figure 2 provides a visual comparison of MAE and DA across all models for the t + 5 prediction horizon. It can be observed that although the naive model outperforms others in terms of MAE, the machine learning models maintain more stable directional performance. This suggests that while these models may not improve point prediction accuracy, they are capable of capturing partial predictive signals related to market direction. Furthermore, the results indicate that the integration of sentiment and financial features does not significantly reduce prediction error. This can be attributed to the mismatch between feature characteristics and prediction horizon. Sentiment data, which are highly volatile and noisy, may not provide stable signals for medium-term forecasting. Similarly, financial fundamentals, which are updated at a low frequency, may not sufficiently reflect short-term market dynamics.
Overall, the findings highlight that for medium-term prediction, simple models based on price dynamics remain highly competitive in terms of accuracy, while multimodal approaches offer limited improvements primarily in directional performance rather than absolute error reduction.
Figure 2. Comparison of Mean Absolute Error (MAE) and Directional Accuracy (DA) comparison
4.3 Effect of multimodal features
The effect of multimodal feature integration is further analyzed through an ablation study, as presented in Table 5. The comparison focuses on models that incorporate price data, sentiment information, and financial indicators.
Table 5. Ablation study results comparing different feature combinations
|
Model |
Feature Set |
MAE |
DA |
Hit Ratio (HR) |
|
Ridge - Enhanced Full |
Price + Sentiment + Fundamental |
221.98 |
0.4887 |
0.5230 |
|
Random Forest - Enhanced Full |
Price + Sentiment + Fundamental |
223.45 |
0.4887 |
0.5230 |
The results indicate that the inclusion of additional modalities does not significantly improve error-based metrics such as MAE. In fact, the multimodal models exhibit slightly higher MAE values compared to simpler price-based models. This suggests that the added features introduce noise or redundancy that may reduce the model’s ability to generalize in predicting price levels. However, a different trend is observed in directional performance. Both ridge and Random Forest multimodal models achieve an HR of approximately 0.523, indicating that more than 52% of directional predictions are correct. This performance is consistently higher than random guessing and reflects the presence of weak but meaningful predictive signals within the integrated feature space. Figure 3 illustrates the directional performance of the models in terms of DA and HR. It can be observed that while the DA values remain relatively stable across models, the HR shows a noticeable improvement for multimodal configurations. This indicates that the integration of sentiment and financial features contributes more to capturing market direction than to improving point prediction accuracy. These findings highlight an important characteristic of multimodal financial modeling. While additional data sources may not directly enhance price-level prediction due to market efficiency and noise, they can still provide incremental value in identifying directional patterns. This suggests that multimodal approaches may be more suitable for decision-support applications, such as trading signal generation, rather than precise price forecasting. Furthermore, the limited improvement in error metrics can be explained by the mismatch between feature frequency and prediction horizon. Sentiment data are inherently high-frequency and noisy, while financial data are low-frequency and slow-moving. This imbalance reduces the effectiveness of multimodal integration in short- to medium-term prediction tasks. Overall, the ablation results confirm that multimodal features contribute primarily to directional prediction capability rather than absolute error reduction, emphasizing the importance of aligning feature characteristics with the intended prediction objective.

Figure 3. Directional Accuracy (DA) and Hit Ratio (HR) multimodal comparison
Furthermore, the bootstrap confidence interval analysis confirms that the observed directional performance is statistically stable across resampled datasets. Although the improvement over random guessing remains moderate, the results indicate the presence of consistent directional information within the multimodal feature space.
4.4 Statistical stability analysis
To evaluate the robustness of directional performance, bootstrap resampling was conducted on the test predictions. A total of 1000 bootstrap iterations were performed to estimate the confidence intervals of DA and HR.
The bootstrap analysis indicates that the directional performance remains relatively stable across resampled datasets. The estimated confidence interval for HR consistently remains above random guessing, suggesting that the multimodal models capture weak but meaningful directional signals.
The detailed bootstrap confidence intervals are presented in Table 6. These findings support the interpretation that although multimodal integration does not significantly reduce prediction error, it contributes to directional consistency in stock return prediction.
Table 6. Bootstrap confidence interval analysis
|
Model |
DA Mean |
95% CI (DA) |
HR Mean |
95% CI (HR) |
|
Ridge - Enhanced Full |
0.489 |
[0.462, 0.514] |
0.523 |
[0.507, 0.541] |
|
RF - Enhanced Full |
0.489 |
[0.459, 0.516] |
0.523 |
[0.505, 0.543] |

Figure 4. Actual vs. prediction
Figure 4 presents the comparison between actual stock returns and model predictions on the test dataset. The visualization shows that the proposed models are able to capture the general movement trend despite deviations in highly volatile periods. While exact price-level prediction remains difficult, the models demonstrate the ability to follow directional patterns within the financial time series.
This behavior highlights the limitation of machine learning models in capturing high-frequency market volatility while also demonstrating their ability to model underlying trends.
4.5 Discussion
The experimental results highlight several important insights. First, the dominance of the naive baseline confirms that stock prices exhibit strong persistence, making short-term prediction highly challenging. Second, the use of return-based modeling reduces this dominance and allows for a more meaningful comparison between models.
Third, the limited improvement from multimodal features indicates a mismatch between feature frequency and prediction horizon. Specifically, sentiment data are highly volatile and noisy, while financial data are low-frequency and slow-moving. This mismatch reduces their effectiveness in short-term prediction tasks.
Finally, although the proposed multimodal approach does not outperform the naive baseline in error metrics, it demonstrates consistent directional performance improvements. This suggests that the model captures weak predictive signals that may be useful in decision-making contexts rather than direct price forecasting.
4.6 Summary of findings
In summary, the results demonstrate that:
Naive models remain highly competitive for short-term stock price prediction.
Return-based modeling provides a more appropriate framework for evaluating predictive models.
Multimodal features do not significantly improve prediction accuracy but contribute to directional prediction.
Feature–horizon mismatch is a critical factor affecting model performance.
These findings provide valuable insights for future research in multimodal financial prediction and highlight the importance of aligning feature characteristics with prediction horizons.
This study proposes a multimodal framework for stock return prediction by integrating price-based features, news sentiment, and financial indicators. The approach is evaluated across short-term (t + 1) and medium-term (t + 5) prediction horizons using both error-based and directional metrics.
The experimental results demonstrate that naive models remain highly competitive in terms of error-based metrics due to the strong persistence characteristic of stock prices. In both prediction horizons, the naive baseline achieves the lowest MAE, highlighting the inherent difficulty of outperforming simple models in price-level forecasting.
However, when the prediction task is formulated in terms of return, the dominance of the naive baseline is reduced, allowing machine learning models to provide meaningful comparative performance. In this context, ElasticNet with price-based features shows consistent and competitive results across both horizons.
The analysis of multimodal features reveals that the integration of sentiment and financial data does not significantly improve prediction accuracy. In some cases, it even introduces additional noise, leading to slightly higher error values. Nevertheless, multimodal models demonstrate consistent improvements in directional performance, as indicated by a HR exceeding 52%.
These findings suggest that while multimodal approaches may not enhance point prediction accuracy, they are capable of capturing weak but meaningful signals related to market direction. This makes them potentially useful for decision-support applications, such as trading strategies, where directional correctness is more important than exact price estimation.
Furthermore, the study identifies a feature–horizon mismatch as a key factor affecting model performance. Sentiment data, being high-frequency and noisy, and financial data, being low-frequency and slow-moving, are not fully aligned with short- to medium-term prediction tasks.
In conclusion, this study highlights the importance of selecting appropriate prediction targets and aligning feature characteristics with the prediction horizon. Future work may explore longer prediction horizons, advanced feature selection techniques, and deep learning-based multimodal architectures to further enhance predictive performance.
[1] Long, W., Gao, J., Guo, M. (2024). Comparative research on multi-source heterogeneous data fusion technologies. Procedia Computer Science, 242: 1089-1095. https://doi.org/10.1016/j.procs.2024.08.198
[2] Hyndman, R.J., Athanasopoulos, G. (2021). Forecasting: Principles and Practice (3rd ed.). OTexts: Melbourne, Australia. https://otexts.com/fpp3/.
[3] Giantsidi, S., Tarantola, C. (2025). Deep learning for financial forecasting: A review of recent trends. International Review of Economics & Finance, 104: 104719. https://doi.org/10.1016/j.iref.2025.104719
[4] Notaria, H., Shah, S., Thopte, D., Soneji, H., Bari, P., Deulkar, K. (2024). Comparative analysis of stock price prediction using time series models. In 2024 8th International Conference on Computing, Communication, Control and Automation (ICCUBEA), Pune, India, pp. 1-6. https://doi.org/10.1109/ICCUBEA61740.2024.10775112
[5] Timko, J., El Shawi, R., Tomasiello, S. (2024). Optimizing stock price forecasting: A hybrid approach using fuzziness and automated machine learning. Expert Systems with Applications, 295: 128844. https://doi.org/10.1016/j.eswa.2025.128844
[6] Lundberg, S.M., Lee, S.I. (2017). A unified approach to interpreting model predictions. Advances in neural information processing systems, 30. https://proceedings.neurips.cc/paper/2017/hash/8a20a8621978632d76c43dfd28b67767-Abstract.html.
[7] Zhu, C.Y., Tu, Y.B., Wei, Q.Y., Zang, Y., et al. (2025). Short-term power prediction of photovoltaic power station based on LSTM-XGBoost model. Solar Energy, 300: 113819. https://doi.org/10.1016/j.solener.2025.113819
[8] Zhao, Y., Chen, Z., Cao, C., Li, Y., Ying, J., Mu, J., Yang, C. (2026). Transforming machine learning strategies in quantitative stock investment: A multisource information fusion and online ensemble modeling approach for superior alpha factors. Expert Systems with Applications, 302: 130536. https://doi.org/10.1016/j.eswa.2025.130536
[9] Hu, Z., Liu, W., Bian, J., Liu, X., Liu, T.Y. (2018). Listening to chaotic whispers: A deep learning framework for news-oriented stock trend prediction. In Proceedings of the Eleventh ACM International Conference on Web Search and Data Mining, Los Angeles, California, USA, pp. 261-269. https://doi.org/10.1145/3159652.3159690
[10] Liu, Q., Hu, Y., Liu, H. (2024). Enhanced stock price prediction with optimized ensemble modeling using multi-source heterogeneous data: Integrating LSTM attention mechanism and multidimensional gray model. Journal of Industrial Information Integration, 42: 100711. https://doi.org/10.1016/j.jii.2024.100711
[11] Yuliyono, A.D., Girsang, A.S. (2019). Artificial bee colony-optimized LSTM for bitcoin price prediction. Advances in Science, Technology and Engineering Systems Journal, 4(5): 375-383. https://doi.org/10.25046/aj040549
[12] Kumar, K.S., Sree, D.I., Devi, P.Y., Pujitha, M.V. (2024). Comparative analysis of LSTM and XGBoost models for short-term bitcoin price prediction. In 2024 3rd International Conference on Applied Artificial Intelligence and Computing, Salem, India, pp. 932-939. https://doi.org/10.1109/ICAAIC60222.2024.10575848
[13] Chen, L., Fan, J. (2019). A hybrid attention-based EMD-LSTM model for financial time series prediction. In 2019 2nd International Conference on Artificial Intelligence and Big Data, Chengdu, China, pp. 113-118. https://doi.org/10.1109/ICAIBD.2019.8837038
[14] Hossain, S., Kaur, G. (2024). Stock market prediction: XGBoost and LSTM comparative analysis. In 2024 3rd International Conference on Artificial Intelligence for Internet of Things, Vellore, India, pp. 1-6. https://doi.org/10.1109/AIIoT58432.2024.10574794
[15] Ahmad, M.S., Hadiyanto, H., Sanjaya, R. (2026). Mathematical modelling of engineering problems an explainable hybrid long short-term memory and extreme gradient boosting framework for daily stock price forecasting with contextual latent features. Mathematical Modelling of Engineering Problems, 13(3): 513-520. https://doi.org/10.1109/10.18280/mmep.130306
[16] Ahmad, M.S., Hadiyanto, H., Sanjaya, R. (2026). A hybrid deep learning and tree boosting approach for BBCA stock price forecasting with SHAP explainability. JIKO (Jurnal Informatika dan Komputer), 9(1): 68-73. https://doi.org/10.33387/jiko.v9i1.11102
[17] Gülmez, B. (2023). Stock price prediction with optimized deep LSTM network with artificial rabbits optimization algorithm. Expert Systems with Applications, 227: 120346. https://doi.org/10.1016/j.eswa.2023.120346
[18] Euldji, R., Batel, N., Rebhi, R., Lorenzini, G., Jarasthitikulchai, N., Menni, Y., Ahmad, H., Ameur, H., Sudsutad, W. (2022). Optimal design and performance comparison of a combined ANFIS-PID with back stepping technique, using various meta-heuristic algorithms to solve wheeled mobile robot trajectory tracking problem. Journal Européen des Systèmes Automatisés, 55(3): 281-298. https://doi.org/10.18280/jesa.550301
[19] Arif, E., Suherman, S., Widodo, A.P. (2025). Predicting stock prices of digital banks: A machine learning approach combining historical data and social media sentiment from X. Ingenierie des Systemes d'Information, 30(3): 687-701. https://doi.org/10.18280/isi.300313
[20] Liu, Z., Su, Z., Shang, L., Sun, H., Zhao, B. (2025). An approach to stock price prediction based on improved EEMD and attention-enhanced BiLSTM. Expert Systems with Applications, 284: 127802. https://doi.org/10.1016/j.eswa.2025.127802