Endang Lestari*![]() | Muhammad Asdar
| Muhammad Asdar![]() | Indrabayu
| Indrabayu![]() | Faisal Mahmudin
| Faisal Mahmudin![]()
© 2025 The authors. This article is published by IIETA and is licensed under the CC BY 4.0 license (http://creativecommons.org/licenses/by/4.0/).
OPEN ACCESS
The growth of logistics flows in Eastern Indonesia requires efficient and adaptive port management. As a strategic distribution hub, Makassar New Port (MNP) faces challenges in optimizing the layout of its container yard (CY) to improve loading and unloading service speeds. This study evaluates and compares the operational performance of three CY layout designs using a discrete system simulation approach with Arena software. Data was obtained from observations of container handling times, historical container flow data, and vessel arrival simulations. Parameters analysed include container handling cycle time, equipment utilisation (RTG, HT, HMC), and potential operational cost efficiency. The results indicate that the layout perpendicular to the wharf (Layout 3) provides the best performance with a total cycle time of only 217 seconds per container, significantly faster than the existing and parallel layouts. This time efficiency can generate monthly operational cost savings of up to Rp 4.14 billion. Simulations also indicate an increase in CY area requirements reaching 60.83 hectares by 2032. In conclusion, an appropriate layout design significantly impacts port efficiency and long-term investment viability. Implementing these simulation results is recommended as the basis for terminal development planning at MNP.
layout design (modelling), container, Makassar New Port, economic development, Makassar City
As one of Indonesia's main port cities, Makassar strategically connects inter-island and international trade routes. The Makassar New Port is one of the main pillars of the city's economic activity and a gateway for logistics distribution in eastern Indonesia. In the context of global and regional economic development, port management efficiency is one of the key factors that can encourage a region's economic competitiveness [1, 2]. A critical aspect of port management is container layout. An optimal layout speeds up the loading and unloading process, reduces logistics costs, minimizes waiting Time, and increases operational capacity [3]. Today, challenges in port management are increasingly complex, especially with growing trade volumes and the need for efficiency [4].
The New Port of Makassar, designed to handle larger container volumes, requires innovative management strategies to overcome land constraints, optimize distribution flows, and support environmental sustainability. Container layout arrangements play a central role in realizing these objectives. Inefficient layouts can lead to congestion, delays in the distribution of goods, and increased operational costs. Therefore, a technology-based approach and careful planning are required to ensure that the New Port of Makassar can meet current and future needs.
As a city with rapid economic growth, Makassar requires a port infrastructure that can adapt to the dynamics of this development. The Port is a transit point for goods and an integral part of the city's economic ecosystem [5]. With an organized container layout, the Port can improve operational Time efficiency, support the smooth flow of goods, and positively impact other economic sectors, such as trade, manufacturing industry, and logistics services [6, 7]. In addition, innovative layouts can help reduce environmental impact [8], for example, by minimizing carbon emissions from transport vehicles and reducing noise around the Port. One relevant approach to addressing this challenge is to leverage simulation technology, such as ARENA software, which enables dynamic and realistic modeling and evaluation of various container layout scenarios.
Globally, many modern ports have adopted technology-based management systems, such as the use of terminal operating software (TOS), crane automation, and IoT-based tracking systems. The application of these technologies allows ports to manage container layouts more efficiently, optimize available space, and increase the speed of operational processes. Inspiration from these modern ports can be adapted to the management of Makassar New Port to support the city's vision as a regional logistics and trade hub.
An optimized layout can also help mitigate operational risks, such as accidents, damage to goods, or disruption to the supply chain [9]. With a data-driven approach and analysis, container layouts can be designed to maximize security, ease of access, and process efficiency [10]. For example, grouping containers by type of goods, shipping destination, or level of urgency can reduce search and transport time, thereby increasing overall port productivity. However, the implementation of this strategy is not without challenges in the model validation and verification process, the need for accurate data, and limited human resources in mastering simulation software. Therefore, it is important to develop a simulation framework tailored to the local characteristics of the New Port of Makassar and the logistics context of Eastern Indonesia.
The importance of innovation in container layout is also linked to Indonesia's growing maritime connectivity. As part of the sea toll initiative, Makassar New Port has a vital role in supporting the distribution of goods to and from remote areas. The efficiency of the Port will determine the extent to which the sea highway vision can be realized, including in terms of economic equity and reducing disparities between regions. Thus, adequate container layout arrangements not only have an impact on local efficiency but also on national economic development. Sustainability is also a significant concern in the development of port layouts. The green port concept, which integrates environmentally friendly practices in port operations, is increasingly relevant to be applied in Makassar New Port. A layout designed with sustainability principles in mind can include effective waste management, the use of renewable energy, as well as a reduced carbon footprint. This supports environmental conservation efforts and enhances the Port's image as a modern, future-orientated facility.
The primary foundation of this layout modeling aims to optimize the overall port function. With proper modeling, the New Port of Makassar can integrate more organized logistics flows, improve space usage efficiency, and minimize potential disruptions in operations. The modeling also allows the simulation of various operational scenarios so that strategic decisions can be made based on accurate and relevant data [11]. Thus, layout modeling is essential in supporting modern port management responsive to global challenges [12, 13].
Although there have been many studies using simulation for port optimization, most previous studies are still limited to large international ports or container ports in developed countries. In addition, research on container layout that considers the context of urban development, such as Makassar, is still very limited. This creates an important research gap, namely the need for container layout simulation studies specific to the context of ports in Indonesia, particularly MNP, taking into account operational characteristics and urban development directions.
This study is limited to the analysis of container layout in the MNP container yard, using the ARENA software-based simulation approach. The primary focus is on the impact of layout on service time and operational efficiency, excluding external aspects such as national port policies, financial considerations, or extensive hinterland logistics. This study also does not delve into technical construction aspects or detailed physical port design.
Based on the background and gaps identified, the research questions posed in this study are: What is the appropriate simulation model to represent the container handling system at MNP? Next, what are the alternative optimal container layout scenarios based on the simulation results using ARENA software?
Therefore, this simulation design is expected to provide an innovative container layout at the New Port of Makassar, which is a strategic step to support the city's economic development and enhance its competitiveness at the regional and international levels. By integrating technology, operational efficiency, and sustainability, this port can become a model for other port management in Indonesia.
This study uses a descriptive quantitative approach with a discrete dynamic system simulation method. The objective is to evaluate and compare the operational performance of three container yard (CY) layout design scenarios at Makassar New Port (MNP) through modelling and simulation using Arena Simulation software.
This approach enables a detailed representation of the container loading and unloading process, including container movement flows, heavy equipment utilisation, and the cycle time for containers entering and exiting the storage yard.
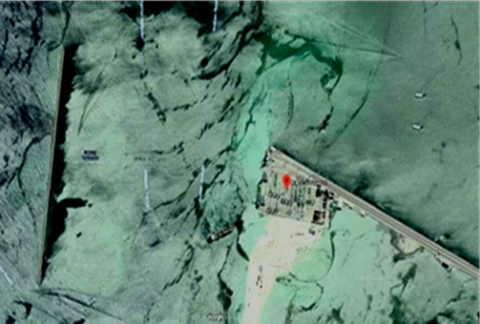
Figure 1. Research location (New Port of Makassar)
This study was conducted at Makassar New Port (MNP) in Tallo District, Makassar City, South Sulawesi, as shown in Figure 1. This location was chosen because it is the main container loading and unloading area in Eastern Indonesia and is currently undergoing strategic development in phases 1B and 1C. The study focuses on the container yard area as the centre of container handling activities. In this context, the analysis examines container flow patterns, stacking layout design, and the performance of heavy equipment such as Rubber Tyred Gantry (RTG), Head Truck (HT), and Harbour Mobile Crane (HMC) used in operational processes.
Three container yard layout models were simulated: Layout 1, the Existing layout (initial reference), Layout 2, the Parallel loading-unloading block layout, and Layout 3, the Layout perpendicular to the wharf. Each layout was modelled with identical parameters to ensure the validity of comparisons. The model structure includes entities (containers), resources (RTG, HT, HMC), and handling processes organised based on the stacking yard's loading/unloading activity stages.
The primary tool used in this study is Arena Simulation, a discrete event-based modelling and simulation platform. This software was selected for its ability to simulate complex logistics systems visually and measurably. Additionally, Microsoft Excel was used to manage data input, design random number distributions, and construct ship arrival and container flow simulations based on historical data. Research data was obtained from direct observations (particularly time studies of RTG and HT processes), internal port documentation (container flow for 2023-2024), and other secondary data from port technical reports.
The measured parameters and ARENA tools are: (1) Performance tools parameters using the resource utilisation report and entity counter; (2) Performance model using the queue statistics feature to generate average waiting time, average number, and maximum queue data; (3) Yard occupation ratio (YOR) using the variable/counter feature to calculate the number of containers currently in the yard, followed by the storage logic feature if the CY area is modelled as a block; (4) Cycle time using the entity statistics feature to calculate the total entity time; (5) Inter-arrival time distribution using the create block feature to set the distribution pattern, and the analyzer feature to convert historical data. The steps in this study began with data collection from field observations of RTG and HT working times and internal port documentation.
Then, container flow projections were made until 2032 using linear regression, which became the basis for estimating the required yard area. After that, a simulation model was developed for three layout designs using Arena Simulation, then run for 30 days of simulation with 196 vessel arrivals. The simulation output was evaluated using cycle time, equipment utilisation, and YOR parameters. Finally, a comparative analysis and estimation of operational costs were conducted for each layout scenario, leading to conclusions regarding the optimal layout to support port efficiency.
Makassar New Port (MNP) is in Tallo sub-district, Makassar City, South Sulawesi province. Geographically, the Port is located at coordinates 119º 23'40'' East to 119º 26'30'' East and 05º 05'30'' LS to 05º 06'45'' LS. Sea waters border MNP to the south, north, and west, and PT Industri Kapal Indonesia (Persero) to the East. With its strategic location, the Port is an integral part of international shipping, especially in the Australia-Indonesia Development Area (AIDA) and Brunei, Indonesia, Malaysia, Philippines East Asian Growth Area (BIMP EAGA) transport routes, as well as the Asia Pacific route. The development of MNP is planned through several stages. Phase 1A began in 2015, constructing a 320-metre-long jetty on 22 hectares of land. In phase II, scheduled for completion in 2032 development will focus on industrial and business areas. The progress of the Port's construction to date has reached 98%. MNP is expected to improve logistics flow efficiency in South Sulawesi, speed up the loading and unloading process, and encourage increased exports to attract more industrial investment to the Makassar region.
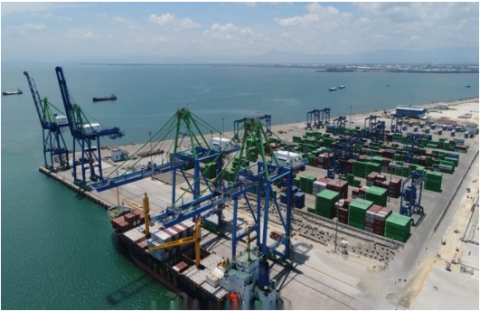
Figure 2 shows that Makassar New Port will have a 360-meter-long jetty with a container stacking capacity of up to 1.5 million TEUs annually. One of the superior technologies in this Port is the secure pile quay system with the boring method. This technology not only saves Time and costs but also offers better quality. This system is only applied in two places, namely Liverpool and Makassar New Port. The Port will also be connected to the Trans Sulawesi railway network and integrated with the Bonded Zone logistics center. To project future container requirements, container flow data from 2023 to 2024 was used as the basis for the calculation. The projection of container flows until 2032 was carried out using the linear regression method. Based on the calculations, the equations obtained can be seen in Table 1 below.
Figure 2. Physical progress of Makassar New Port, March 2024
Table 1. Recapitulation of accumulated field area requirements at the diamond terminal from 2023-2032
|
Year |
Currently Chest Pack (TEU's) |
A (m²) |
A (ha) |
|
2023 |
505,623 |
49,938.07 |
49.94 |
|
2024 |
517,879 |
51,148.49 |
51.15 |
|
2025 |
530,134 |
52,358.91 |
52.36 |
|
2026 |
542,390 |
53,569.33 |
53.57 |
|
2027 |
554,645 |
54,779.75 |
54.78 |
|
2028 |
566,901 |
55,990.17 |
55.99 |
|
2029 |
579,156 |
57,200.59 |
57.20 |
|
2030 |
591,412 |
58,411.01 |
58.41 |
|
2031 |
603,667 |
59,621.43 |
59.62 |
|
2032 |
615,923 |
60,831.85 |
60.83 |
Based on the results of linear regression calculations on container traffic data for 2023-2024, a projection of container traffic up to 2032 was obtained, amounting to 615,923 TEUs. Referring to the yard space requirement formula that considers dwelling time, space per TEU, and broken stowage, the estimated container yard space requirement for 2032 is 60.83 hectares. This increase reflects the urgency of optimising the layout design of the stacking yard to maintain long-term operational efficiency.
3.1 Container yard layout simulation results
The following are the designs and results of the container layout simulation created in three simulations. From the three simulations, further analysis was conducted using descriptive statistics for each layout.
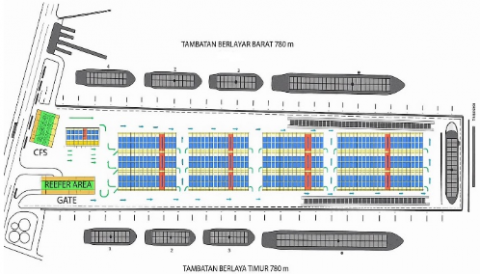
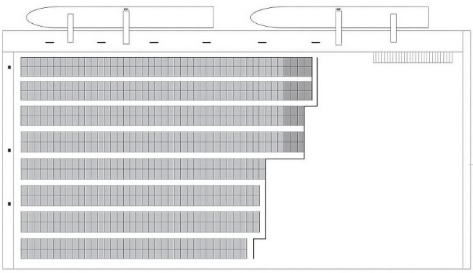
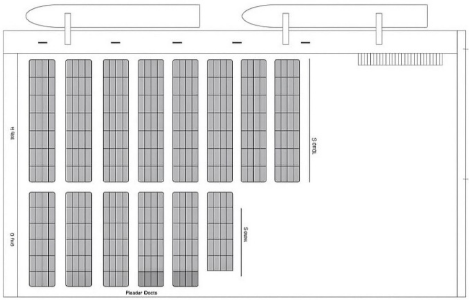
Figure 3(a) is a layout of existing conditions at the container port of Makassar. Figure 3(b) is Layout 2, which is designed as parallel container blocks separated between loading and unloading blocks or export and unloading blocks. The loading and unloading blocks are located in Blocks A to D, while the unloading blocks are located in Blocks E to H. There is also a Reference Block, which is a block that accommodates special containers, such as containers containing foodstuffs that require further handling. Meanwhile, Figure 3(c) shows a perpendicular layout by rotating the parallel layout perpendicular to the dock.
Figure 3. (a) Layout 1 (existing) plan Makassar New Port container yard; (b) Layout 2; (c) Layout 3
3.2 Randomised simulation number for arrival vessels
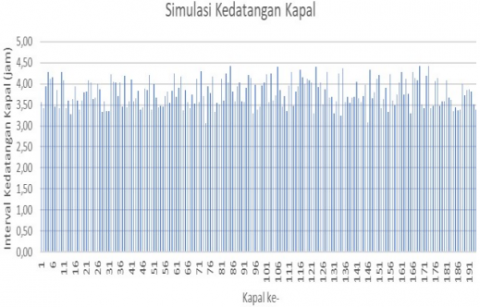
Simulations are carried out by reviewing ship arrival data during the previous four years and conducting simulations. A total of 196 boats were obtained for ships arriving during one month, with a maximum interval between ships of .43 hours. This simulation uses the Excel formula = rand ( ) by limiting it according to the previous ship arrival interval data. The results of the simulation can be seen in Figures 4-6.
Figure 4. Ship arrival simulation results ship arrival simulation results
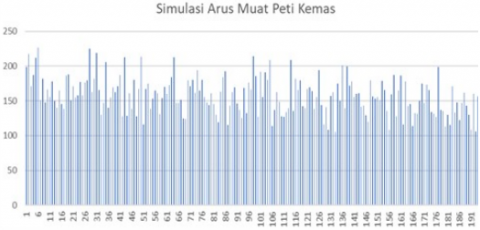
Figure 5. Simulation results of current container load
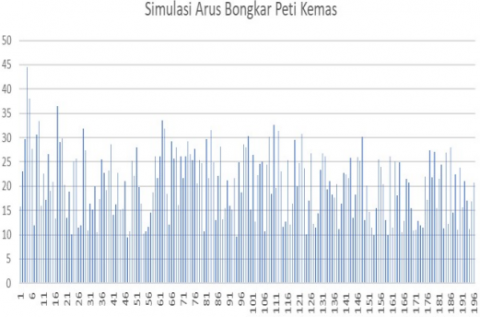
Figure 6. Simulation results of container loading and unloading flow
The simulation was conducted by reviewing ship arrival data from the previous four years and simulating ship arrivals for one month, resulting in a total of 196 ship arrivals with a maximum interval between ships of 4.43 hours. This simulation used the Excel formula = rand () with limits based on the previous ship arrival interval data. The following are the simulation results with random number generation for the loading process in one month with 196 ship arrivals. From the results obtained, the data variance is 532.522, the average number of containers is 207, and the standard deviation is 22.88. From the simulation results for the unloading process, the data obtained show a variance of 601,412, an average of 191 containers, and a standard deviation of 24.52.
3.3 Comparison of three layout designs
Simulation using ARENA was conducted for three yard layout packages. Layout 1 (existing), Layout 2 (parallel blocks), and Layout 3 (perpendicular to the dock). The simulation results produced cycle times as shown in Tables 2-4 below.
Table 2. Summary of handling time per layout
|
Proses |
Layout 1 |
Layout 2 |
Layout 3 |
|
Move to Headtruck location |
15 |
50 |
11 |
|
Vertical spreader down |
13 |
20 |
11 |
|
Twistlock lock |
24 |
24 |
24 |
|
Vertical spreader movement |
20 |
30 |
20 |
|
Horizontal spreader movement |
14 |
66 |
14 |
|
Twistlock release |
16 |
16 |
16 |
|
Return to original position |
26 |
70 |
16 |
|
Total entry time |
127 |
276 |
112 |
|
Total exit time |
122 |
162 |
105 |
Table 3. Time cycle per layout
|
Layout |
Total Entry Time (Seconds) |
Total Exit Time (Seconds) |
Total Cycle |
|
Layout 1 |
127 |
122 |
249 |
|
Layout 2 |
276 |
162 |
438 |
|
Layout 3 |
112 |
105 |
217 |
Table 4. Cycle time statistics per layout
|
|
Total Entry Time (Seconds) |
Total Exit Time (Seconds) |
Total Cycle |
|
count |
3 |
3 |
3 |
|
mean |
171.67 |
129.67 |
301.33 |
|
std |
90.67 |
29.26 |
119.43 |
|
min |
112 |
105 |
217 |
|
25% |
119.5 |
113.5 |
233 |
|
50% |
127 |
122 |
249 |
|
75% |
201.5 |
142 |
343.5 |
|
max |
276 |
162 |
438 |
|
Range (Maks-Min) |
164 |
57 |
221 |
Table 2 provides a summary table of handling times per process for each layout, showing the duration (in seconds) of each stage of container entry and exit handling, including the total processing time.
Table 3 shows the total cycle time per layout, input time, output time, and total cycle time (combination of both) for Layouts 1, 2, and 3. The simulation results indicate that Layout 3 provides the fastest total cycle time for handling, at 217 seconds or 3 minutes 37 seconds per container. Conversely, Layout 2 shows the longest time, reaching 438 seconds (7 minutes 18 seconds), indicating significantly lower efficiency. The cycle time difference between layouts reaches 221 seconds, indicating significant efficiency potential through proper layout design.
Table 4 presents descriptive statistics for the container handling cycle time of the three container yard layout designs. The first average total cycle time is 301.33 seconds (5 minutes 1 second), the fastest layout is Layout 3 with a total cycle time of 217 seconds (3 minutes 37 seconds), and the slowest layout is Layout 2 with a total cycle time of 438 seconds (7 minutes 18 seconds). The difference (range) between layouts indicates an efficiency difference of 221 seconds, or nearly 3 minutes and 41 seconds, between the extreme scenarios.
Statistically, the average cycle time of the three layouts is 301.33 seconds, with a standard deviation of 119.43 seconds. This indicates high variation between layout scenarios and a strong influence of physical design on container service speed. Layout 3 has the lowest time, while Layout 2 shows extreme deviation from the average.
The results of the ship arrival simulation for one month showed a total of 196 arrivals with a maximum interval of 4.43 hours. Using the random number generation approach, an average of 207 loaded and 191 unloaded containers per ship was obtained, with a deviation of around 22–24 containers. This simulation forms the basis for calculating the daily operational load for each yard block.
Furthermore, the simulation of the proportion of containers entering the storage yard shows that an average of 75% of loaded container flows and 11% of unloaded container flows will be processed through the yard, with the remainder processed through truck loss. This information reinforces the assumption of the need for efficient space and time management in the yard area.
3.4 Economic impact and benefit-cost estimates
For the economic impact estimation analysis and cost-benefit analysis, the researcher used general operational cost data per minute of Rp 25,000 (combined RTG, HT, and HMC), because in this study, the Port Authority only provided container traffic data for 2023-2024 and did not provide data related to operational costs. Therefore, the researcher used general rules according to the 2021 Ministry of Transportation regulation.
The assumed operational cost per minute for equipment is Rp 25,000. Every 1-second reduction in cycle time will impact the entire daily container handling cycle. The port handles an average of 1,500 containers per day.
Time difference between Layout 2 and Layout 3:
438–217 = 221 seconds = 3.68 minutes
Time savings per day:
3.68 minutes × 180 = 662.4 minutes
Operational cost savings per day:
662.4 × Rp 25,000 = Rp 16.560.000
Monthly savings (30 days):
Rp 16.560.000 × 30 = Rp 496.800.000
Thus, the implementation of Layout 3 has the potential to deliver operational efficiency of approximately Rp 496 million per month, solely through cycle time optimization without additional heavy equipment costs.
The maximum and minimum times are obtained from 2 cranes used for the container loading and unloading in one month for 196 ship arrivals at Makassar New Port. The maximum time service on day 3 in Block N has a total handling time of 717 minutes 33 seconds or 11 hours 57 minutes, and the current maximum total chest pack in Block M on day 3 has 339 containers. The minimum Time obtained is the time service on day 9 in block P with a total time of 501 minutes 43 seconds or 8 hours 21 minutes with a total flow of inbound and outbound containers of 177 containers.
Makassar New Port (MNP) is one of the strategic ports in Indonesia, playing an essential role in supporting logistics efficiency in South Sulawesi and the surrounding region [14, 15]. Based on projections, MNP is designed to accommodate significant growth in container flows until 2032, with estimates reaching 615,923 TEUs. This reflects the need for adequate infrastructure to handle the increased logistics volume efficiently [16]. Using linear regression methods in these projections demonstrates a systematic data-driven approach, supporting decision-making in developing the Port [17, 18]. Using superior technology, such as the secure pile quay system with the tedious method, MNP is one of the most efficient modern ports [19, 20]. This technology reduces construction time and costs and improves infrastructure quality. Implementing this system, which is only applied in two locations worldwide, demonstrates a commitment to innovation and global competitiveness. In addition, MNP's integration with the Trans Sulawesi railway network and the Bonded Zone logistics center strengthens connectivity and supports smooth logistics distribution.
Regarding operations, the survey results show that container handling Time at MNP is relatively efficient. The average handling time for incoming containers is around 127 seconds, while for outgoing containers, it takes 122 seconds. This difference indicates optimization of the container entry and exit process, which can reduce waiting time. In addition, the new layout, which is designed with the parallel and perpendicular layout approach, takes into account long-term operational needs [21-23]. This design allows the separation of loading and unloading and export-import blocks and considers the optimal capacity to accommodate logistics flow growth. Container flow simulations conducted over one month provide insight into the distribution and efficiency of the loading and unloading process. With a total of 196 vessels handled, the average container flow for loading and unloading reached 207 and 191 containers, respectively, with a slight standard deviation. This variance indicates reliable operational stability. In addition, planning the stacking yard based on historical data ensures space and time efficiency, where the design of the stacking blocks supports a capacity of up to three stack levels [24, 25].
Furthermore, a more in-depth analysis of the simulation results shows that Layout 3 (perpendicular to the dock) is significantly more efficient than Layout 1 (existing) and Layout 2 (parallel blocks). The cycle time for Layout 3 is only 217 seconds per container, lower than Layout 1 (249 seconds) and Layout 2 (438 seconds). These findings support previous research, which states that terminal layout configurations, including stacking orientation and yard orientation, directly impact operational performance metrics such as cycle time and crane movement distance [26, 27]. Layout 3 reduces handling time by 221 seconds per container compared to Layout 2. With a daily volume of 180 containers, the potential operational cost savings are estimated to reach ±Rp 16.5 million per day or Rp 496 million per month.
Furthermore, other recent findings from this research related to vertical yards showed that vertical yard configurations can improve horizontal transport efficiency and overall terminal efficiency (>15% improvement) across various yard sizes [28]. Higher layout efficiency directly contributes to port throughput and vessel service speed.
Thus, the result of this study has reinforced previous findings that state that port terminal development must consider strategic layout to maximise connectivity of local and regional port networks, as well as potential throughput volume, particularly in the context of Indonesia's sea toll system [29, 30]. In addition to time and cost efficiency, Layout 3 also has the potential to reduce energy consumption and emissions due to shorter equipment movement distances and minimal idle time. The latest simulation-based approach supports this by integrating environmental factors with the operational efficiency required for modern sustainable terminals [31, 32]. Layout 3 contributes to reducing carbon emissions at MNP by minimising unproductive movements and optimising handling schedules.
Through simulations and analyses, the Makassar New Port (MNP) has demonstrated thoughtful strategic planning to address future logistics needs. The combination of modern infrastructure, advanced technology, and a data-driven approach makes MNP a leading port capable of supporting economic growth in the Asia Pacific region. By continuing to pay attention to efficiency and innovation, MNP is expected to optimally fulfill logistics needs and become a significant catalyst in increasing the global competitiveness of Makassar and South Sulawesi.
This study shows that the operational efficiency of the container yard at Makassar New Port is greatly influenced by the layout design applied. Based on simulation results using Arena software, a comparison of performance was obtained between three tested layout designs: the existing layout (Layout 1), the parallel block loading and unloading layout (Layout 2), and the perpendicular to the pier layout (Layout 3). The simulation results show that Layout 3 is the most optimal layout, with the lowest total cycle time for container handling, at only 217 seconds, compared to 249 seconds for Layout 1 and 438 seconds for Layout 2.
Statistically, the cycle time difference between Layout 3 and Layout 2 is 221 seconds per container, which, when converted to daily and monthly operational scales, results in potential operational cost savings of up to Rp 496 million per month. This confirms that layout design choices impact time efficiency and provide significant economic benefits for port operators. Additionally, this study provides projections for the required yard area up to 2032, reaching 60.83 hectares, in line with the expected growth in container traffic exceeding 615,000 TEUs. These results highlight the importance of planning layout design from the outset to ensure the container handling system can adapt to future increases in port workload.
The main findings of this study, namely the quantitative comparison between layout scenarios in the context of Indonesian ports, constitute an original contribution that is practically and academically relevant. This study confirms that a simulation-based approach can be an effective decision-making tool in port planning and operational optimisation.
Based on the results of this study, it is recommended that the managers of Makassar New Port consider implementing Layout 3 design in a phased manner in the medium-term development process to support the port's vision of being a modern and efficient logistics hub in eastern Indonesia.
[1] Taharuddin, Fitri, I., Badaruddin, Lubis, S.N. (2025). Factors influencing the opening of regional shipping routes in the Aceh region to enhance regional development and global connectivity. IOP Conference Series: Earth and Environmental Science, 1452: 012046. https://doi.org/10.1088/1755-1315/1452/1/012046
[2] Oliver, R.L. (2010). Satisfaction: A Behavioral Perspective on the Consumer: A Behavioral Perspective on the Consumer (2nd ed.). Routledge. https://doi.org/10.4324/9781315700892
[3] Roh, S., Thai, V.V., Jang, H., Yeo, G.T. (2023). The best practices of port sustainable development: A case study in Korea. Maritime Policy & Management, 50(2): 254-280. https://doi.org/10.1080/03088839.2021.1979266
[4] Putri, A.H., Johnny, M.T.S., Pratiwi, R. (2019). Studi kelayakan fungsi pelabuhan dwikora pontianak pasca beroperasinya pelabuhan kijing kabupaten mempawah. JeLAST: Jurnal Teknik Kelautan, PWK, Sipil, dan Tambang, 8(2). https://doi.org/10.26418/jelast.v8i2.48969
[5] Lestari, E. (2021). The impact of the development of Makassar new port (MNP) in supporting sea tolls. Linguistics and Culture Review, 5(S1): 1265-1275. https://doi.org/10.21744/lingcure.v5nS1.1603
[6] Fisu, A.A. (2016). Analisis dan konsep perencanaan kawasan pelabuhan kota penajam sebagai pintu gerbang kab. Penajam paser utara kalimantan timur. PENA TEKNIK: Jurnal Ilmiah Ilmu-Ilmu Teknik, 1(2): 125-136. https://doi.org/10.51557/pt_jiit.v1i2.62
[7] Hidayana, R.A., Lestari, M. (2025). Analysis of economic growth and tourism potential in Tanjung Lesung, Panimbang, Banten as a creative economy destination. International Journal of Business, Economics, and Social Development, 6(1): 126-131. https://doi.org/10.46336/ijbesd.v6i1.879
[8] Lau, H.Y., Zhao, Y. (2008). Integrated scheduling of handling equipment at automated container terminals. International Journal of Production Economics, 112(2): 665-682. https://doi.org/10.1016/j.ijpe.2007.05.015
[9] Fisu, A.A., Marzaman, L.U. (2018). Pemetaan partisipatif kampung pesisir kelurahan tallo kota makassar. To Maega: Jurnal Pengabdian Masyarakat, 1(1): 22-28. https://doi.org/10.35914/tomaega.v1i1.70
[10] Agustina, I.F., Octaviani, R. (2016). Analisis dampak sosial dan ekonomi kebijakan pengembangan kawasan mix use di Kecamatan Jabon. (JKMP) Jurnal Kebijakan Dan Manajemen Publik, 4(2): 151-168. https://doi.org/10.21070/jkmp.v4i2.682
[11] Firmansyah, M., Kusumastanto, T., Mulyati, H. (2020). Economic development analysis for improving port throughput and regional economic growth in East Java province, Indonesia. Journal of Critical Reviews, 7(9): 316-322. https://doi.org/10.31838/jcr.07.09.69
[12] Gambardella, L.M., Rizzoli, A.E., Zaffalon, M. (1998). Simulation and planning of an intermodal container terminal. Simulation, 71(2): 107-116. https://doi.org/10.1177/003754979807100205
[13] Castilla-Rodríguez, I., Expósito-Izquierdo, C., Melián-Batista, B., Aguilar, R.M, Moreno-Vega, J.M. (2020). Simulation-optimization for the management of the transshipment operations at maritime container terminals. Expert Systems with Applications, 139: 112852. https://doi.org/10.1016/j.eswa.2019.112852
[14] Defrianto, S.B., Purwasih, R. (2023). Analisa kinerja bongkar muat di terminal petikemas makassar new port. Riset Sains dan Teknologi Kelautan, 67-74. https://doi.org/10.62012/sensistek.v6i1.24251
[15] Pratiwi, R. (2019). Evaluasi kinerja pelayanan kapal di pelabuhan makassar. Doctoral dissertation, Universitas Hasanuddin. https://repository.unhas.ac.id/id/eprint/6454/.
[16] Kasim, A.M.R., Wicaksono, A.D., Kurniawan, E.B. (2017). The integration level of public transportation in Makassar City. IOP Conference Series: Earth and Environmental Science, 70(1): 012021. https://doi.org/10.1088/1755-1315/70/1/012021
[17] Wibowo, P.E., Lasse, D.A., Toelle, S. (2019). Kinerja pelabuhan konvensional di makassar. Jurnal Manajemen Transportasi & Logistik, 6(3): 289-298. https://doi.org/10.25292/j.mtl.v6i3.345
[18] Ningrat, A., Adisasmita, S.A., Aly, S.H., Hustim, M. (2023). Evaluasi indikator kinerja pelabuhan hijau: Studi kasus pelabuhan makassar. Berkala Forum Studi Transportasi antar Perguruan Tinggi, 1(2): 392-401. https://repository.unhas.ac.id/id/eprint/36484/2/D013191014_disertasi_14-05-2024%201-2.pdf.
[19] Jinca, M.Y. (2009). Keterpaduan sistem jaringan antar moda transportasi di pulau sulawesi. Jurnal Transportasi, 9(1): 141879. https://doi.org/10.26593/jt.v9i1.341.%p
[20] Muswar, H.S., Satria, A. (2015). Dampak pelabelan ramah lingkungan (Ecolabelling) perikanan bagi nelayan ikan hias. Sodality: Jurnal Sosiologi Pedesaan, 5(3): 273-296. https://doi.org/10.22500/sodality.v5i3.9693
[21] Damayanti, R., Chairunnisa, A.S., Manapa, E.S. (2023). Analysis of operational service performance of Terminal II New Makassar Container Port. Zona Laut Jurnal Inovasi Sains Dan Teknologi Kelautan, 4(3): 227-232. https://doi.org/10.62012/zl.v4i3.27785
[22] Jusman, N., Ashury, A., Palippui, H. (2021). Kinerja pelayanan operasional bongkar muat dengan pendekatan balanced scorecard di makassar new port. Riset Sains dan Teknologi Kelautan, 7-12. https://doi.org/10.62012/sensistek.v4i1.19366
[23] Gani, M. (2021). Prosedur pelayanan labuh tambat kapal di DLKR dan DLKP pelabuhan makassar oleh otoritas pelabuhan utama makassar. Seminar Nasional Sinergitas Multidisiplin Ilmu Pengetahuan dan Teknologi, 4: 52-59.
[24] Abu-Aisha, T., Ouhimmou, M., Paquet, M. (2021). A simulation approach towards a sustainable and efficient container terminal layout design. Journal of International Maritime Safety, Environmental Affairs, and Shipping, 5(4): 147-160. https://doi.org/10.1080/25725084.2021.1982636
[25] Abu Aisha, T., Ouhimmou, M., Paquet, M., Montecinos, J. (2022). Developing the seaport container terminal layout to enhance efficiency of the intermodal transportation system and port operations–Case of the Port of Montreal. Maritime Policy & Management, 49(2): 181-198. https://doi.org/10.1080/03088839.2021.1875140
[26] Vera-Carrasco, C., Palma, C.D., Muñoz-Herrera, S. (2025). From efficiency to safety: A simulation-based framework for evaluating empty-container terminal layouts. Journal of Marine Science and Engineering, 13(8): 1424. https://doi.org/10.3390/jmse13081424
[27] Rodrigue, J.P. (2025). A systemic analysis of container terminal layouts. Journal of Shipping and Trade, 10(1): 4. https://doi.org/10.1186/s41072-025-00194-3
[28] Zhang, X., Gu, Y., Yang, Y., Liu, B. (2023). Comparing the efficiency of two types of yard layout in container terminals. Sustainability, 15(9): 7195. https://doi.org/10.3390/su15097195
[29] Riaventin, V.N., Cahyo, S.D., Singgih, I.K. (2021). A model for developing existing ports considering economic impact and network connectivity. Sustainability, 13(7): 3705. https://doi.org/10.3390/su13073705
[30] Xu, B., Wang, H., Li, J. (2023). Evaluation of operation cost and energy consumption of ports: Comparative study on different container terminal layouts. Simulation Modelling Practice and Theory, 127: 102792. https://doi.org/10.1016/j.simpat.2023.102792
[31] Benghalia, A., Ferdjallah, A., Oudani, M., Boukachour, J. (2025). Machine learning and simulation for efficiency and sustainability in container terminals. Sustainability, 17(7): 2927. https://doi.org/10.3390/su17072927
[32] Carboni, A., Deflorio, F., Caballini, C., Cangelosi, S. (2024). Advances in terminal management: Simulation of vehicle traffic in container terminals. Maritime Economics & Logistics, 1-25. https://doi.org/10.1057/s41278-024-00300-5