Safwan Assaf Hamoodi![]() | Ali Nathem Hamoodi*
| Ali Nathem Hamoodi*![]() | Bashar Mohammed Salih
| Bashar Mohammed Salih![]() | Muna Hassan Hussien
| Muna Hassan Hussien![]()
© 2025 The authors. This article is published by IIETA and is licensed under the CC BY 4.0 license (http://creativecommons.org/licenses/by/4.0/).
OPEN ACCESS
This article focused on the performance of a grid connected solar photovoltaic (PV) system working under varying irradiance and temperature. Solar PV power fluctuates with changes in these two factors. The evaluation involved data acquisition from simulated grid connected PV array, grid, and load sides. Simulation results showed that the proposed system has been effective in boosting the load and was carried out the first time under constant temperature and the second time under constant irradiance. Finally, the modeling results showed a close match of the energy saved during August with one of the real stations on the ground with the same design capacity.
voltage source inverter (VSI), photovoltaic, maximum power point tracking (MPPT), grid-tie inverter
Moving toward non-conventional energy sources like solar and wind energy systems can help reduce greenhouse gas emissions. The most promising, accessible, and pollution-free renewable energy source is solar energy. Solar energy is a major source of electricity generation. The solar system converts sunlight directly into electrical power using PV modules made of semiconducting materials. PV arrays may generate energy that is safe, reliable, maintenance-free, and environmentally benign [1]. This PV generation system has a low conversion efficiency for producing electrical power. The capacity of solar arrays to generate electricity is constantly changing due to climate change, as is the power output they generate. By switching to alternative energy sources like solar and wind power, greenhouse gas emissions can be decreased even further [2]. Solar energy is by far the most practical, plentiful, and eco-friendly renewable energy source. PV systems that feed electricity into the grid are currently receiving more and more attention thanks to a number of government incentives. Better evaluation of grid-connected systems' fault-tolerant performance and power quality is required as they develop and grow [3]. Various power transform topologies exist, consisting of two stages (DC-DC), (DC-AC), and single stage (DC-AC) configurations, as well as designs with or without transformers. In a two-stage conversion model, high-frequency switching occurs in both stages. The first stage typically involves a DC-DC chopper that adjusts the input voltage to a different level, and the second stage, an inverter converts DC power into AC power [4]. This system functions effectively as long as sufficient sunlight is available during the day to recharge the batteries for nighttime use. stand-alone PV systems are self-sustaining, operating independently from the utility grid, and are commonly used in remote or rural areas. In contrast, grid connected PV systems are integrated with the electrical grid, supplying excess generated power back to the utility network [5]. A grid connected PV system, often expressed on to as grid-tied or on-grid allows solar panels to generate electricity that may exceed immediate consumption. This surplus energy can either be stored in batteries or, more commonly in grid connected setups, feed back to the utility grid. In such systems, energy dynamically spouts between the PV array and the grid, adjusting based on solar availability and real-time power demand [6]. This work presents a detailed, for each part of simulation model grid connected solar power system.
The schematic diagram in Figure 1 depicts the fundamental architecture of a grid-tied PV installation. The solar panels perform the primary function of converting sunlight into electrical energy. System performance is enhanced by a maximum power point tracking (MPPT) controller employing the Perturb and Observe (P&O) technique to maintain optimal power extraction. A boosting DC-DC converter ensures sufficient voltage elevation to surpass grid peak requirements, while the subsequent inversion stage, comprising a DC-AC converter and current regulation module, produces grid-compliant alternating current suitable for seamless integration [7].
Figure 1. Schematic diagram of grid connected solar PV system
Designed to work in conjunction with the public electricity grid.
- Direct proportionality: increasing irradiance led to increase output power. More sunlight will give more photons hitting PV array.
- Power: output power represented the product of voltage with current, where the current depended on the irradiance, therefore overall power of PV array increases directly with higher irradiance.
- Performance under varying irradiance: sunny days (clear) that means high irradiance, PV array performs closed to their rated capacity. Maximum power generation produced when sun is high and perpendicular on the PV array and give optimal conditions for energy.
bin Hairi et al. [8] described the design of three phase inverter and simulated it with Matlab environment. Simulation, results of phase locked loop (PLL) showed that when inverter phase angle equals to grid phase angle the error at phase detector output equal zero, this design carried out to feed 1kW power to the grid. DC supply was connected to the inverter therefore no effect of irradiance on the output.
Liu et al. [9] applied sliding mode control (SMC) method onto two stages PV off grid and on grid inverter to adjust the follow of maximum power point (MPP). They have been concluded that this technique succeeded in the tracking and give power to the grid.
Pachauri et al. [10] used the fractional order (FO) control method to manage the flow of power between standalone loads, PV, and the utility grid level under erratic system conditions and operational conditions. They adjusted the FO controller using the evaporation rate-based water cycle algorithm (ERWCA). The performance of 2-level (VSI) is improved by combining FO control with model free predictive control.
A 350 kW solar PV system is considered small-scale distributed generation which is located behind the meter this size of plant always installed with the buildings any excess power of building capacity is exported at the local distribution grid, through a process called PV and grid powers monitoring panel. This plant is connected to a lower voltage line.
Large-scale plant is considered centralized generation; it connected directly to the high voltage transmission line on at the major substation. The generated power is transmitted over long distance to feed many buildings across a big region where all power is fed directly to the grid.
Solar panels (PV array), a DC-DC boost converter, an MPPT controller, a grid-synchronized inverter with current regulation, power transmission lines, the utility grid connection, and the electrical load are some of the essential parts of a grid-tied solar power system [11].
5.1 Modeling of PV array
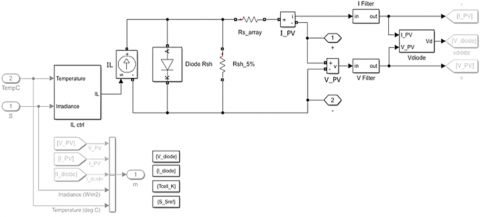
PV modules function as solar-to-electrical energy converters that generate environmentally benign DC power when illuminated. These devices consist of interconnected PV cells that can be arranged in series to increase voltage or in parallel to boost current [12]. The research model features a 350 kW array composed of 910 modules arranged in 130 parallel branches, with each branch containing 7 series connected modules to achieve the desired voltage and current characteristics. The PV array subsystem depicted in Figure 2 employs a comprehensive mathematical representation that captures the nonlinear current-voltage (I-V) behavior under varying environmental conditions [13].
Figure 2. PV array subsystem
5.2 Equivalent circuit of PV module
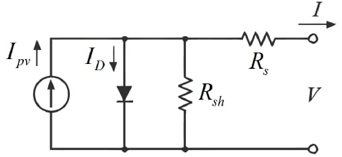
In a solar panel, several PV cells are connected in parallel and series. The way a single PV cell works is crucial to comprehend; in essence, it is a p-n junction that directly transforms solar radiation into electrical power [14]. This equivalent circuit, which is depicted in Figure 3, is made up of a series resistance $\left(R_s\right)$, a diode current $\left(I_D\right)$, a current source $\left(I_{P V}\right)$, and a shunt resistance $\left(R_{s h}\right)$ connected in parallel to the diode.
Figure 3. PV equivalent circuit
The specific performance characteristics of the SunPower SPR-415E WHT-D modules are tabulated in Table 1.
Table 1. PV module electrical data
|
Parameter |
Values |
|
Max. Power (Pm) |
414.801 W |
|
Short-circuit current (Isc) |
6.09 A |
|
Open-circuit voltage (Voc) |
85.3 V |
|
Voltage at maximum power point (Vmp) |
72.9 V |
|
Current at maximum power point (Imp) |
5.65 A |
|
Temp. coefficient of Isc (Ki) |
0.0307 |
|
Temp. coefficient of Voc (Kv) |
-0.229 |
5.3 Modeling boost converter with MPPT
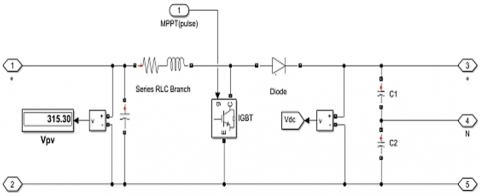
For connecting PV system to the grid, it is crucial to elevate the output voltage. This can be accomplished using a DC-DC converter, specifically a Boost converter, which increases the source voltage to a higher level. Figure 4 displays the Simulink model of the Boost converter, which consists of an input DC voltage source, filter capacitors C1 and C2, a diode, an inductor, and a controlled switch (IGBT). When the switch is in the ON position, the current flowing through the inductor increases linearly, while the diode remains OFF. Once the switch is turned OFF, the stored energy inside the inductor is released during the diode into the RC circuit. The converter output voltage is directly connected to its duty cycle [15].
The PV system must identify its MPP in order to transmit the highest amount of power under different environmental conditions because the PV module's (I-V) characteristics are non-linear. The MPPT control method, which adjusts the boost converter's duty ratio to control the PV array's output voltage level, is shown in Figure 4. The perturb and observation methodology is utilized in this instance, although there are other ways to determine the highest power point of the PV array output [16].
5.4 Inverter current control
A power inverter converts direct current (DC) into alternating current (AC). The specific design of the inverter dictates the frequency, input voltage, output voltage, and overall power capacity. The capacity of the circuit to be driven has a significant impact on the inverter's capability. In the conversion process, static inverters don't have any moving parts [17]. The primary use of power inverters is in electrical power applications, where oscillator circuits with high currents and voltages perform the same role for electronic signals, which typically have extremely low currents and voltages.
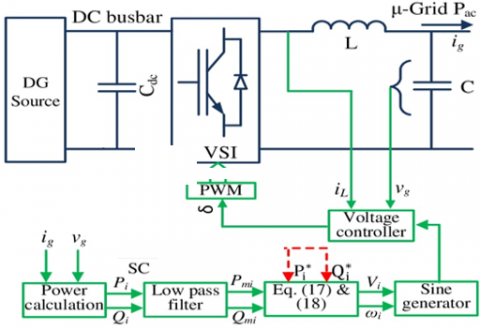
An electrical device that permits current to pass through it only in one direction, converting alternating current into direct current. IGBTs make up the inverter used in the Simulink model. IGBT is utilized because of its ability to withstand overloads [18]. The inverter and associated grid synchronization control unit are an important component of a grid connected PV system. A Phase Locked Loop (PLL) controller, which is part of the control unit, is utilized to synchronize grid connected PV system. The schematic diagram of inverter current control is seen in Figure 5. It has three arms of power switching devices that make up a three-level power inverter. Four switching devices, two neutral clamping diodes, and their antiparallel diodes make up each arm [19].
The inverter current controller consists of a Phase-Locked Loop (PLL), a current regulator, a DC voltage regulator, a Pulse Width Modulation (PWM) and a reference generator. The desired voltage is compared to the DC voltage measured by the Vdc regulator.
Figure 4. Boost converter subsystem
Figure 5. Subsystem of inverter current control
The PLL control unit uses Park's transformation to transfer voltage and current of the grid from the ABC to the $\left(d_q\right)$ reference frame. Since the grid voltage cannot be controlled, the best method to manage system performance is to regulate the direct current $\left(I_d\right)$ and the quadrature current $\left(I_q\right)$ which is supplied to the grid. Since active power depends on current $\left(I_d\right)$, must be set to zero in order to add actual power to the grid. The injection of reactive power to the grid is set to zero using the controller of current, which is an integral controller used to set $\left(I_d=0\right)$. The inverter gate pulses are produced by feeding the current controller's output into the switching pulses via a PWM generator [20, 21].
The basic operation of PLL is a continuous cycle of three steps:
- Phase detection is the process of measuring the phase difference between the PLL's output signal and the input reference signal using a phase detector, also known as a phase comparator. The electrical signal it generates is proportionate to this phase difference and is referred to as the error signal.
- Filtering: A low-pass filter receives the error signal, which may contain undesired high-frequency noise. The signal is smoothed out and transformed into a steady DC voltage by this filter, the control voltage is this.
- Frequency Adjustment: A voltage-controlled oscillator (VCO) is then fed the control voltage. The voltage given to the VCO's input determines the frequency of its output in a direct proportion. The VCO's frequency shifts due to the control voltage, bringing the PLL's output signal closer to the input reference signal in both phase and frequency. The loop is "locked" when the phase error is small and the two signals are in sync. A precise and steady output signal is now produced by the VCO.
Crucial Elements
- The phase of the input signal and the phase of the VCO's feedback signal are compared by the phase detector (PD).
Islanding and voltage sag have a significant effect on the solar PV plant performance, leading to a power generation loss, equipment risk, posing serious safety and trip offline of the system. Modern inverters are building protections to handle these processes.
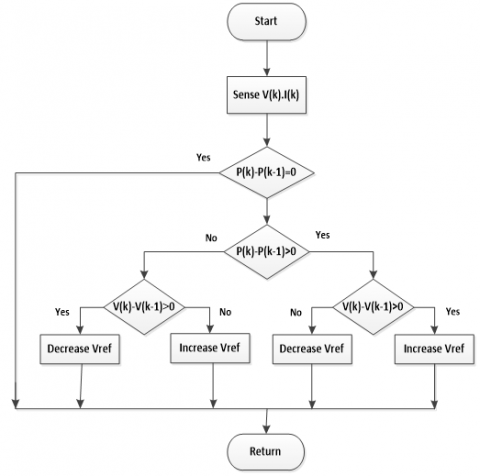
Figure 6 shows the flow chart for the (P&O) approach, in which variations in the PV (PV) array's terminal voltage impact duty cycle variations. By varying the PV array's current or voltage and comparing the prior power value P(k) with the current output power P(k+1), the PO algorithm operates on a periodic basis. The perturbation should continue in the same direction (dp/dv = 0) if a change in terminal voltage causes the power to increase; if not, it should be adjusted in the opposite way. Until the MPP arrives, this perturbation procedure is repeated.
Figure 6. The P&O algorithm flow chart
The P&O algorithm is the most popular approach due to its simplicity and ease of usage. The PV array's operational voltage is perturbed in this manner. The power charging will be regarded as the product of an array terminal voltage unquiet because the P&O algorithm is unable to contrast the output voltage of array with the real highest power point voltage. By reducing the amount of the perturbation, the oscillations in the output from this approach can be minimized [22, 23].
Both P&O and incremental conductance (IC) methods are common maximum power point tracking algorithms for 350kW solar PV plants. There are no significant differences between the two methods' performance, stability, or complexity, but the IC method outperforms the P&O method only in rapidly changing atmospheric conditions. However, the case study in this paper is based on the country, and no rapid changes occurred, so the two algorithms will yield results that are roughly the same.
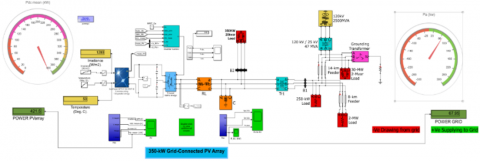
The modeling circuit consists of, solar PV array, MPPT, DC-AC inverter (grid-tie inverter), current control, phase lock loop (PLL), filter, and utility grid. The grid-connected system that was developed was evaluated using a three-phase load of 350 kW, as illustrated in Figure 7. The performance of the PV array, inverter output power, and the power exchanged with the grid were analyzed under different levels of irradiance with a remaining temperature of 25℃.
Figure 7. Modeling circuit of Simulink
Case study 1: step change irradiance with constant temperature (25℃)
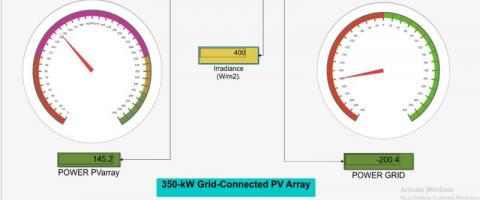
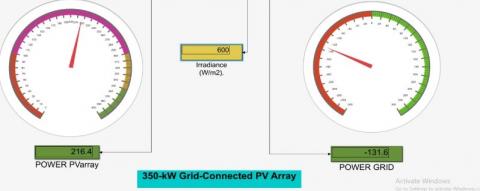
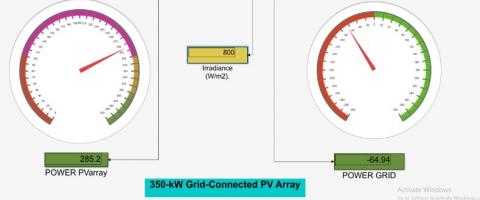
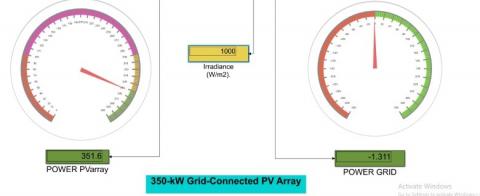
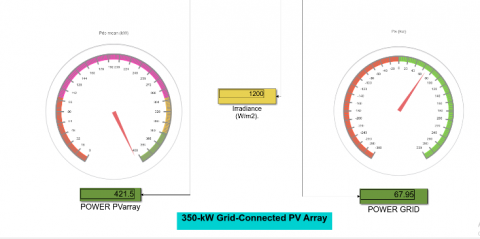
The readings of power for both PV array and grid for many irradiance states are given in Figure 8.
The readings which obtained from Figure 8 can be deduced in Table 2.
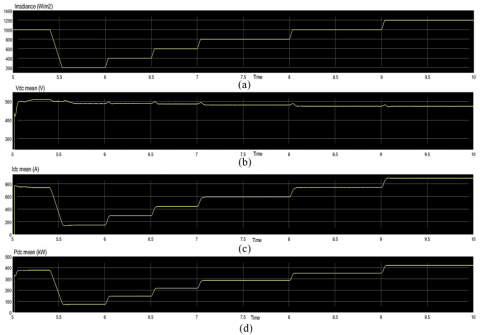
Figure 9 illustrates the readings of voltage, current and power at dc side PV array for different irradiance.
Table 2. Power readings for both PV array and grid
|
Irradiance w/m2 |
PV Array Power (W) |
Grid Power (W) |
Status |
|
200 |
72 |
275 |
-ve |
|
400 |
145 |
200 |
-ve |
|
600 |
217 |
130 |
-ve |
|
800 |
285 |
65 |
-ve |
|
1000 |
350 |
0 |
satisfaction |
|
1200 |
410 |
65 |
+ve |
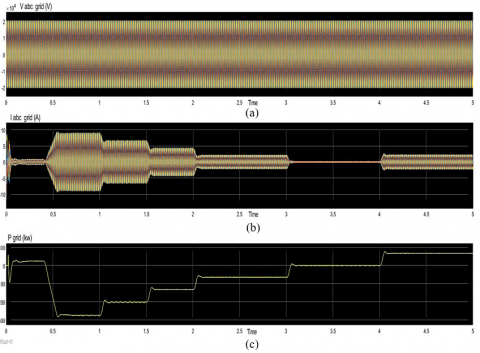
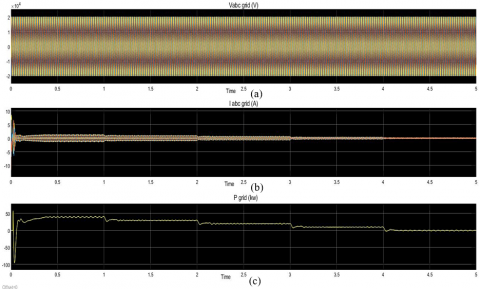
Figure 8. Sharing PV array and grid to supply the load under step change in irradiance and constant temperature
Figure 9. PV array side (a) Irradiance, (b) Voltage, (c) Current, (d) Power
From above figure, current has been affected by different values of irradiance, but the voltage remain approximately constant this is due to theorem of photon, more irradiance means more photons and increasing the current. power curve shape behavior similar to current curve shape.
Figure 10 illustrates the readings of voltage, current and power at grid for different irradiance.
Figure 10. Grid side (a) Voltage, (b) Current, (c) Power
From above figure, grid current reduces as irradiance increases, when the irradiance increased the power amount drawn from the grid was reduced; therefore, the grid current behaves inversely as Figure 9(c), and at irradiance equal to 1000W/m2, the current became zero, which means no power drawn from the grid.
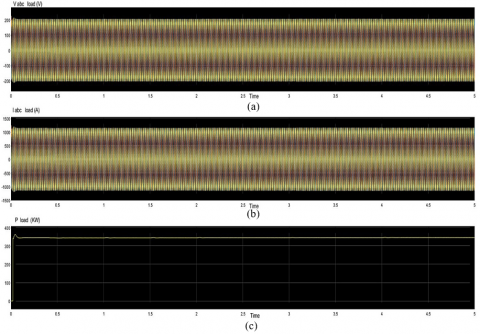
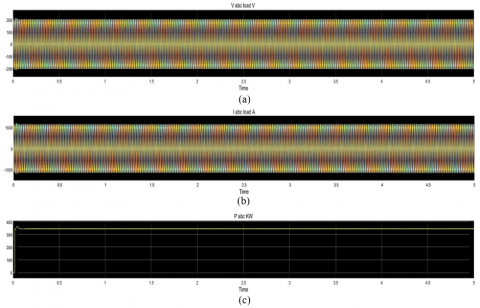
Figure 11 illustrates the readings of voltage, current and power at load for different irradiance.
Figure 11. Load side (a) Voltage, (b) Current, (c) Power
From above figure, the value of voltages and currents had rated values at load side, also the power reached the maximum value, which is due to the sharing of both PV array and grid to feed the load.
The THD values of voltage and current appeared (0.47) and (0.24), respectively.
The efficiency value for boost and inverter was (98%) and (89%), respectively.
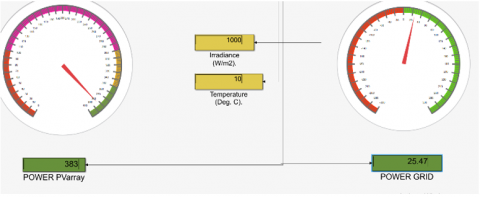
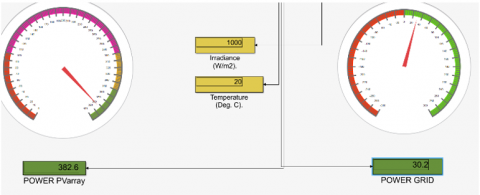
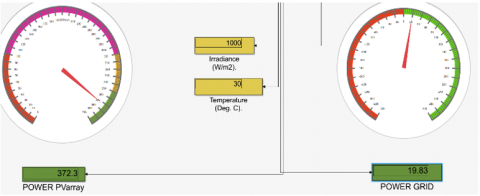
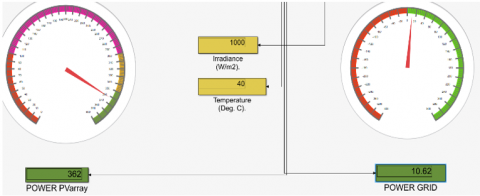
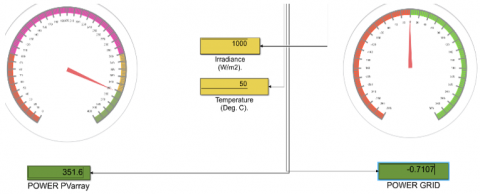
Case study 2: Step change in temperature with constant irradiance 1000W/m2
The readings of power for both the PV array and the grid for many temperature states are given in Figure 12.
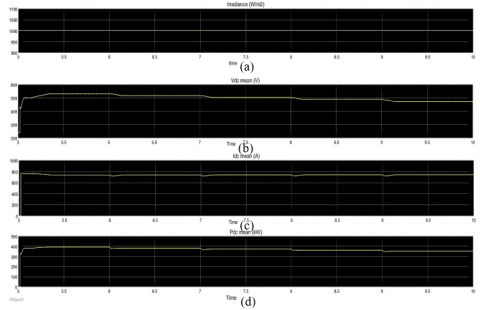
Figure 13 illustrates the readings of voltage, current, and power at DC side PV array for different temperatures.
Figure 12. Sharing PV array and grid to supply the load under step change in temperature with constant irradiance
Figure 13. PV array side (a) Irradiance, (b) Voltage, (c) Current, (d) Power
From above figure, the current has been affected by different values of temperature, but the voltage changed. The best value has been obtained between the temperature (20℃-30℃) because the standard test conditions (STC) of PV module are given at (25℃).
Figure 14 illustrates the readings of voltage, current and power at grid for different temperatures.
Figure 14. Grid side (a) Voltage(a) Current(a) Power
From above figure, grid current reduces as temperature increases, when the temperature increased the power amount drawn from the grid was reduced therefore, the grid current was reduced as comparison with Figure 13(c), and at irradiance equals to 1000W/m2 the current becomes zero which means no power is drawn from the grid.
Figure 15 illustrates the readings of voltage, current and power at load for different temperature.
Figure 15. Load side (a) Voltage, (b) Current, (c) Power
From above figure, the value of voltages and currents had rated values at load side also the power reached the maximum value this is due to the sharing of both PV array and grid to feed the load.
A comparison between the simulation results obtained in this paper and a real practical plant in Maharashtra-India has been done.
A 350kW connected solar rooftop photovoltaic (PV) power plant was set up on the rooftop of the academic block of Army Institute of Technology (AIT) at Pune, Maharashtra District, as shown in Figure 16 [24].
Figure 16. PV structure of real 350kW plant
In spite of the difference in latitude and longitude between Maharashtra and Iraq but a comparison was taken.
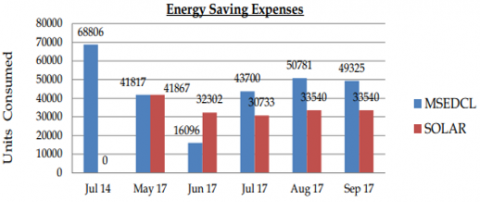
In May 2017, the irradiance and the temperature were 800W/m2 and 25℃ respectively, approximately similar to the conditions in Iraq in same month. The practical results showed that the energy saving in May 2017 was 41.867kWh as shown in Figure 17.
Figure 17. Comparative statement for energy saving in army institute of technology
From the simulation results as shown in the previous Figure 8 (Irradiance 800W/m2), where the energy saving in the grid was 235W and the Peak sun hours in Iraq (6 hours) per day in May, therefore, the energy saving per month is equal to (235 * 6 * 30) = 42.3kW.
Finally, the practical solar PV plant case study gave energy 41.867kWh, and the simulation results of solar PV plant gave 42.3kW.
A primary advantage of on-grid systems is the ability to sell excess electricity generated by the solar panels back to grid. Reducing carbon footprint by injecting clean, renewable energy into the grid. Modern on grid inverter can help regulate voltage levels in the distribution network also can provide reactive power compensation.
During periods of high electricity demand (peak hours), on grid solar system can significantly reduce the load on the grid by supplying local demand and exporting surplus power. On grid systems generally do not require expensive battery storage. This significantly reduces upfront costs and maintenance requirements.
When solar PV system is not generating enough electricity (at night, on cloudy days or during periods of high demand). The system automatically draws power from the grid to meet any deficit. Overall, on grid solar PV systems offer a compelling balance of environmental benefits, economic saving and energy reliability.
From this work, it has been found that at irradiance (200-800) W/m2 the power drawn from the grid but at irradiance 1000 W/m2 and above the power gas been supported the grid.
The power of PV array was significantly reduced when temperature increased above 25℃ because the silicone has negative effect with higher values of temperature.
We are grateful to the Technical College of Engineering at Northern Technical University in Mosul, Iraq.
[1] Faranda, R., Leva, S. (2008). A comparative study of MPPT techniques for PV Systems. In 7th WSEAS International Conference on Application of Electrical Engineering (AEE’08), Trondheim, Norway, pp. 100-105.
[2] Atiq, J., Soori, P.K. (2016). Modelling of a grid connected solar PV system using MATLAB/Simulink. International Journal of Simulation-Systems, Science & Technology, 17(41): 45.1-45.7. https://doi.org/10.5013/IJSSST.a.17.41.45
[3] Lamnadi, M., Trihi, M., Bossoufi, B., Boulezhar, A. (2016). Comparative study of IC, P&O and FLC method of MPPT algorithm for grid connected PV module. Journal of Theoretical & Applied Information Technology, 89(1): 242-253.
[4] Isen, E. (2015). Modelling and simulation of hysteresis current controlled single-phase grid-connected inverter. In Proc. 17th International Conference on Electrical and Power Engineering, Holland, pp. 322-326.
[5] Sharma, U., Dave, V. (2018). Matlab/Simulink model of two-stage, grid connected 50kw solar system. International Journal of Research and Analytical Reviews, 5(3): 596-601.
[6] Hamoodi, S.A., Hamoodi, A.N., Mohammed, R.A.N. (2024). Design and simulation of smart grid based on solar photovoltaic and wind turbine plants. Journal Européen des Systèmes Automatisés, 57(4): 953-961. https://doi.org/10.18280/jesa.570403
[7] Eltawil, M.A., Zhao, Z. (2010). Grid-connected PV power systems: Technical and potential problems-A review. Renewable and Sustainable Energy Reviews, 14(1): 112-129. https://doi.org/10.1016/j.rser.2009.07.015
[8] bin Hairi, M.H., bin Kamarudin, M.N., Zambri, M.K.B. M., Hanaffi, F., Rahman, A.A. (2019). Design and modelling of a three-phase grid connected photovoltaic for low voltage network using PSCAD software. International Journal of Electrical Engineering and Applied Sciences, 2(1): 7-12. https://core.ac.uk/download/pdf/229280668.pdf.
[9] Liu, H., Zhen, W., Chen, B., Shen, W., Dong, K., Ma, X. (2022). Sliding-mode control with two-stage photovoltaic off-grid and grid-connected inverters. In 2022 Asian Conference on Frontiers of Power and Energy (ACFPE), Chengdu, China, pp. 546-550. https://doi.org/10.1109/ACFPE56003.2022.9952208
[10] Pachauri, N., Thangavel, V., Suresh, V., Kantipudi, M.P., Kotb, H., Tripathi, R.N., Bajaj, M. (2023). A robust fractional-order control scheme for PV-penetrated grid-connected microgrid. Mathematics, 11(6): 1283. https://doi.org/10.3390/math11061283
[11] Rajani, S.V., Pandya, V.J. (2015). Simulation and comparison of perturb and observe and incremental conductance MPPT algorithms for solar energy system connected to grid. Sadhana, 40(1): 139-153. https://doi.org/10.1007/s12046-014-0312-z
[12] Salih, B.M., Hamoodi, S.A., Hamoodi, A.N. (2024). Enhancing the behavior of small-scale wind turbine based on fuzzy logic system. Journal Européen des Systèmes Automatisés, 57(1): 147-153. https://doi.org/10.18280/jesa.570115
[13] Kapurkar, K.S, and Koravi C.S. (2019). Simulation of grid integrated PV array. Journals of Digital Integrated Circuits in Electrical Devices, 4(3): 10-21. https://doi.org/10.5281/zenodo.3566211
[14] Swathi, V.V., Sekhar, G.C., Pawankumar, P.V.V. (2018). Design and simulation of 100kw grid connected solar PV system using MATLAB/Simulink. International Journal of Innovative Research in Science, Engineering and Technology (IJIRSET), 7(9): 9372-9380.
[15] Saleh, A.S., Hamoodi, S.A., Hamoodi, A.N. (2023). Optimal planning of hybrid (solar-wind) energy system using HOMER Pro. simulator. Przegląd Elektrotechniczny, 99(4): 187-191. https://doi.org/10.15199/48.2023.04.31
[16] Rahman, M.M., Hossain, M.S., Talukder, M.S.I., Uddin, M.N. (2022). Transformer less six-switch (H6) -based single-phase inverter for grid connected PV system with reduced leakage current. IEEE Transactions on Industry Applications, 58(1): 974-985. https://doi.org/10.1109/TIA.2021.3131295
[17] Tripathi, A., Sahay, K.B. (2016). Modeling & simulation of proposed grid connected 10 MW solar PV array power plant at Lucknow. In 2016 IEEE 1st International Conference on Power Electronics, Intelligent Control and Energy Systems (ICPEICES), Delhi, India, pp. 1-5. https://doi.org/10.1109/ICPEICES.2016.7853236
[18] Ropp, M.E., Gonzalez, S. (2009). Development of a MATLAB/Simulink model of a single-phase grid-connected photovoltaic system. IEEE Transactions on Energy Conversion, 24(1): 195-202. https://doi.org/10.1109/TEC.2008.2003206
[19] Jia, B., Wu, H., Li, Y. (2021). Flexible on-grid and off-grid control strategy of photovoltaic energy storage system based on VSG technology. In 2021 IEEE 5th Conference on Energy Internet and Energy System Integration (EI2), Taiyuan, China, pp. 1978-1985. https://doi.org/10.1109/EI252483.2021.9712963
[20] Hamoodi, A.N., Hamoodi, S.A., Hameedi, F.I. (2023). Enhancing the solar PV plant based on incremental optimization algorithm. Przegląd Elektrotechniczny, 99(10): 182-184. https://doi.org/10.15199/48.2023.10.35
[21] Mohammed, R.A., Hamoodi, S.A., Hamoodi, A.N. (2021). Comparison between two calculation methods for designing a stand-alone PV system according to Mosul city Basemap. Open Engineering, 11(1): 782-789. https://doi.org/10.1515/eng-2021-0075
[22] Cen, Z. (2017). Modeling and simulation for an 8 kW three-phase grid-connected photo-voltaic power system. Open Physics, 15(1): 603-612. https://doi.org/10.1515/phys-2017-0070
[23] Pattanaik, P.A., Pilli, N.K., Singh, S.K. (2015). Design, simulation & performance evaluation of three phase grid connected PV panel. In 2015 IEEE Power, Communication and Information Technology Conference (PCITC), Bhubaneswar, India, pp. 195-200. https://doi.org/10.1109/PCITC.2015.7438159
[24] Lt Col (Retd) S Karaodpati, Maya Gopakumar (2018). Analysis of 350kW grid connected solar photovoltaic rooftop power plant: A case study. International Journal of Electronics, Electrical and Computational System IJEECS. 580-586.