M. Abrar Masril*![]() | Deosa Putra Caniago
| Deosa Putra Caniago![]() | Sadiq Ardo Wibowo
| Sadiq Ardo Wibowo![]()
© 2025 The authors. This article is published by IIETA and is licensed under the CC BY 4.0 license (http://creativecommons.org/licenses/by/4.0/).
OPEN ACCESS
Batam City, the largest city in the Riau Islands Province, recorded 1,470,889 sea passengers between January and June 2022, highlighting the region’s heavy reliance on maritime transportation. Frequent ship accidents in this area emphasize the urgent need for improved passenger safety through advanced life-saving technologies. This study presents the design and testing of the Smart Ergonomic Rescue Apparel (SERA), a life jacket developed using anthropometric data and equipped with biometric sensors, LED-based early warning lights, GPS, and LoRa technology. The LoRa RFM95 module was tested for its ability to transmit location coordinates using the tracking method, while body temperature and heart rate sensors were evaluated during a 90-minute sea trial at 30℃ seawaters, with data collected every five minutes. The findings showed that RSSI values decreased as the transmission distance increased, with a maximum communication range of 11.94 km achieved at Belakang Padang Port. In addition, body temperature and heart rate gradually declined during the sea trial, confirming SERA’s ability to detect early symptoms of hypothermia. The integration of ergonomic design, biometric monitoring, and long-range communication demonstrates that SERA can enhance maritime safety by enabling real-time health and location monitoring of users during emergencies.
biometric sensors, ergonomics, hypothermia, LoRa, maritime accidents, SERA
Batam City is the largest city in the Riau Islands Province. The use of sea transportation in this city is very high, with data from the Batam City Central Statistics Agency recording 1,470,889 passengers between January and June 2022-an increase of 54% [1]. Ship accidents frequently occur in the Riau Islands region and often result in fatalities [2]. Low awareness and limited knowledge among ship owners and passengers regarding the use of life jackets can endanger safety in the event of a maritime accident [3].
Water transportation plays a vital role in the daily lives of people in Batam and the Riau Islands. With more than 1,796 islands and high ship traffic, maritime activity in the region is very dense [4]. According to data from BASARNAS, the number of maritime accidents has increased, with a total of 3,991 cases reported over the past five years [5]. One of the main causes of death in these accidents is drowning and hypothermia, which can occur due to low sea water temperatures. If not treated promptly, hypothermia can lead to loss of consciousness and death [6, 7].
Hypothermia occurs when the body loses heat faster than it can produce it, causing the core temperature to drop below 35℃ [8]. This condition is often difficult to detect in its early stages, especially during emergencies in open waters. Major challenges in rescue operations include the dispersion of victims by ocean currents and the lack of effective detection and communication tools.
To address this issue, technology capable of detecting the victim's location and monitoring their physiological condition is essential particularly for identifying early signs of hypothermia that can lead to death. A monitoring system equipped with body temperature sensors, heart rate monitors, and GPS are crucial for providing real-time information to rescue teams, enabling rapid and accurate assistance before the victim's condition worsens.
In previous research, the development of smart life jackets using GPS technology proved effective in locating maritime accident victims by transmitting real-time coordinates [9]. However, GPS technology has limitations, as it often relies on cellular communication infrastructure that may not be available in remote or offshore areas [10]. The smart life jackets developed in earlier studies also had shortcomings, as they lacked biometric sensors to detect the condition of victims at sea. Furthermore, the jacket designs did not apply an ergonomic approach to evaluate the comfort of life jackets in relation to the human body shape.
LoRa (Long Range) has been widely applied in various maritime monitoring systems [11, 12]. Its key advantage lies in its ability to transmit data over very long distances up to 10-15 kilometers in open, unobstructed areas [13, 14]. This makes LoRa particularly suitable for remote environments or large bodies of water, where conventional communication networks such as cellular infrastructure are often unavailable. The wide coverage of LoRa greatly enhances its effectiveness in remote monitoring applications [15, 16]. LoRa is commonly used wireless sensor systems that support emergency response and remote monitoring. This technology allows systems to detect environmental and physiological parameters in real time, such as temperature, light, and vital signs [17]. LoRa modules like the RFM95, when paired with STM32 microcontrollers, enable data transmission at frequencies of 868 MHz and 2.4 GHz without relying on cellular networks. This capability makes LoRa highly suitable for disaster scenarios such as wildfires, earthquakes, and even aerospace applications [18, 19].
LoRa is also a key enabling technology for the Internet of Things (IoT), categorized as a low-power wide-area network (LPWAN). It offers long-range communication, low power consumption, and high reliability. Due to these advantages, LoRa has been adopted across various sectors, including industrial IoT, smart cities, healthcare, and satellite-based communications [20-23].
The IoT connects physical devices via the internet to enable data exchange improving safety in various sectors, including maritime transportation. IoT-based monitoring systems enable real-time detection of health conditions [24-26]. Biometric sensors can measure and analyze physiological parameters such as heart rate, body temperature, and blood oxygen levels. These technologies can be implemented in maritime safety systems to quickly detect emergencies and respond effectively to life-threatening conditions [27-29].
Specifically, these sensors can detect early signs of hypothermia in maritime accident victims, serving as part of an integrated rescue system that enables faster and more targeted emergency response [30, 31].
Ergonomics plays a critical role in the design of SERA to ensure comfort, safety, and operational efficiency in field conditions. The life jacket is designed using lightweight, waterproof, and flexible materials that allow free movement. A balanced weight distribution system and the use of porous materials enhance user comfort during rescue operations. Additionally, an adaptive fastening mechanism enables automatic adjustment, ensuring the jacket fits various body sizes without compromising protection [32, 33].
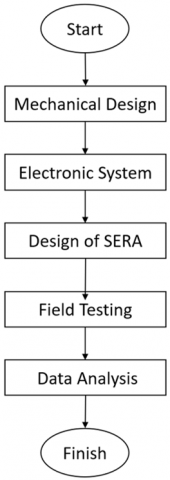
The research began with the preparation of the necessary tools and materials. Following this, the mechanical design and electronic systems were developed in a structured manner. Subsequent stages included laboratory testing to verify system functionality, followed by field testing to evaluate the device's performance under real-world conditions. Finally, data analysis was conducted to assess the effectiveness and accuracy of the developed system. The flowchart outlining the research stages is presented in Figure 1.
Figure 1. Flow chart of research stages
2.1 Mechanical design
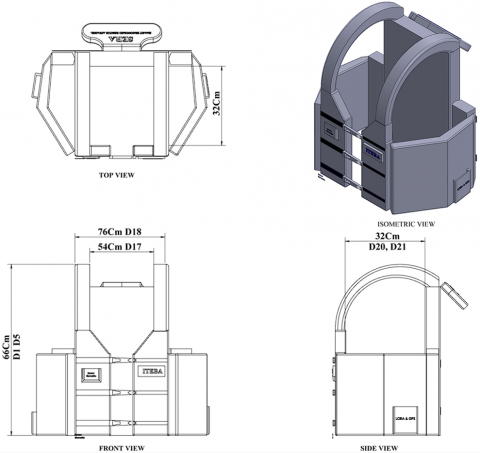
As shown in Figure 2, the design of the SERA smart life jacket is based on ergonomic and anthropometric principles, integrating technology to enhance user safety in water. Data were collected from 30 respondents by measuring parameters such as height, hip height, shoulder width, chest thickness, and abdominal thickness. The mean and standard deviation of each dimension were used to determine the upper and lower control limits, as well as to validate data consistency and adequacy. Based on the 95th percentile calculation, the ideal product dimensions were determined: a life jacket length of 66 cm (calculated from the difference between body height and hip height), shoulder width of 54 cm, upper shoulder width of 76 cm, chest thickness of 32 cm, and abdominal thickness of 33 cm. These calculations ensure that the product design can accommodate the majority of the target users’ body postures, specifically fishermen and SAR personnel in the Riau Islands region.
Figure 2. Design of SERA
In addition to anthropometric considerations, the SERA design incorporates various technology-based functional components to support rescue operations. Key features include biometric sensors for monitoring heart rate and body temperature, an early warning system utilizing visual alerts (LED lights), and emergency signal transmission via energy-efficient LoRa technology. The design also incorporates waterproof materials and thermal insulation, a modular system for ease of maintenance, and a battery power source with a minimum operating time of 8-12 hours. All components are tested in simulated marine environments, including exposure to low temperatures and saltwater. This approach ensures that SERA is not only designed for the physical comfort and safety of users but also functions as a smart system capable of providing adaptive responses during emergency situations at sea [34].
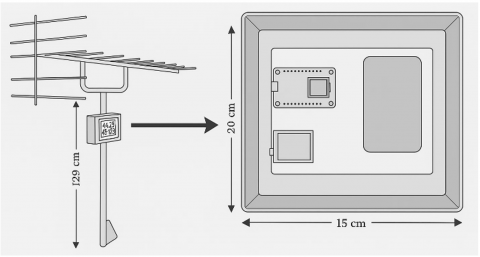
The design of the buoy system using LoRa technology includes a flotation device that forms a crucial part of the overall system. The electronic components are housed inside a waterproof enclosure, specifically a DS-AG-0813 junction box measuring 130 mm × 80 mm × 70 mm. This junction box is IP66 certified, ensuring water resistance. The receiving station consists of two main components: the receiving antenna and the electronics enclosure. The electronics box uses a larger junction box measuring 220 mm × 150 mm × 70 mm and is equipped with rubber grommets for cable entry. These grommets facilitate the installation of the antenna cables while preventing water ingress. The design of the receiving station is illustrated in Figure 3.
Figure 3. Receiver station design
2.2 Electronical design
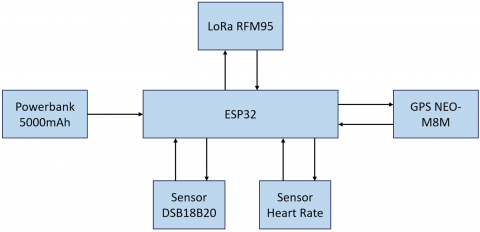
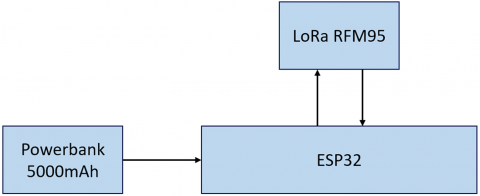
Figure 4 illustrates the working process of the LoRa Sender device, which is designed to wirelessly transmit sensor data in a LoRa-based smart buoy system. The ESP32 microcontroller functions as the central control unit, coordinating all modules within the system. It manages communication between components and handles the processing and transmission of data from the connected sensors.
Figure 4. Elektronical sender design
The NEO-M8M GPS module is used to obtain real-time location coordinates. This location data is crucial for tracking the device's position in field applications, especially during remote rescue operations. The coordinate data, along with readings from the DS18B20 temperature sensor and heart rate sensor, is processed by the ESP32 and then transmitted using the LoRa RFM95 module to a ground-based receiving station. A 3 dBi antenna is employed to enhance the transmission and reception range of the LoRa signal, ensuring stable communication even over long distances.
To ensure autonomous and portable operation in the field, the system is powered by a 5000 mAh power bank as its main energy source. The use of a power bank allows the device to remain active for extended periods without relying on a fixed power supply. With the integration of all these components, the LoRa Sender device is capable of efficiently supporting real-time monitoring and tracking during rescue operations.
The electronic system at the receiving station is designed to receive and manage location data from smart buoy devices. The ESP32 microcontroller functions as the central control unit of the system. In addition to coordinating communication between modules, the ESP32 is connected to the internet via a Wi-Fi connection, allowing real-time data transmission to servers or monitoring applications.
The system uses an RFM95 LoRa module to receive coordinate data transmitted by the buoy device. To enhance signal stability and range, it is equipped with a 5-element Yagi antenna, which provides higher directional gain than conventional antennas, thereby improving signal reception from distant locations.
As its primary power source, the system utilizes a 5000 mAh power bank. This allows the receiving station to operate independently for extended periods without relying on a fixed power supply. The flow of power and data between components in this system is visually illustrated in Figure 5.
Figure 5. Elektronical receiver design
2.3 Field testing
The development team conducted field testing in July 2025 on Belakang Padang Island, Batam City. The purpose of this activity was to ensure that the smart buoy system could operate optimally under real-world field conditions. During the testing process, the team connected the buoy system to a LoRa receiver station. This station was used to receive and display real-time location data from the buoys, allowing the position of the device to be easily monitored throughout the testing period.
2.4 Data analysis
This study analyzes the SERA system to evaluate the accuracy of the DS18B20 temperature sensor and the heart rate sensor in detecting symptoms of hypothermia. Both sensors function to monitor the user's physical condition in real time. The data obtained is used to identify signs of hypothermia based on changes in body temperature and heart rate.
In addition to sensor data analysis, this study also considers the Receiver Signal Strength Indicator (RSSI) as an important parameter in wireless communication systems. RSSI is a measure of the strength of the radio signal received by the receiving station. By analyzing the RSSI value, the relative distance between the transmitting and receiving stations can be estimated.
Distance estimation using RSSI is useful for assessing the accuracy of data transmission over a given range between the sender and receiver. RSSI values are expressed in dBm as negative numbers, where values closer to 0 indicate a stronger signal. To calculate the RSSI value, Eq. (1) is used, which is based on a signal propagation model that takes into account distance and surrounding environmental conditions [35].
$\mathrm{RSSI}=10 \mathrm{n} \log 10$ (d) A (1)
$\mathrm{d}=10($RSSI-A$) / 10 \mathrm{n}$ (2)
Eq. (1) is used in this study to calculate the RSSI value based on environmental parameters and communication distance. In this equation, n represents the path loss exponent, d is the communication distance in meters, and A is the reference RSSI value measured at a distance of 1 meter. These three parameters are interrelated in determining the signal strength received by the receiving device.
The equation can then be rearranged into Eq. (2), which is used to estimate the distance between the transmitter and receiver based on the measured RSSI value. By using Eq. (2), the system can estimate distances in a more practical and efficient manner. This equation serves as an important foundation in wireless communication analysis, particularly for determining the position of devices [36].
3.1 SERA design
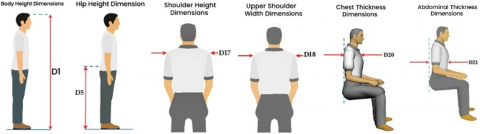
The SERA design integrates lightweight, ergonomic materials that are resistant to extreme environmental conditions. SERA is equipped with smart biometric sensors to monitor body temperature and pulse for early detection of hypothermia, as well as a GPS module for real-time location tracking. Based on the SERA design specifications, the product dimensions are as shown in Figure 6 [37].
Figure 6. Anthropometric dimensions of the human body
The ergonomic dimensions of SERA are determined based on user requirements, as presented in Table 1 [38].
Table 1. Dimensions of SERA
|
No. |
Dimensions |
Description |
|
1 |
Height (D1) |
To determine the length of SERA |
|
2 |
Hip Height (D5) |
To determine the length of SERA |
|
3 |
Shoulder width (D17) |
To determine the ideal width of the SERA shoulder |
|
4 |
Upper shoulder width (D18) |
To determine the width of the upper shoulder of SERA |
|
5 |
Chest thickness (D20) |
To determine the ideal chest thickness |
|
6 |
Thickness of the stomach (D21) |
To determine the ideal thickness of the abdomen |
The data in this study were analyzed using a precision level of 5% and a confidence level of 95%. Therefore, the data adequacy test was calculated using a value of k = 2 and s = 0.05. If N' < N, the amount of data collected is considered sufficient [39]. Conversely, if N' > N, the amount of data collected is considered insufficient. The formula used for the data adequacy test is as follows:
$N^{\prime}=\left[\frac{\frac{k}{s} \sqrt{N\left(\sum x^2\right)-\left(\sum x\right)^2}}{\sum x}\right]^2$ (3)
The determination of the upper control limit (UCL) and lower control limit (LCL) was carried out using a 95% confidence level, resulting in a K value of 2.
$\mathrm{UCL}=\mathrm{X}^{-}+\mathrm{k} \sigma$ (4)
$L C L=X^{-}-k \sigma$ (5)
$\begin{gathered}\mathrm{BKA}=\mathrm{X}^{-}+\mathrm{k} \sigma=188+2(1.77)=191.42 \\ \mathrm{BKB}=\mathrm{X}^{-}-\mathrm{k} \sigma=188-2(1.77)=184.32\end{gathered}$
The analysis results indicate that all measurement data D1, D5, D17, D18, D20, and D21 exhibit uniform characteristics and satisfy the adequacy criteria, as presented in Table 2.
Table 2. Measuring data adequacy and uniformity
|
No. |
Measurement |
Uniformity |
Sufficiency |
|
1 |
D1 |
Uniform |
Sufficient |
|
2 |
D5 |
Uniform |
Sufficient |
|
3 |
D17 |
Uniform |
Sufficient |
|
4 |
D18 |
Uniform |
Sufficient |
|
5 |
D20 |
Uniform |
Sufficient |
|
6 |
D21 |
Uniform |
Sufficient |
The anthropometric data were obtained from body dimension measurements of 30 respondents, consisting of traditional fishermen, Search and Rescue (SAR) personnel, and marine medical staff, using the 5th, 50th, and 95th percentiles as shown in Table 3 [40].
Table 3. Respondents and roles
|
No. |
Respondent Groups |
Role in Research |
|
1 |
Traditional fishermen |
Primary users, validation of comfort & reliability of tools |
|
2 |
Search and Rescue Team |
Technical evaluation in emergency situations |
|
3 |
Maritime medical/paramedical personnel |
Medical validation of biometric sensors |
The calculation was performed using the formula shown in Table 4.
Table 4. Percentile calculation
|
No. |
Percentile |
Calculation |
|
1 |
1% |
$\bar{x}-2.325 x$ |
|
2 |
2.5% |
$\bar{x}-1.96 \sigma x$ |
|
3 |
5% |
$\bar{x}-1.645 \sigma x$ |
|
4 |
10% |
$\bar{x}-1.28 \sigma x$ |
|
5 |
50% |
$\bar{x}$ |
|
6 |
90% |
$\bar{x}+1.28 \sigma x$ |
|
7 |
95% |
$\bar{x}+1.645 \sigma$ |
|
8 |
97% |
$\bar{x}+1.96 \sigma x$ |
|
9 |
99% |
$\bar{x}+2.325 \sigma x$ |
The results of the anthropometric measurements for the respondents are shown in the following Table 5.
Based on the data processing results, all dimensions show a uniform distribution with a relatively small standard deviation, indicating that the data can be considered homogeneous. The minimum and maximum values of all variables are still within the control limits (BKA-BKB), which demonstrates measurement consistency. In addition, the percentile values show a balanced distribution, with P50 close to the mean, while P5 and P95 provide an overview of the range that covers the majority of the population. Therefore, this data can be used as a valid reference in determining product size to match user characteristics.
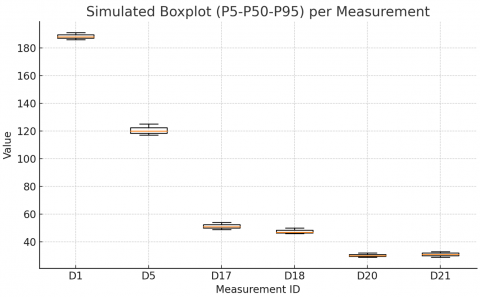
Figure 7 shows the distribution of values based on percentiles (P5, P50, and P95) of six anthropometric measurement parameters, namely D1, D5, D17, D18, D20, and D21. This visualization illustrates the data distribution, median, and dominant value ranges for each dimension used in the design.
The boxplot results indicate that each dimension has a relatively narrow data distribution, with the median (P50) consistently positioned in the middle of the P5-P95 range. Dimensions D1 and D5 have the largest absolute values because they correspond to height and hip height, while the other dimensions fall within a smaller range according to body characteristics.
Table 5. Results of anthropometric data calculations for respondents
|
No. |
Measurement |
Mean |
STDV |
Min |
Max |
BKA |
BKB |
Persentil |
||
|
P5 |
P50 |
P95 |
||||||||
|
1 |
D1 |
188 |
1.77 |
184.94 |
192.26 |
191.42 |
184.33 |
186 |
188 |
191 |
|
2 |
D5 |
120 |
2.26 |
116.78 |
124.15 |
124.71 |
115.65 |
117 |
120 |
125 |
|
3 |
D17 |
51 |
1.70 |
47.62 |
53.98 |
54.05 |
47.23 |
49 |
51 |
54 |
|
4 |
D18 |
47 |
1.20 |
45.24 |
49.62 |
49.63 |
44.83 |
46 |
47 |
50 |
|
5 |
D20 |
30 |
0.98 |
27.92 |
31.62 |
31.75 |
27.82 |
29 |
30 |
32 |
|
6 |
D21 |
31 |
1.21 |
29.17 |
33.92 |
33.81 |
28.98 |
29 |
31 |
32 |
Figure 7. Graph showing value distribution by percentiles
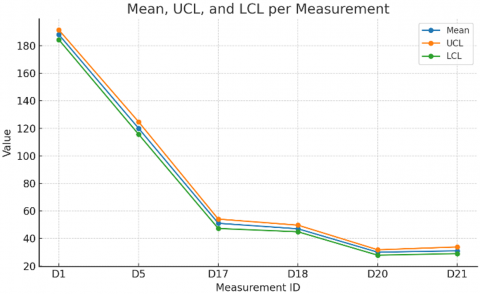
Figure 8 presents a comparison of the mean values with the upper control limit (UCL) and lower control limit (LCL) for six anthropometric measurement parameters.
Figure 8. Control chart showing mean, UCL, and LCL
Figure 8 shows that all dimensions have average values within the upper and lower control limits. This indicates that the measurement data is consistent and shows no significant deviations. Dimensions D1 and D5 have the highest values, corresponding to height and hip height, while the other dimensions are relatively smaller. The closeness between the mean line, UCL, and LCL also indicates low data variation, making the measurement results reliable as a basis for ergonomic design.
In calculating the ideal product dimensions, the 95th percentile is used, representing the average of the measured population with the aim of accommodating all body types, both large and small [41]. The data in Table 6 are used to determine the main size of the life jacket to match the user's body proportions.
Table 6. SERA measurement design based on 95th percentile ergonomics
|
No. |
Measured Data |
Description |
Size (cm) |
Description |
|
1 |
Body Height |
D1 |
191-125 = 66 |
Life jacket length (body height - hip height) |
|
2 |
Hip Height |
D5 |
||
|
3 |
Shoulder Side Width |
D17 |
54 |
Life jacket shoulder side width |
|
4 |
Upper Shoulder Width |
D18 |
76 |
Life jacket upper shoulder width |
|
5 |
Chest Thickness |
D20 |
32 |
Chest thickness |
|
6 |
Abdominal Thickness |
D21 |
32 |
Abdominal thickness |
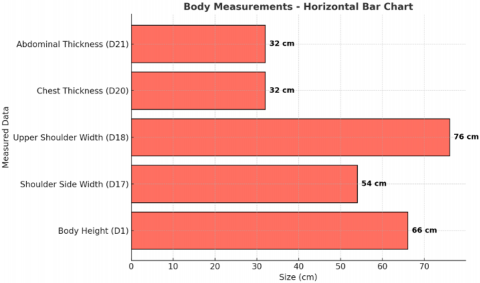
Based on the data, the length of the life jacket is determined by the difference between body height (191 cm) and hip height (125 cm), resulting in 66 cm. The side shoulder width of 54 cm is used as a reference for determining the shoulder width of the life jacket, while the upper shoulder width of 76 cm enhances the fit of the upper body. Chest thickness (32 cm) and abdominal thickness (32 cm) serve as the basis for designing ergonomic space to ensure that the life jacket does not restrict breathing or movement. Thus, all body dimensions function as important parameters in producing an ergonomic, comfortable, and functional life jacket design. Figure 9 illustrates the results of body dimension measurements relevant to life jacket design.
Figure 9. Body measurements
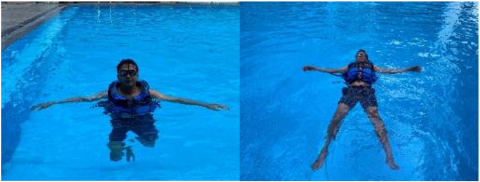
Based on testing, SERA demonstrates excellent and consistent buoyancy performance across a wide range of user weights. The only difference observed is the volume of the jacket submerged in water. For users weighing between 55 kg and 65 kg, approximately 15–20% of the jacket is submerged, while users weighing between 70 kg and 75 kg submerge approximately 25–30%. For heavier users, weighing 77 kg to 90 kg, about 35–40% of the jacket is submerged, and at 95 kg, around 45% is submerged. Despite these differences, all users remain afloat on the water’s surface and do not sink when standing, with their necks and heads consistently above the waterline. The supine position can also be maintained perfectly, demonstrating that the SERA design particularly the headrest and the placement of waterproof electronic devices is effective in ensuring user safety and stability in the water. The testing of SERA is shown in Figure 10.
Figure 10. Performance testing of sera
3.2 LoRa sender
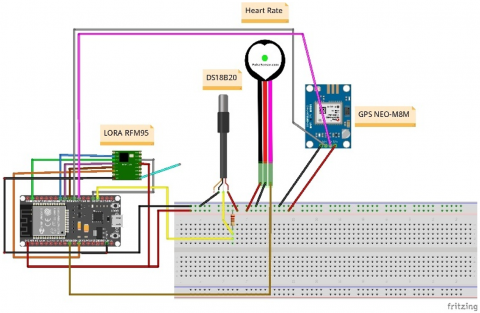
The LoRa sender circuit consists of an ESP32 microcontroller serving as the central control unit, connected to a DS18B20 temperature sensor, a heart rate sensor, and a NEO-M8M GPS module. The DS18B20 sensor measures the user's body temperature, while the heart rate sensor monitors the pulse in real time. The NEO-M8M GPS module is responsible for obtaining the user's location coordinates. All data from these three sensors is collected by the ESP32 and then transmitted wirelessly via the LoRa module to the receiver device. The LoRa sender circuit is shown in Figure 11.
Figure 11. LoRa sender
Table 7 shows the connection between the LoRa RFM95 pins and the ESP32.
Table 7. LoRa RFM95 – ESP32
|
No. |
LORA RFM95 |
ESP32 |
|
1 |
ANA |
|
|
2 |
GND |
GND |
|
3 |
3.3 V |
3.3V |
|
4 |
DIO0 |
GPIO 2 |
|
5 |
Reset |
GPIO 14 |
|
6 |
NSS |
GPIO 5 |
|
7 |
SCK |
GPIO 18 |
|
8 |
MOSI |
GPIO 23 |
|
9 |
MISO |
GPIO 19 |
Table 8 shows the pin connections between the DS18B20 sensor and the ESP32.
Table 8. DS18B20 Sensor – ESP32
|
No. |
DS18B20 |
ESP32 |
|
1 |
VCC |
3.3V |
|
2 |
Data |
GPIO 15 and 10K pull-up resistor |
|
3 |
GND |
GND |
Table 9 shows the pin connections between the heart rate sensor and the ESP32.
Table 9. Max30102 Heart Rate Pulse Sensor – ESP32
|
No. |
Sensor Heart Rate |
ESP32 |
|
1 |
VCC |
3.3V |
|
2 |
GND |
GND |
|
3 |
A0 |
GPIO 26 |
Table 10 shows the pin connections between the GPS NEO-M8M and the ESP32.
Table 10. GPS NEO- M8M – ESP32
|
No. |
NEO - M8M |
ESP32 |
|
1 |
VCC |
3.3V |
|
2 |
GND |
GND |
|
3 |
TX |
GPIO16 |
|
4 |
RX |
GPIO17 |
3.3 LoRa receiver
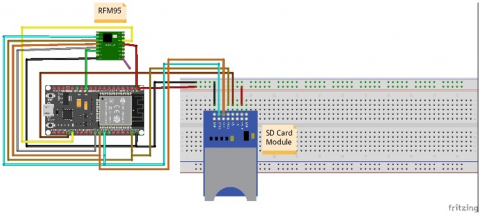
The LoRa receiver utilizes the LoRa RFM95 module and an SD card module as its main components. The LoRa RFM95 module receives measurement data from the LoRa sender, including temperature readings from the DS18B20 sensor and heart rate data from the heart rate sensor. The received data is then automatically stored by the ESP32 in the SD card module, serving as a storage medium to enable further data logging and analysis. The LoRa receiver circuit is shown in Figure 12.
Figure 12. LoRa receiver
Table 11 shows the connections between the SD card module and the ESP32.
Table 11. SD card module ESP32
|
No. |
SD Card Module |
ESP32 |
|
1 |
3.3 V |
3.3V |
|
2 |
GND |
GND |
|
3 |
CS |
GPIO 15 |
|
4 |
MOSI |
GPIO 23 |
|
5 |
CLK |
GPIO 18 |
|
6 |
MISO |
GPIO 19 |
3.4 Data analysis
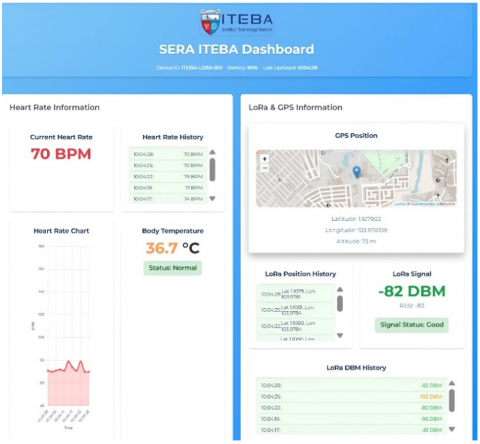
The SERA instrument transmits coordinates, RSSI values, body temperature, and heart rate data. The receiving station successfully receives these data and displays them on a webpage, as shown in Figure 13.
Figure 13. Web view of the SERA system
Testing of the DS18B20 temperature sensor and the heart rate sensor was conducted to detect symptoms of hypothermia in life jacket users. The DS18B20 sensor monitors body temperature, while the heart rate sensor records heart rate in real time. Both sensors are integrated into an ESP32-based monitoring system installed on the life jacket to detect physiological changes in the body when exposed to cold marine environments. The DS18B20 sensor operates with a sampling frequency of 1 Hz, an error margin of ±0.5℃ (range -10℃ to +85℃), and a response time of ~750 ms. Meanwhile, the heart rate sensor operates with a sampling frequency of 100 Hz, an error margin of ±2 BPM, and a response time of less than 1 second.
The testing was conducted over a 90 minutes period using a simulated marine environment scenario designed to induce a gradual decrease in body temperature. During the testing process, body temperature and heart rate data were periodically transmitted via the LoRa module to the receiving station, where the data were stored on an SD card and displayed on a web-based monitoring platform. This system enables continuous tracking of gradual decreases in body temperature and variations in heart rate, which serve as early indicators of hypothermia symptoms. Table 12 presents the measurement results obtained during the testing of the temperature and heart rate sensors.
Table 12. Testing the DS18B20 and heart rate sensors on SERA
|
Time (Minute) |
DS18B20 Body Temperature (℃) |
Heart Rate Sensor (BPM) |
|
0 |
36.8 |
78 |
|
5 |
36.78 |
78 |
|
10 |
36.75 |
79 |
|
15 |
36.73 |
79 |
|
20 |
36.7 |
79 |
|
25 |
36.67 |
78 |
|
30 |
36.62 |
78 |
|
35 |
36.6 |
77 |
|
40 |
36.58 |
77 |
|
45 |
36.52 |
77 |
|
50 |
36.49 |
76 |
|
55 |
36.4 |
76 |
|
60 |
36.38 |
75 |
|
65 |
36.33 |
75 |
|
70 |
36.3 |
75 |
|
75 |
36.29 |
72 |
|
80 |
36.25 |
72 |
|
85 |
36.16 |
72 |
|
90 |
36.05 |
71 |
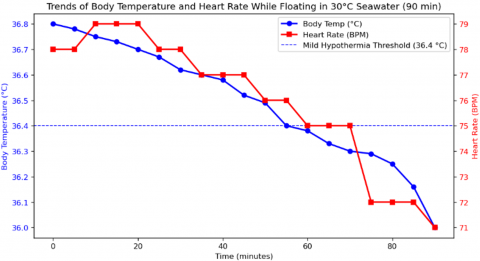
Testing was conducted on life jacket users floating in the sea waters of the Riau Islands at a temperature of 30℃ for 90 minutes, with measurements taken every five minutes [42, 43]. The DS18B20 sensor recorded body temperature, represented by a solid blue line, while the heart rate sensor recorded heart rate, represented by a solid red line. The dashed blue line indicates the threshold for mild hypothermia in the temperature range of 36℃-36.4℃ [44], while the shaded blue area represents the period when body temperature fell below 36.4°C, indicating mild hypothermia. The results showed a decrease in body temperature to 36℃, confirming the occurrence of mild hypothermia, as shown in Figure 14.
Figure 14. Measurement results of the temperature sensor and heart rate sensor
RSSI testing was conducted in open waters without obstacles using a tracking method, where coordinates and RSSI data were transmitted every minute. The researchers used the LoRa 433 MHz frequency, which is standard in the Asian region. This frequency offers advantages such as a longer signal range, better penetration through obstacles, and greater suitability for large areas such as open waters [45]. The receiving station was located at the Belakang Padang Domestic Port.
Distance determination was performed after the coordinate data was successfully received from SERA. The researchers used the website https://boulter.com/gps/distance/ to calculate distances by entering the coordinates of the receiving station and the instrument location. Measurement results are presented in metres for distance and in dBm for RSSI values. RSSI values closer to zero indicate a stronger signal, while values further from zero indicate poorer signal quality.
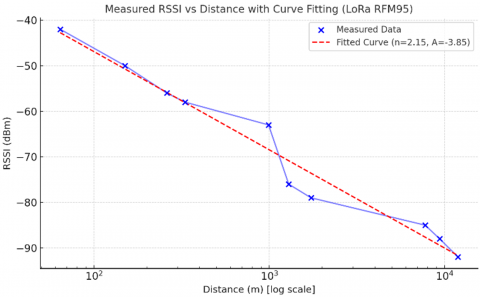
Figure 15 shows the relationship between distance and RSSI values obtained from the LoRa RFM95 test. The blue dots represent the measurement data, while the dashed red line represents the fitted curve using the log-distance path loss model. The RSSI value decreases as the distance increases, from -42 dBm at 64 meters to -92 dBm at 11,940 meters. The fitting results yield a path loss exponent of 2.15 and a reference RSSI of -3.85 dBm, indicating propagation conditions close to free space. Figure 15 demonstrates that the LoRa RFM95 can function effectively at distances of up to 11,940 meters.
Figure 15. Relation between RSSI value and distance
During testing, the highest signal strength (RSSI) was recorded at -42 dBm at a distance of 64 metres, while the lowest signal strength was -92 dBm at a distance of 11,940 metres, which was also the farthest point reached during the test. All data, including RSSI values, distances, and coordinates of the safety buoys, are presented in Table 13.
Table 13. Testing the DS18B20 and heart rate sensors on SERA
|
Starting Point |
Destination Coordinates |
Distance (m) |
RSSI (dbm) |
|
1.15579524726097, 103.89346768785762 |
1.1556519887948804, 103.89403380755512 |
64 |
-42 |
|
1.1556831382410362, 103.89478944139891 |
150 |
-50 |
|
|
1.1570416745742707, 103.89540186419498 |
260 |
-56 |
|
|
1.157312743958163, 103.89605256341584 |
330 |
-58 |
|
|
1.1647694956557653, 103.8928344556692 |
990 |
-63 |
|
|
1.1669684517564318, 103.89009860251855 |
1290 |
-76 |
|
|
1.17055868170281, 103.8883045371556 |
1730 |
-79 |
|
|
1.1701111898437184, 103.82528157160937 |
7750 |
-85 |
|
|
1.1458317743658784, 103.80976174841416 |
9380 |
-88 |
|
|
1.1426567200897284, 103.78695453789548 |
11940 |
-92 |
The SERA design used anthropometric data from 30 respondents to tailor its size to the user. Its key features include biometric sensors to monitor heart rate and body temperature, a visual early warning system using LED lights, and emergency signal transmission via LoRa technology to detect symptoms of hypothermia. In this study, the researchers equipped the LoRa-based SERA with a GPS module to obtain coordinate positions and a LoRa module to transmit collected data packets. The results showed a relationship between distance and RSSI values, where RSSI values tended to decrease or move away from 0 as the distance between the receiving station and the SERA increased. The effectiveness of this design was demonstrated by the maximum distance achieved by the LoRa module, which reached 11,940 meters (11.94 km). Furthermore, the temperature and heart rate sensors installed on the SERA proved capable of detecting symptoms of mild hypothermia, as evidenced by graphs showing a decrease in body temperature and heart rate during a 90-minute sea trial. However, this system has drawbacks, including a battery life limited to 12 hours and interface limitations, as there is no visual indicator in the form of a heat map on the website to display the user’s condition more intuitively.
[1] Badan Pusat Statistik Kota Batam. BPS Kota Batam. https://batamkota.bps.go.id/pressrelease/2022/08/02/475/perkembangan-transportasi-udara-dan-laut-kota-batam-juni-2022.html, accessed on Mar. 10, 2024.
[2] Yuniati Jannatun Naim. Basarnas TanjungPinang Tangani 38 Kasus Kecelakaan Laut Sepanjang Tahun 2022. https://kepri.antaranews.com/berita/149292/basarnas-tanjungpinang-tangani-38-kasus-kecelakaan-laut-sepanjang-tahun-2022?utm_source=chatgpt.com.
[3] Apriyani Safitri. Kapal Pompong Tenggelam di Selat Nenek Batam, 2 Penumpang Masih Dicari. https://marwahkepri.com/2025/06/26/kapal-pompong-tenggelam-di-selat-nenek-batam-2-penumpang-masih-dicari/.
[4] Putri, T.R., Puspitasari, H. Partakoesoema, Ristyandari, S. Provinsi Kepulauan Riau Dalam Angka 2024. https://kepri.bps.go.id/id/publication/2024/02/28/fd7185609074aa933a154621/provinsi-kepulauan-riau-dalam-angka-2024.html.
[5] Daksan, M. 3991 Kecelakaan Kapal Dalam 5 Tahun. https://pbsnindonesia.com/news/3991-kecelakaan-kapal-dalam-5-tahun?utm_source=chatgpt.com.
[6] van der Ploeg, G.J., Goslings, J.C., Walpoth, B.H., Bierens, J.J. (2010). Accidental hypothermia: Rewarming treatments, complications and outcomes from one university medical centre. Resuscitation, 81(11): 1550-1555. https://doi.org/10.1016/j.resuscitation.2010.05.023
[7] Guly, H. (2011). History of accidental hypothermia. Resuscitation, 82(1): 122-125. https://doi.org/10.1016/j.resuscitation.2010.09.465
[8] Paal, P., Pasquier, M., Darocha, T., Lechner, R., Kosinski, S., Wallner, B., Zafren, K., Brugger, H. (2022). Accidental hypothermia: 2021 update. International Journal of Environmental Research and Public Health, 19(1): 501. https://doi.org/10.3390/ijerph19010501
[9] Masril, M.A., Caniago, D.P., Jufri, M., Munir, Z., Aritonang, M.A.S. (2024). Sosialisasi dan bimbingan teknis penggunaan smart life jacket dalam meningkatkan keselamatan pelayaran persatuan pengemudi motor sangkut (PPMS) belakang padang. Minda Baharu, 8(2): 377-387. https://doi.org/10.33373/jmb.v8i2.6884
[10] Dinis, H., Rocha, J., Matos, T., Gonçalves, L.M., Martins, M. (2022). The challenge of long-distance over-the-air wireless links in the ocean: A survey on water-to-water and water-to-land MIoT communication. Applied Sciences, 12(13): 6439. https://doi.org/10.3390/app12136439
[11] Sánchez del Río Sáez, J., Aragonés, V., Sánchez Villaluenga, T., Davila-Gomez, L., et al. (2025). Wi-Fi/LoRa communication systems for fire and seismic-risk mitigation and health monitoring. Frontiers in Detector Science and Technology, 3: 1484647. https://doi.org/10.3389/fdest.2025.1484647
[12] Yao, F., Ding, Y., Hong, S., Yang, S.H. (2022). A survey on evolved LoRa-based communication technologies for emerging internet of things applications. International Journal of Network Dynamics and Intelligence, 1(1): 4-19. https://doi.org/10.53941/ijndi0101002
[13] Prameswari, S.O.P., Rinanto, N., Putra, Z.M.A., Pambudi, D.S.A., Adhitya, R.Y. (2024). Analisis quality of service integrasi Mqtt-Lora dengan hambatan untuk monitoring autonomous underwater vehicle. Jurnal Inovasi Global, 2(8): 1069-1082. https://doi.org/10.58344/jig.v2i8.146
[14] Arzamendia, M., Britez, D., Recalde, G., Gomez, V., Santacruz, M., Gregor, D., Gutierrez, D., Toral, S., Cuellar, F. (2021). An autonomous surface vehicle for water quality measurements in a lake using MQTT protocol. In 2021 IEEE CHILEAN Conference on Electrical, Electronics Engineering, Information and Communication Technologies (CHILECON), Valparaíso, Chile, pp. 1-5. https://doi.org/10.1109/CHILECON54041.2021.9702999
[15] Hussain, I., Deshalahre, D., Thakur, P. (2024). Assessing the effectiveness of an IoT-based healthcare monitoring and alerting system with Arduino integration. Revue d'Intelligence Artificielle, 38(4): 1211-1221. https://doi.org/10.18280/ria.380415
[16] Wirawan, I.M., Lestari, D., El Raka, S.C., Leksono, A.B., Qodri, F.A., Prasetyo, S.D. (2025). Chirpstack-based LoRAWAN platform for land-sliding monitoring system. Instrumentation, Mesure, Metrologie, 24(1): 73-79. https://doi.org/10.18280/i2m.240108
[17] Fadhil, A.A., Abdullah, F.Y., Yaseen, M.T. (2024). Design and implementation of air pollution monitoring system in Mosul City. Instrumentation, Mesure, Metrologie, 23(1): 71-77. https://doi.org/10.18280/i2m.230107
[18] Danladi, M.S., Baykara, M. (2022). Design and implementation of temperature and humidity monitoring system using LPWAN technology. Ingénierie des systèmes d'information, 27(4): 521-529. https://doi.org/10.18280/isi.270401
[19] Okokpujie, K., Okokpujie, I.P., Ogundipe, A.T., Anike, C.D., Asaboro, O.B., Vincent, A.A. (2023). Development of a sustainable internet of things-based system for monitoring cattle health and location with web and mobile application feedback. Mathematical Modelling of Engineering Problems, 10(3): 740-748. https://doi.org/10.18280/mmep.100302
[20] Gherbi, C. (2021). Internet of things and heterogeneous networks technologies: Concepts, challenges and perspectives. Ingénierie des Systèmes d’Information, 26(4): 403-408. https://doi.org/10.18280/isi.260408
[21] Muladi, Wijaya, H., Prasetyo, S.D., Hamzah, S.A., Mahamad, A.K. (2024). LoRa mesh-based IoT GPS tracking system for mountain climbers. International Journal of Safety and Security Engineering, 14(6): 1751-1761. https://doi.org/10.18280/ijsse.140610
[22] Rai Sharma, D., Raghuwanshi, R.R., Chandak, T., Ramdasi, D. (2023). LoRa-based IoT system for emergency assistance and safety in mountaineering. International Journal of Safety and Security Engineering, 13(3): 491-500. https://doi.org/10.18280/ijsse.130311
[23] Masril, M., Jalinus, N., Irfan, D. (2024). A flexible practicum model on education: Hybrid learning integrated remote laboratory activity design. International Journal of Online & Biomedical Engineering, 20(10): 4-17. https://doi.org/10.3991/ijoe.v20i10.48031
[24] Phade, G., Kingsly, S., Ohotkar, S., Gade, M., Chitre, V., Vaidya, O. (2024). Optimization of water resource management: A LoRa-based control framework for multiple pump control systems. International Journal of Environmental Impacts, 7(4): 633-640. https://doi.org/10.18280/ijei.070404
[25] Paucar-Curasma, R., Unsihuay Tovar, R.F., Villavicencio Jiménez, S.C.A., Jara Jara, N., Gonzales Agama, S.H., Quijada-Villegas, J.H. (2024). Developing IoT activities using the problem-solving method: Proposal for novice engineering students. Mathematical Modelling of Engineering Problems, 11(11): 3161-3172. https://doi.org/10.18280/mmep.111126
[26] Eliza, F., Candra, O., Mukhaiyar, R., Fadli, R., Yassin, A., Sutrisno, V.L.P., Hamid, M.A., Jauhari, M.R. (2025). IoT-based real-time carbon monoxide mitigation for MSME indoor environments. International Journal of Safety and Security Engineering, 15(2): 247-256. https://doi.org/10.18280/ijsse.150205
[27] Mohapatra, A.G., Mohanty, A., Nayak, S., Menfash, H.A., Alqahtani, H., Al-Sharaei, A.M., Allaf, R., Nafie, F.M. (2025). IoT-driven remote health monitoring system with sensor fusion enhancing immediate medical assistance in distributed settings. Alexandria Engineering Journal, 120: 627-636. https://doi.org/10.1016/j.aej.2025.02.057
[28] Sharma, D., Jain, R.K., Sharma, R., Shan, B.P., Shiney, O.J. (2023). Analysis of BPM/Pulse rate and its correlation with BMI for sprint activity using ATMega328 based Arduino Uno. Materials Today: Proceedings, 80: 3851-3856. https://doi.org/10.1016/j.matpr.2021.07.401
[29] Masril, M., Jalinus, N., Irfan, D. (2024). Hybrid learning integrated remote laboratory: A pedagogical strategy for future practicum learning. International Journal on Advanced Science, Engineering & Information Technology, 14(3): 928-935.
[30] Makoveev, S.A., Semenkova, T.N., Lochekhina, E.B., Hussain, A., Kirov, M.Y. (2022). The relationship of hypothermia and organ dysfunction in sepsis: A single-center retrospective study. Russian Journal of Anaesthesiology and Reanimatology, (4): 26-31. https://doi.org/10.17116/anaesthesiology202204126
[31] Abrar, M., Caniago, D.P., Burhan, R.A.M., Noviardi, R. (2024). Sistem monitoring kecepatan angin dan suhu udara berbasis notifikasi telegram. The Indonesian Journal of Computer Science, 13(5): 8115-8123. https://doi.org/10.33022/ijcs.v13i5.4305
[32] Bora, M.A., Putri, M.V., Dermawan, A.A., Permatasari, R.D., Larisang, Panggabean, H.R. (2024). Experimental study of adaptive jig development to facilitate metal welding learning. International Journal of Computational Methods and Experimental Measurements, 12(4): 441-451. https://doi.org/10.18280/ijcmem.120413
[33] Hanafie, A., Haslindah, A., Bora, M.A., Yusuf, R., Larisang, Sanusi, Hamid, A. (2025). Study of flexibility factors in determining the design of ergonomic urban pedestrian sidewalk facilities. International Journal of Computational Methods and Experimental Measurements, 13(1): 35-43. https://doi.org/10.18280/ijcmem.130104
[34] Mutiara, G.A., Periyadi, Meisaroh, L., Alfarisi, M.R., Yasin, W.M., Adisty, N.N., Zain, M.A.R. (2023). Integrated sensor-based smart mannequin for injury detection in armored vehicle. International Journal of Safety and Security Engineering, 13(4): 625-633. https://doi.org/10.18280/ijsse.130404
[35] Yang, K., Chen, Y., Du, W. (2025). Flog: Automated modeling of link quality for LoRa networks in orchards. ACM Transactions on Sensor Networks, 21(2): 1- 28. https://doi.org/10.1145/3718741
[36] Jani, M.M.M., Hairuddin, M.A., Ja’afar, H., Rustam, I., Almisreb, A.A., Ashar, N.D.K. (2024). Real-time IoT-Blynk application for log hive weight monitoring in stingless bees. Instrumentation Mesure Métrologie, 23(2): 93-102. https://doi.org/10.18280/i2m.230202
[37] Hutabarat, J., Pradana, J.A., Ruwana, I., Basuki, D.W.L., Sari, S.A., Septiari, R. (2023). Ergonomic chair design as a solution to musculoskeletal disorders among traditional cobblers: An anthropometric study. Journal Européen des Systèmes Automatisés, 56(4): 697-701. https://doi.org/10.18280/jesa.560419
[38] Hutabarat, J., Pradana, J.A., Achmadi, F., Basuki, D.W.L. (2022). Risk of musculoskeletal disorder in the working posture of online motorcycle drivers (case study: Drivers at Malang district). International Journal of Design & Nature and Ecodynamics, 17(6): 843-851. https://doi.org/10.18280/ijdne.170604
[39] Ahmed, B.S., Benbouzid, S., Nibouche, F. (2022). Design and implementation of smart glasses with ISMS and risk management functionalities for a technical operator. Ingénierie des Systèmes d’Information, 27(3): 415-423. https://doi.org/10.18280/isi.270307
[40] Prabaswari, A.D., Al-Bana, N.P. (2024). Product analysis of safety belt and body harness coconut sugar climber: An ergonomic, durability, and economic feasibility principle. Mathematical Modelling of Engineering Problems, 11(8): 2143-2151. https://doi.org/10.18280/mmep.110816
[41] Aisyah, S., Abbas, A., Hasibuan, A., Masri, D., Frieyadie, Fudholi, A. (2022). Ergonomic working design model in reducing fatigue due to air traffic control (ATC) at Kuala Namu airport, Indonesia. International Journal of Safety and Security Engineering, 12(4): 475-480. https://doi.org/10.18280/ijsse.120408
[42] Sudarmawan, A., Gunzales, A., Simamora, C., Sari, D.A., Ningsih, D.C., Endryansyah, E., Syarfina, E., Nahera, F.A., Siagian, F., Sirait, M.E., Simanjuntak, O.F.S. (2024). Hubungan Kepadatan Gafrarium pecinatum dengan Kualitas Perairan di Perairan Pengudang dan Perairan Dompak, Tanjungpinang Provinsi Kepulauan Riau. Populer: Jurnal Penelitian Mahasiswa, 3(2): 128-141. https://doi.org/10.58192/populer.v3i2.2304
[43] Tampubolon, A.B., Gustin, O., Chayati, S.N. (2016). Pemetaan suhu permukaan laut menggunakan citra satelit aqua MODIS di perairan Provinsi Kepulauan Riau. Jurusan teknik Informatika, Politeknik Negeri Batam. Batam.
[44] Maryani, D.S., Lestari, N.E., Istiani, H.G. (2022). Plastik polietilen dapat meningkatkan suhu tubuh pada bayi prematur yang mengalami hipotermia. Nursing Care, 8(2): 46-56.
[45] Santos, R., Santos, S. (2022). Learn ESP32 with Arduino IDE, 1st ed.