Ahmed Hadjadj*![]() | Ahmed Belkhiri
| Ahmed Belkhiri![]() | Tahar Seghier
| Tahar Seghier![]() | Ayoub Mansour Belhamiti
| Ayoub Mansour Belhamiti![]()
© 2025 The authors. This article is published by IIETA and is licensed under the CC BY 4.0 license (http://creativecommons.org/licenses/by/4.0/).
OPEN ACCESS
Transformers are essential elements of modern power networks because they assure efficient electrical distribution and transportation. They are susceptible to internal faults though, including inter-winding short circuits, which are hard to identify in real time with traditional methods such as heat monitoring and gas dissolved analysis. These flaws have the potential to seriously impair transformer performance and result in pricey system failures. For the purpose of to identify winding short-circuit defects, this research proposes a vibration analysis-based method that makes use of artificial neural networks (ANN) and the Fast Fourier Transform (FFT). This method analyses vibration frequency variations as failure indicators and uses ANN to accurately classify a variety of situations. According to results from experiments, the suggested method differentiates between normal and defective states under various load situations, enabling early and accurate fault diagnosis. The ability of the system to keep monitoring transformers without needing shutdowns boosts efficacy in functioning, lowers repair costs, and increases the power grid's overall accuracy.
artificial neural networks, electrical transformers, Fast Fourier Transform, short-circuit, vibration analysis
Modern electrical networks, which have seen considerable advancements in voltage levels, rely heavily on power transformers. Short-circuit (SC) faults between transformer windings are one of the most important operational issues that transformers now face as a result of these advancements. In addition to affecting transformer performance, these faults also have an effect on the power system's overall dependability, especially during the transmission and distribution phases. Because maintaining a dependable power supply is so important, errors in these systems can be expensive and dangerous [1].
Compared to conventional methods such as Dissolved Gas Analysis, which requires oil sampling and laboratory testing using highly sensitive and costly gas chromatograph equipment with prices ranging from approximately 30,000 USD to over 100,000 USD vibration analysis offers a faster and more practical alternative. By simply installing an accelerometer, typically costing less than 2,000 USD, and connecting it to a processing unit, it is possible to obtain continuous, real-time mechanical response data from the transformer windings. The accelerometer can remain permanently mounted on the transformer, enabling fully automated monitoring without human intervention or transformer shutdown. This capability ensures that developing faults are detected promptly, thereby reducing the risk of severe failures and minimizing operational disruptions. The objective of this study is to gain a better understanding of how new methods can improve the efficacy of fault detection methods, with an emphasis on vibration frequency analysis of transformer windings. Based on the idea that abnormal variations in the frequency and intensity of winding vibrations can act as a real-time indicator of a fault, this technique is thought to be more accurate and effective than other approaches in detecting SC faults. These vibration changes can be analysed and classified using artificial intelligence, especially artificial neural networks (ANN), based on training data and previously completed experiments. This allows for early transformer condition diagnosis before issues worsen and impact the entire electrical grid [2].
Vibrations can be an accurate indicator of transformer health, according to previous studies. For instance, in 2021, José Roberto et al. [3] studied how to measure transformer core vibrations and use a programmable FPGA matrix for signal processing in order to detect short circuits. For the analysis of data, they used support vector machines and the statistical time feature methodology. Similar to this study, Qian et al. [4] looked into vibrations brought on by winding movement and showed that load current affects vibration frequency by changing the windings inherent frequency. Additionally, they conducted free vibration tests under short-circuit load conditions to investigate the impact of clamping force on vibration intensity. A study on the definition of axial and radial vibrations and how they relate to current harmonics was published in 2023 by researchers Jiang et al. [5], they investigated this relationship using a 3D simulation model, and they checked the analysis method by conducting vibration measurements on an operational transformer. Using fiber optic sensors that measure temperature and humidity in addition to vibrations, researcher Akre et al. [6] proposed a novel way to monitor transformer winding vibrations during that period. The results showed a guarantee for monitoring transformer conditions. In a comparable fashion, Wang et al. [2] studied the consequences of abrupt external SC. Their results, which came from finite element analysis, showed how axial forces affected the winding ends and how radial forces affected the middle layer of the winding.
Multiple investigations have shown that it is possible to diagnose and monitor transformer conditions in addition to identifying SC faults in real-time without needing shutdowns. Differences in study findings have been observed, though, and numerous researchers have identified transformer design and current harmonics as major causes of the variation in data collected. Additionally, a lot of research has focused on measurement methods that take vibrations throughout the transformer structure into account [7].
Previous research has indicated that ANN can outperform other machine learning algorithms in detecting inter-turn short circuits in transformers using vibration analysis. In one comparative study, ANN, SVM, k-NN, and Random Forest were evaluated using vibration features extracted through Variational Mode Decomposition. ANN achieved the highest classification accuracy, supporting its use in the present work to model the non-linear patterns in transformer vibration data [8].
The purpose of the research is to investigate the significance of using artificial intelligence tools, specifically ANN, to diagnose and identify SC faults between transformer windings early on, fast and accurately.
2.1 Vibration transformer
Vibration signals are directly related to the mechanical and electrical performance of transformers. During operation, the transformer's core and windings produce almost all of these vibrations. The magnetostriction phenomenon, which characterises dimensional shifts in ferromagnetic materials when exposed to magnetic fields, is the primary cause of core vibrations [9, 10].
The nonlinear nature of the magnetostriction phenomenon causes larger harmonics, and the fundamental vibration frequency in the core is twice the input power system frequency. Following the reported formulation, the vibration amplitude in the core $A_{core}$ is directly proportional to the square of the applied voltage U, as shown in Eq. (1). This relationship has been experimentally validated in prior transformer vibration studies [9].
$A_{core} \propto U^2$ (1)
The forces that arise from vibrations caused by magnetostriction act opposed to the core [11]. However, winding vibrations, which consist of axial and radial components, are caused by electromagnetic forces acting on the windings as a result of an interaction between the windings' current and leakage flux density. Similarly, the primary harmonic of winding vibrations $A_{winding}$ is directly proportional to the square of the current I, assuming sinusoidal current, as shown in Eq. (2). This proportionality has been established in the literature based on the electromagnetic forces generated by the interaction between winding currents and leakage flux density [10, 11].
$A_{winding} \propto I^2$ (2)
Any damage to the transformer windings, such as an SC condition, will change the frequency spectrum of vibration signals since they are connected to the electrical and mechanical performance of the transformer core and windings. This offers a chance to develop methods based on signal processing that can define these variations in frequency [12-14]. However, the high level of noise and the non-stationary nature of the vibration signals create this task difficult [15, 16].
2.2 Fast Fourier Transforms
An effective method for converting signals from the time domain to the frequency domain is the Fast Fourier Transform (FFT). The discrete Fourier Transform (DFT), on which it is based, breaks down a time-domain signal into its separate frequency components, facilitating the analysis of the signals characteristics in the frequency domain [17, 18].
The DFT of a time-domain signal x[n], of length N, is calculated using the following Eq. (3).
$X[k]=\sum_{n=0}^{N-1} x[n] e^{-2 \pi j \frac{k n}{N}}$ (3)
where,
The frequency spectrum at frequency k is represented by X[k]. N is the total number of samples in the signal, and x[n] is the time-domain signal value at sample n, and $e^{2 \pi j \frac{k \cdot n}{N}}$ is the complex exponential term that performs the decomposition of the signal into its frequency components [17].
FFT is commonly applied to time-domain signals to extract their frequency content, allowing for the identification of fundamental frequencies and harmonics within the signal. This transformation is crucial in various signal processing tasks, such as vibration analysis or sound wave decomposition, where understanding the signal's frequency components is essential for further analysis [17].
The mathematical representation of a neuron's output is given by Eq. (4):
$y=f\left(\sum_{i=1}^i \omega_i x_i+b\right)$ (4)
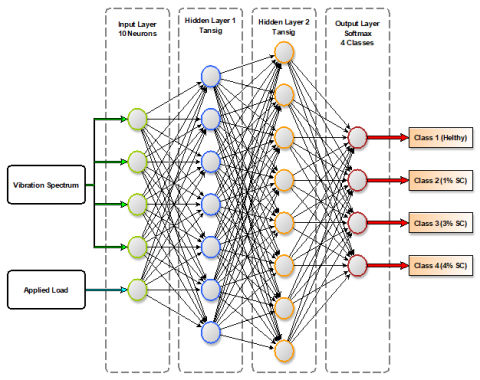
where, xi are the input features, ꭃi are the weights, b is the bias, and f is the activation function, such as sigmoid, ReLU, or Tanh. Through a method known as back propagation, which uses optimisation algorithms like gradient descent to reduce the error between predicted and real outputs, ANNs learn by modifying weights and biases. ANNs are effective tools for applications in classification, regression, image and speech recognition, and natural language processing because of their learning capability, which allows them to generalise from training data. Accuracy, precision, recall, and mean squared error are important performance metrics that direct the assessment and enhancement of ANN models [19-21].
Figure 1. ANN architecture
The general structure of the proposed artificial neural network is illustrated in Figure 1. The confusion matrix, which depicts the connections between expected and actual results, provides a number of essential metrics that are used to assess the performance of ANN. These metrics offer thorough understanding of the model's performance in a variety of subjects.
2.3 Accuracy
The overall correctness of predictions, mathematically expressed as Eq. (5) [17].
$Accuracy=\frac{T P+T N}{T P+T N+E P+E N}$ (5)
where, the elements of the confusion matrix are represented by TP (True Positives), TN (True Negatives), FP (False Positives), and FN (False Negatives) [17].
2.4 Precision
Measures the exactness of positive predictions, Eq. (6).
$Precision=\frac{T P}{T P+F P}$ (6)
This metric is crucial in applications where false positives are particularly costly [17].
2.5 Specificity
Quantifies the model's ability to correctly identify negative cases by Eq. (7) [22].
$Specificaty=\frac{T N}{T N+E P}$ (7)
Also known as the True Negative Rate, it's particularly important in diagnostics applications [23].
2.6 Recall
Measures the model's ability to identify all relevant instances by Eq. (8).
$Recall=\frac{T P}{T P+E N}$ (8)
Also known as the True Positive Rate, it's critical in applications where missing positive cases is costly [24, 25].
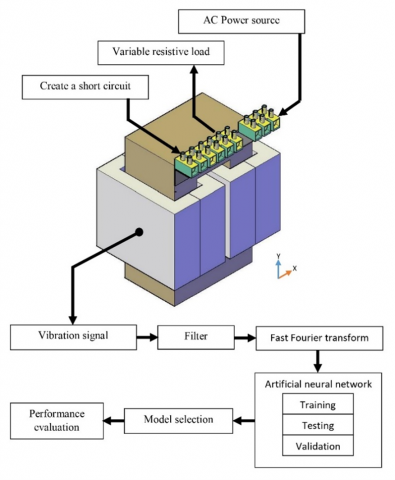
The model depicted in Figure 2 represents the proposed experimental setup. An alternating current with a voltage of 220 V and a frequency of 50 Hz powers the transformer. A variable resistive load, ranging from 0% to 100%, is applied, along with the transformer’s electrical schematic, which shows how the SC points are connected at different ratios. This setup aims to monitor the transformer’s behavior under varying conditions.
Figure 2. Proposed methodology flow chart
An accelerometer sensor, PCB 357, was used to measure the vibrations of the transformer winding. The sensor converts the acceleration values into analog signals, where 10 mV corresponds to an acceleration of 1 m/s². These signals were recorded using a Hantek 6022BE oscilloscope. Subsequently, the recorded signals were transformed into a frequency spectrum using the FFT to analyze the vibration-induced frequencies.
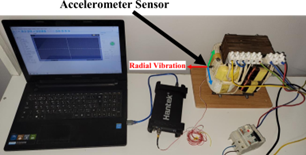
Figure 3 illustrates a transformer with a capacity of 2000 VA, on which an SC test was conducted. During this test, a portion of the secondary winding turns is shorted, and these shorted turns are positioned on the outer part of the transformer. The accelerometer was mounted in a direction that allows it to measure vibrations caused by the radial forces acting on the winding. In each experiment, a fixed short-circuit ratio was applied, and the load capacity was varied over time. Acceleration and current readings were taken after each load change, ensuring a time interval of more than 30 seconds. This experiment was repeated for each fault ratio.
The vibration signals were sampled at a frequency of 10 kHz, which is well above the Nyquist criterion for the analyzed frequency range, ensuring accurate capture of the waveform without aliasing. Prior to performing the FFT, a Hamming window was applied to the time-domain data to reduce spectral leakage and improve frequency resolution. After computing the FFT, only the magnitudes corresponding to the fundamental frequency of 50 Hz and its harmonics (up to 400 Hz) were selected by extracting their values from the FFT output vector containing the amplitude for each frequency bin. In our experimental setup, the total time from vibration signal acquisition to ANN-based fault diagnosis varied between approximately 1 s and 3 s, depending on the overall system operating conditions. This variation is mainly influenced by the USB-based data transfer between the oscilloscope and the computer running MATLAB, as well as the concurrent tasks performed during the experiment.
Subsequently, an ANN model was trained using MATLAB. The measured values were filtered, focusing on the harmonics of the supply frequency of 50 Hz. A total of 9 frequency values, ranging from 0 Hz to 400 Hz in 50 Hz steps, were used. Through these experiments and analyses, a set of results was obtained under different conditions applied to the transformer, including varying load ratios and SC ratios simultaneously.
Figure 3. Experimental setup
The experimental dataset and the ANN training set used in this study cover inter-turn short-circuit ratios of 0%, 1%, 3% and 4% only. While the transformer was initially prepared to allow higher SC ratios, an attempt to operate it at 7% SC resulted in a significant increase in the input current, triggering the magnetothermic circuit breaker (rated at 10 A) immediately upon energization. This incident indicated a high risk of damaging the test setup and associated equipment; therefore, no experiments were conducted for SC ratios above 4% in this study.
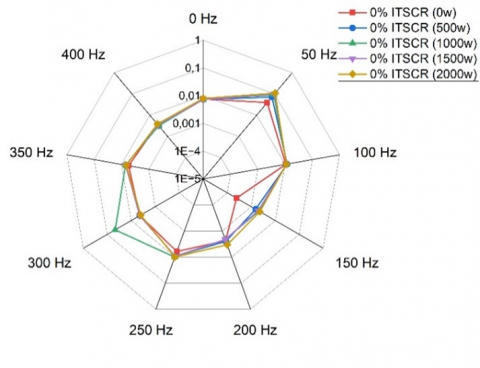
This section presents the results obtained from experiments on the transformer under various conditions. The values of the transformer winding vibrations, after being filtered and transformed using FFT, reveal variations in the recorded data. The vibration intensity is influenced by the presence of an SC between the transformer windings.
Figure 4. The vibrations of windings with a fault rate of 0%
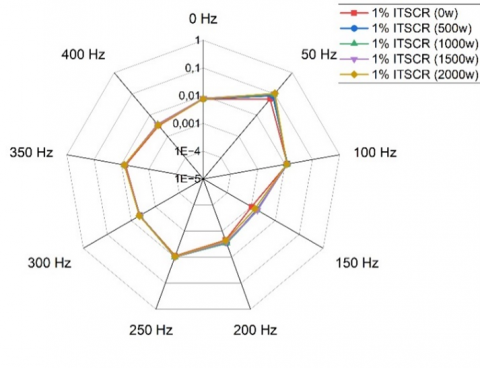
Figure 5. The vibrations of windings with a fault rate of 1%
During testing of the transformer in its normal state, with varying load ratios applied, Figure 4 shows a change in vibration intensity at 150 Hz while the transformer operates without load, where this value drops to approximately 0.0005, while other frequencies maintain the same intensity around 0.01 in terms of vibration magnitude. Additionally, an increase in vibration intensity at 300 Hz is observed after applying a 1000 W load to the transformer. After introducing a short circuit between the windings at levels of 1%, 3%, and 4%, their results are found to be closely aligned, with only minor differences. Furthermore, the recorded changes at 150 Hz and 300 Hz in the initial test disappear under the SC conditions.
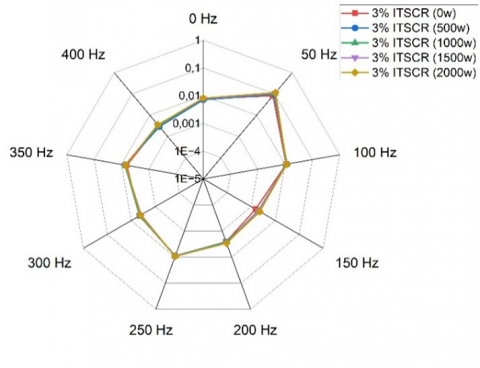
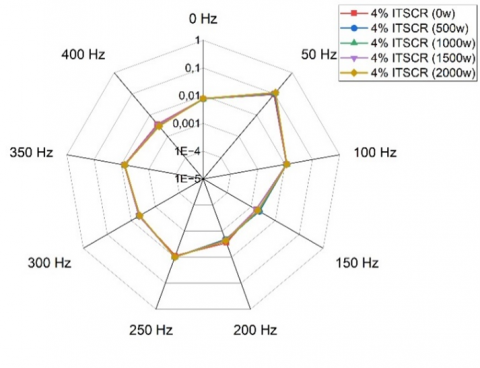
As shown in Figure 5, the vibration pattern for a 1% SC ratio presents noticeable variations compared to the healthy state. Figures 6 and 7 further illustrate the vibration responses for 3% and 4% SC ratios, respectively. It should be noted that high-severity inter-turn short-circuit cases were not tested in this work. An experimental attempt at 7% SC caused an immediate trip of the 10 A magnetothermic protection, indicating a significant risk of equipment damage.
Figure 6. The vibrations of windings with a fault rate of 3%
Figure 7. The vibrations of windings with a fault rate of 4%
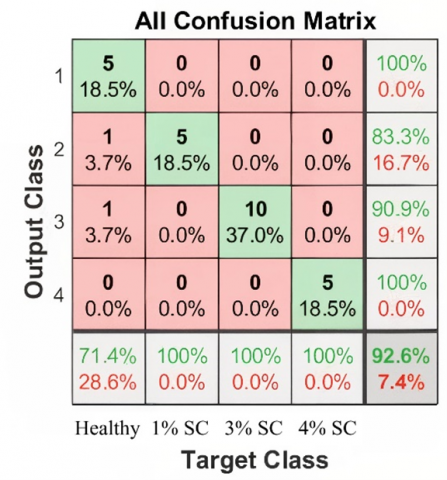
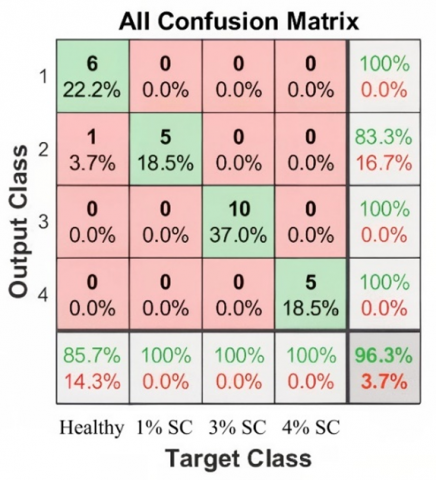
ANN was chosen as the model for this work. Following extensive testing to achieve satisfactory classification results, ten inputs (i.e., the index value for each vibration axis) make up the ANN architecture that was produced. Two networks with two hidden layers and varying numbers of neurons were employed. Five neurons were selected for the first hidden layer in the first network, and nine neurons were selected for the second hidden layer. We employed 9 neurons in the second network’s second hidden layer and 10 neurons in the first hidden layer. 70% of the training data was used for training, 15% for testing, and 15% for validation. The confusion matrices from the ANNs are shown in Figures 8 and 9. The classification performance metrics corresponding to Confusion Matrix 1 are summarized in Table 1, while the results for Confusion Matrix 2 are reported in Table 2. The first ANNs overall accuracy results were 92.6%, the second networks were 96.3%.
Figure 8. Confusion matrix 1
Figure 9. Confusion matrix 2
Table 1. Contains the calculation for the values of Confusion Matrix 1, as shown in Figure 8
|
Class |
Accuracy |
Recall |
Specificity |
Precision |
|
1 |
92.6% |
71.4% |
100% |
100% |
|
2 |
83.3% |
100% |
100% |
|
|
3 |
90.9% |
100% |
100% |
|
|
4 |
100% |
100% |
100% |
Table 2. Contains the calculation for the values of Confusion Matrix 2, as shown in Figure 9
|
Class |
Accuracy |
Recall |
Specificity |
Precision |
|
1 |
96.3% |
75.0% |
100% |
100% |
|
2 |
83.3% |
100% |
100% |
|
|
3 |
90.9% |
100% |
100% |
|
|
4 |
100% |
100% |
100% |
6.1 Confusion Matrix 1
The overall accuracy dropped to 92.6%, indicating that some classifications were incorrect, particularly in the case of healthy transformers (Class 1). The recall for Class 1 suggests that the model failed to identify 28.6% of healthy transformers, misclassifying them as faulty. This poses a risk, as healthy transformers could be incorrectly diagnosed as faulty and subjected to unnecessary maintenance. Recall for classes 2, 3, and 4 indicates that the model performed better in identifying faulty transformers. Notably, the recall for Class 4 (severely faulty transformers) was perfect (100%). This is important because transformers with serious defects need precise detection to avoid operational failures.
6.2 Confusion Matrix 2
Accuracy improved to 96.3%, indicating a more accurate performance compared to Matrix 1. The recall for Class 1 increased to 75%, showing lower misclassifications of healthy transformers, although 25% of healthy transformers are still incorrectly classified as faulty. Recall for classes 2, 3, and 4 remains high (83.3% for Class 2, 90.9% for Class 3, and 100% for Class 4). This indicates that the model is extremely effective in identifying faulty transformers, particularly the critically faulty ones in Class 4.
In some healthy transformer cases, peaks in the vibration spectrum possibly due to slight sensor placement changes or specific load levels caused misclassification as faulty. Standardizing sensor mounting and diversifying load conditions in training could reduce this effect.
This study uses vibration analysis, FFT, and ANN to propose and develop a novel methodology for power transformer fault diagnosis. In comparison with traditional techniques, this method offers a more accurate and efficient fault detection system by focusing on the vibration signals generated by the transformer windings, especially during SC problems. The results of the study show that the ANN model classifies multiple transformer conditions, in some situations the model’s accuracy may exceed 96.3%. Specific frequency components associated with transformer health were identified by the use of FFT for analysing the vibration frequencies, and the ANN efficiently processed these features to classify the transformer state with high precision. One of the main benefits of this strategy is its capacity to identify problems swiftly, even before significant damage takes place, that could avoid expensive disruptions and guarantee system dependability. Additionally, the suggested approach has the advantage of real-time monitoring without needing transformer shut downs, which reduces operational interruptions and boosts the general efficiency of maintenance. This technique improves the diagnosis procedure by combining vibration analysis and artificial intelligence, which results in improved power system monitoring and maintenance efficiency. The model of ANNs may be additional optimised in future research, and this method can be applied to various types of transformer faults.
|
Acore |
Core vibrations, m.s-2 |
|
Awinding |
Winding vibrations, m.s-2 |
|
X[k] |
Frequency spectrum |
|
k |
Frequency, Hz |
|
N |
Total number of samples |
|
x[n] |
Time-domain signal |
|
n |
Signal value at sample |
|
xi |
Input features |
|
ꭃi |
Weights |
|
b |
Bias |
|
f |
Activation function |
[1] Dalarsson, M., Motevasselian, A., Norgren, M. (2014). Online power transformer diagnostics using multiple modes of microwave radiation to reconstruct winding conductor locations. Inverse Problems in Science and Engineering, 22(1): 84-95. https://doi.org/10.1080/17415977.2013.827182
[2] Wang, J., Xing, Y., Ma, X., Zhao, Z., Yang, L. (2023). Numerical investigations for vibration and deformation of power transformer windings under short-circuit condition. Energies, 16(14): 5318. https://doi.org/10.3390/en16145318
[3] Huerta-Rosales, J.R., Granados-Lieberman, D., Garcia-Perez, A., Camarena-Martinez, D., Amezquita-Sanchez, J.P., Valtierra-Rodriguez, M. (2021). Short-circuited turn fault diagnosis in transformers by using vibration signals, statistical time features, and support vector machines on FPGA. Sensors, 21(11): 3598. https://doi.org/10.3390/s21113598
[4] Xin, Q., Yin, H., Zhou, F., Wang, S., Hong, K., Xu, S. (2022). The vibration response of transformer windings under harmonic excitations and its applications. Journal of Vibroengineering, 24(2): 203-220. https://doi.org/10.21595/jve.2021.22162
[5] Jiang, P., Zhang, Z., Dong, Z., Yang, Y., Pan, Z., Deng, J. (2023). Axial and radial electromagnetic-vibration characteristics of converter transformer windings under current harmonics. High Voltage, 8(3): 477-491. https://doi.org/10.1049/hve2.12290
[6] Akre, S., Fofana, I., Yéo, Z., Brettschneider, S., Kung, P., Sékongo, B. (2023). On the feasibility of monitoring power transformer’s winding vibration and temperature along with moisture in oil using optical sensors. Sensors, 23(4): 2310. https://doi.org/10.3390/s23042310
[7] Xing, J., Dai, Z., Yu, W., Zhang, Y. (2024). Analysis of transformer bias vibration based on "magnetic-mechanical" coupling. Journal of Applied Science and Engineering, 27(4): 2429-2435. https://doi.org/10.6180/jase.202404_27(4).0014
[8] Camarena-Martinez, D., Huerta-Rosales, J.R., Amezquita-Sanchez, J.P., Granados-Lieberman, D., Olivares-Galvan, J.C., Valtierra-Rodriguez, M. (2024). Variational mode decomposition-based processing for detection of short-circuited turns in transformers using vibration signals and machine learning. Electronics, 13(7): 1215. https://doi.org/10.3390/electronics13071215
[9] Granados-Lieberman, D., Huerta-Rosales, J.R., Gonzalez-Cordoba, J.L., Amezquita-Sanchez, J.P., Valtierra-Rodriguez, M., Camarena-Martinez, D. (2023). Time-frequency analysis and neural networks for detecting short-circuited turns in transformers in both transient and steady-state regimes using vibration signals. Applied Sciences, 13(22): 12218. https://doi.org/10.3390/app132212218
[10] Huerta-Rosales, J.R., Granados-Lieberman, D., Amezquita-Sanchez, J.P., Camarena-Martinez, D., Valtierra-Rodriguez, M. (2020). Vibration signal processing-based detection of short-circuited turns in transformers: A nonlinear mode decomposition approach. Mathematics, 8(4): 575. https://doi.org/10.3390/math8040575
[11] Jiang, P., Zhang, Z., Dong, Z., Yang, Y., Pan, Z., Yin, F., Qian, M. (2024). Transient-steady state vibration characteristics and influencing factors under no-load closing conditions of converter transformers. International Journal of Electrical Power & Energy Systems, 155: 109497. https://doi.org/10.1016/j.ijepes.2023.109497
[12] Hong, K., Jin, M., Huang, H. (2020). Transformer winding fault diagnosis using vibration image and deep learning. IEEE Transactions on Power Delivery, 36(2): 676-685. https://doi.org/10.1109/TPWRD.2020.2988820
[13] Hong, K., Pan, J., Jin, M. (2020). Transformer condition monitoring based on load-varied vibration response and GRU neural networks. IEEE Access, 8: 178685-178694. https://doi.org/10.1109/ACCESS.2020.3027834
[14] Thanh, B.D., Le, T.H., Quoc, V.D. (2024). A comparative analysis of axial and radial forces in windings of amorphous core transformers. International Journal of Engineering, Transactions A: Basics, 37(1): 201-212. https://doi.org/10.5829/ije.2024.37.01a.18
[15] Song, L., Chen, J. (2023). Transformer winding mechanical fault diagnosis method based on closing transient acoustic vibration signal. Journal of Physics: Conference Series, 2592(1): 012073. https://doi.org/10.1088/1742-6596/2592/1/012073
[16] Pan, C., Shi, X., Fu, T., An, J. (2024). Vibro-acoustic analysis for transformer under DC bias based on electromagnetic coupling. Progress in Electromagnetics Research B, 104: 171-186. https://doi.org/10.2528/PIERB23100801
[17] Schwarz, K. P., Sideris, M.G., Forsberg, R. (1990). The use of FFT techniques in physical geodesy. Geophysical Journal International, 100(3): 485-514. https://doi.org/10.1111/j.1365-246X.1990.tb00701.x
[18] Contreras-Hernandez, J.L., Almanza-Ojeda, D.L., Ibarra-Manzano, M.A., Amezquita-Sanchez, J.P., Valtierra-Rodriguez, M., Camarena-Martinez, D. (2023). Short-circuit damage diagnosis in transformer windings using quaternions: Severity assessment through current and vibration signals. Applied Sciences, 13(23): 12622. https://doi.org/10.3390/app132312622
[19] Awan, M.J., Rahim, M.S.M., Salim, N., Rehman, A., Nobanee, H., Shabir, H. (2021). Improved deep convolutional neural network to classify osteoarthritis from anterior cruciate ligament tear using magnetic resonance imaging. Journal of Personalized Medicine, 11(11): 1163. https://doi.org/10.3390/jpm11111163
[20] Sahu, P.K., Saxena, V., Mahajan, S., Pachlasiya, K., Singh, G. (2025). Artificial neural network systems. Indian Journal of Artificial Intelligence and Neural Networking, 1: 6. https://www.researchgate.net/publication/390342340.
[21] Ali, A.K., Mahmoud, M.M. (2022). Methodologies and applications of artificial intelligence in systems engineering. International Journal of Robotics and Control Systems, 2(1): 201-229. https://doi.org/10.31763/ijrcs.v2i1.532
[22] Mishra, C.S., Jena, R.K., Sinha, P., Paul, K., Mahmoud, M.M., Elnaggar, M.F., Hussein, M.M., Anwer, N.M. (2024). Optimized fault detector based pattern recognition technique to classify and localize electrical faults in modern distribution systems. International Journal of Robotics & Control Systems, 4(3): 1135-1157. https://doi.org/10.31763/ijrcs.v4i3.1474
[23] Ballamudi, S. (2025). Multi-criteria evaluation of artificial neural network applications using topsis. International Journal of Computer Engineering and Technology, 16(2): 516-537. https://doi.org/10.34218/IJCET_16_02_034
[24] Shadfar, H., Izadfar, H.R. (2025). Frequency response analysis: An overview of the measurement process and interpretation of results for fault diagnosis and location in power transformers. International Journal of Industrial Electronics Control and Optimization, 8(2): 149-163. https://doi.org/10.22111/ieco.2024.49470.1603
[25] Ferreira, R.S., Ezzaidi, H., Fofana, I., Picher, P. (2021). Transformers fault identification by frequency response analysis using intelligent classifiers. IET Conference Proceedings CP787, 2021(15): 1610-1616. https://doi.org/10.1049/icp.2022.0156