M. Ansyar Bora![]() | Yuni Hardi
| Yuni Hardi![]() | Aulia Agung Dermawan*
| Aulia Agung Dermawan*![]() | Nandar Cundara
| Nandar Cundara![]() | Ahmad Hanafie
| Ahmad Hanafie![]() | Andi Haslindah
| Andi Haslindah![]() | Ririt Dwiputri Permatasari
| Ririt Dwiputri Permatasari![]() | Luki Hernando
| Luki Hernando![]() | Joni Eka Candra
| Joni Eka Candra![]() | Abdul Mutalib Leman
| Abdul Mutalib Leman![]() | Hisyam Ma'wa Abdullah
| Hisyam Ma'wa Abdullah![]()
© 2025 The authors. This article is published by IIETA and is licensed under the CC BY 4.0 license (http://creativecommons.org/licenses/by/4.0/).
OPEN ACCESS
This study focuses on redesigning the work platform height for workpiece tightening activities at PT. Xyz, utilizing the Rapid Entire Body Assessment (REBA) and Quick Exposure Check (QEC) methods to assess the risk level of the activity. The results from REBA indicated a high-risk score of 10, while the QEC showed a 61% exposure score, confirming the need for immediate improvements. Based on the analysis of anthropometric data from workers at the CNC FH8800 workstation, the optimal work platform height was determined to be 64.3 cm, whereas the current platform height is 120 cm. A reduction of 55.7 cm is necessary to achieve an ergonomic design, which is expected to reduce operator fatigue and increase productivity. This study demonstrates how ergonomic adjustments based on anthropometric data can improve work conditions and operational efficiency.
ergonomic design, REBA, QEC, anthropometric data, CNC machines, risk assessment
In the context of PT. Xyz, an international company operating in the oil & gas sector, the procurement process involves the production of drilling equipment. Some of these tools are manufactured in-house using Computer Numerically Controlled (CNC) machines to achieve high levels of accuracy and smoothness. Additionally, certain tools are outsourced to vendors based on factors like lower costs, less complexity, and processes that cannot be done in-house, such as coating and threading [1]. Outsourcing in the oil and gas industry is a common practice, where minor suppliers may have limited influence on the supply chain. Locally owned firms can benefit from outsourcing newer and more efficient technologies to enhance technical and allocative efficiency, leading to higher profits [2]. Moreover, logistics outsourcing in the oil and gas sector faces challenges that can be overcome through strategic management, including the provision of standard equipment, effective communication, staff motivation, quality assurance, and project monitoring [3]. The use of Industry 4.0 technologies, such as digitalization and intelligence, can bring significant benefits to oil and gas companies. This model, known as "Oil and Gas 4.0," emphasizes the digital transformation and smart technologies in the industry [4]. Furthermore, the application of blockchain technology in the oil and gas sector offers opportunities for improved storage, ordering, transportation, and distribution of products through various industry channels [1]. In the machining process using CNC machines, the operator has a very important role in the workpiece mounting system. The operator is responsible for placing the workpiece according to the setup-sheet in order for the CNC program to run correctly. In addition, the operator must also ensure that the workpiece does not move during the machining process. For this reason, the operator places the workpiece and tightens it manually in a standing working position or attitude. The height difference between the platform and the work table on a CNC machine can lead to discomfort and fatigue for operators due to repetitive processes like tightening workpieces. In a scenario where the average worker height is 165 cm and the height difference is 60 cm, ergonomic issues can arise, impacting productivity. Operators spend significant time setting up the machine, with a setup time of 15 minutes before each of the 9 tightening processes per shift. Additionally, operators take a 10-minute break after setup, resulting in non-value-added time totaling 90 minutes per shift. This reduces productive working hours to 9 out of the 10.5 total hours, affecting efficiency and potentially leading to operator discomfort and fatigue. To address these ergonomic concerns and improve efficiency, it is crucial to consider the design and setup of CNC machines. Proper maintenance [5] is essential for ensuring optimal performance and longevity of CNC machines. Additionally, study [6] emphasizes the significance of analyzing body posture to enhance work effectiveness and prevent musculoskeletal issues among operators. Ergonomic design considerations [7] can significantly impact worker health and productivity, especially when tailored to anthropometric data. the utilization of simulation tools like the Swansoft CNC Simulator [8] can aid in training operators effectively, especially during circumstances like the COVID-19 pandemic. This can enhance learning outcomes and operational proficiency. Furthermore, research on optimizing cutting processes [9] showcases the continuous efforts to enhance CNC machine operations for better performance and quality output. From the results of interviews and observations of operators who operate CNC machines, there are complaints of pain in the neck, hips, back, and hands due to work postures that are not in accordance with the body. This can cause discomfort and musculoskeletal disorder in the operator. Ergonomics studies show that non-ergonomic work postures can cause discomfort and risk of injury to workers [6, 10-12]. Work posture analysis methods such as OWAS and RULA are used to evaluate the operator's posture while working. The results of analysis using the OWAS method show that some operators require improved work posture to reduce the risk of injury [12, 13]. In addition, education and muscle stretching exercises have been shown to reduce musculoskeletal complaints in workers, such as pain in the shoulders, neck, hands, waist, and back [14]. Ergonomic workbench design based on work posture risk analysis can help reduce operator discomfort and risk of injury. Studies show that adjusting work posture to a suitable workbench can improve worker comfort and health [15, 16]. In addition, ergonomic laptop chair and desk design is also important to prevent postural discomfort when working with a computer [9]. In the context of CNC machines, optimization of machine parameters such as cutting speed and depth of cut can affect production process time and operator comfort. Research shows that optimization of machine parameters can improve the efficiency of the production process and reduce the risk of injury to operators. The issue of non-value-added time in the workplace, such as inefficient processes like tightening workpieces, can lead to musculoskeletal problems among workers, increasing the risk of permanent disabilities [17]. This is particularly concerning as studies have shown that work-related musculoskeletal disorders are prevalent among manufacturing industry workers [18]. Such disorders not only affect the workers but also have consequences for employers and society at large [17]. In the long term, these musculoskeletal issues can contribute to permanent work disability, impacting workers' ability to return to work and affecting their earnings and employment patterns [19]. Research indicates that workers with permanent impairments may experience challenges in returning to work and maintaining long-term employment [20]. Additionally, individuals with permanent work-related impairments face long-term mortality risks, highlighting the serious implications of such disabilities [21]. Efforts to address these issues include the need for workplace safety improvements, as highlighted in a study on back pain and disability among automotive industry workers in Ethiopia, where a lack of a safety culture was noted [22]. Implementing ergonomic interventions, as seen in a study on ergonomic risk factors among workers in a medical manufacturing company, can help enhance safety and productivity [20], the study [1] showed an example how to cite a journal article in press. This is a case of one author only. [2] showed an example how to cite a journal article in press. This is a case of one author only. However, produced different results. it is crucial to consider the economic impact of disabilities on workers. Studies have shown that workers with disabilities may face challenges in accessing workplace wellness programs and may require strategies to ensure equitable access to such programs [23]. Return to Work (RTW) programs play a vital role in mitigating the economic and personal consequences of long-term sickness absence. In this context, ergonomic risk assessments are essential to ensure a safe and supportive work environment for returning employees. This study offers a novel contribution by simultaneously integrating two established ergonomic assessment tools—Rapid Entire Body Assessment (REBA) and Quick Exposure Check (QEC)—to evaluate posture and ergonomic risk exposure. The combined application of REBA and QEC is rarely found in previous research, especially within the heavy manufacturing industry. Most prior studies have tended to use these methods in isolation. For example, some studies have focused solely on comparing REBA and RULA, while others have relied exclusively on QEC for assessing workstations in the light manufacturing sector. By integrating both REBA and QEC in a single framework, this study aims to provide a more comprehensive and nuanced understanding of ergonomic risks in heavy manufacturing settings.
Therefore, the combined REBA-QEC approach adopted in this study facilitates a more holistic and comprehensive assessment of musculoskeletal risks, particularly in CNC machine operations that involve static postures and repetitive movements. Furthermore, the integration of local anthropometric data enhances the relevance and precision of ergonomic evaluations, allowing for redesign strategies that are better aligned with the actual physical characteristics of the workers. This integrative approach ultimately contributes to more effective ergonomic interventions and supports sustainable return-to-work efforts in the heavy manufacturing sector.
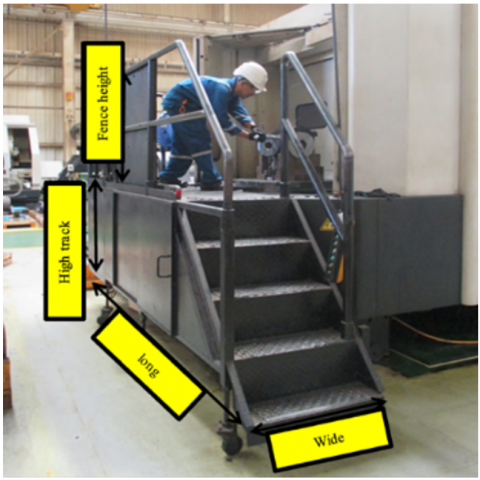
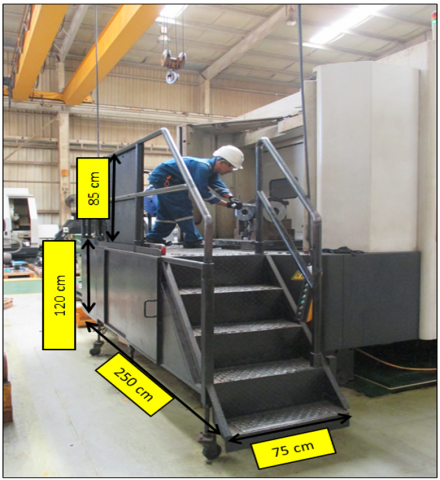
Data collection on the dimensions of the runway and workbench was carried out to gain an overview of the existing workspace layout at PT. Xyz. Table 1 presents the specific measurements of both the runway and the workbench, while Figure 1 visually illustrates their actual conditions in the field.
Table 1. Dimensions of the work platform and workbench
|
Item |
Dimension |
|
Work Platform |
|
|
Length |
250 cm |
|
Width |
75 cm |
|
Height |
120 cm |
|
Fence Height |
85 cm |
|
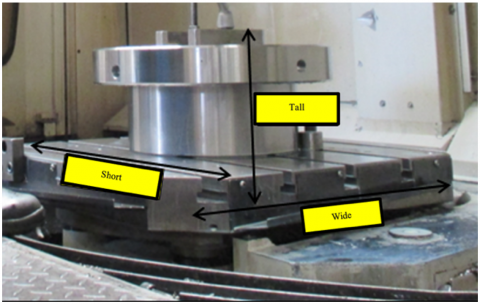
Workbench |
|
|
Length |
80 cm |
|
Width |
80 cm |
|
Height |
170 cm |
(a)
(b)
Figure 1. Working platform (a) and workbench (b)
2.1 Observer questionnaire
This questionnaire is designed to assess the operator's posture during the workpiece fastening activity on the CNC FH8800 machine. The questionnaire uses a scale-based assessment to evaluate various aspects related to the operator's body posture and physical movements, such as the positioning of the back, shoulders, arms, wrists, and neck, as well as the frequency and intensity of movements during the workpiece tightening activity. The data collected from this questionnaire provides insights into the factors affecting the operator's posture and physical strain, offering a foundation for further ergonomic analysis and potential improvements.
Explanation of the Rating Scale in the Questionnaire on Table 2. In this questionnaire, the rating scale used is ordinal, with several options describing the intensity or frequency of the conditions experienced by the operator during the workpiece fastening activity. Each question provides answer choices that indicate the severity or frequency of the condition, which are categorized as follows:
Not: Indicates that the condition almost never occurs or does not occur at all.
Rarely: The condition occurs at a very low frequency or not very often.
Frequently: The condition occurs fairly often.
Very Frequently: The condition occurs very frequently, almost all the time.
This scale helps provide a clearer picture of how each movement or body position contributes to potential risks to the operator's physical health, as shown in Table 2.
Table 2. A recapitulation of these responses
|
Type of Work |
Operator |
Back |
Shoulder/Arm |
Wrist |
Neck |
|||
|
1 |
2 |
1 |
2 |
1 |
2 |
|||
|
Workpiece Tightening |
1 |
A3 |
B4 |
C1 |
D2 |
E2 |
F2 |
G2 |
|
2 |
A3 |
B4 |
C1 |
D2 |
E2 |
F2 |
G2 |
|
|
3 |
A3 |
B4 |
C1 |
D2 |
E2 |
F1 |
G2 |
|
|
4 |
A3 |
B4 |
C1 |
D2 |
E2 |
F2 |
G2 |
|
|
5 |
A3 |
B4 |
C1 |
D2 |
E2 |
F2 |
G2 |
|
|
6 |
A3 |
B4 |
C1 |
D2 |
E2 |
F2 |
G2 |
|
2.2 Worker/operator questionnaire
The worker/operator questionnaire is useful for determining the load felt by workers during the workpiece tightening activity. This questionnaire uses an ordinal scale to evaluate various aspects related to the operator’s physical strain and the conditions faced during the activity. Table 3 is a recapitulation of the answers from the questionnaire filled out by all workers operating the CNC FH8800 machine during the workpiece tightening activities.
The rating scale in the questionnaire provides several options describing the intensity or frequency of conditions experienced during the work. These answer choices include:
Light, Fairly Heavy, Heavy, Very Heavy to assess the manual load lifted by the operator.
Less than 2 hours, 2 to 4 hours, and more than 4 hours to assess the time required to complete the work in a day.
Low, Medium, High to assess the strength exerted by one hand during the activity.
Low, High to evaluate the need for detailed vision during the work.
Less than 1 hour per day, between 1 and 4 hours per day, and more than 4 hours per day to evaluate the usage of vehicles or tools producing vibrations.
Never, occasionally, frequently to assess the difficulties experienced during the work.
This scale helps clarify the intensity and frequency of movements and positions, giving a more detailed picture of the physical load on the operator during the workpiece tightening process. The data collected provides valuable insight into the factors affecting the operator's physical health and offers a foundation for ergonomic improvements.
Table 3. Recapitulation of worker questionnaire answers
|
Type of Work |
Operator |
Question |
|||||||
|
H |
I |
J |
K |
L |
M |
N |
O |
||
|
Workpiece Tightening |
1 |
H3 |
I2 |
J2 |
K1 |
L1 |
M1 |
N3 |
O3 |
|
2 |
H3 |
I2 |
J2 |
K1 |
L1 |
M1 |
N3 |
O3 |
|
|
3 |
H3 |
I2 |
J2 |
K1 |
L1 |
M1 |
N3 |
O3 |
|
|
4 |
H3 |
I2 |
J2 |
K1 |
L1 |
M1 |
N3 |
O2 |
|
|
5 |
H3 |
I2 |
J2 |
K1 |
L1 |
M1 |
N3 |
O2 |
|
|
6 |
H3 |
I2 |
J2 |
K1 |
L1 |
M1 |
N3 |
O2 |
|
2.3 Work posture drawings
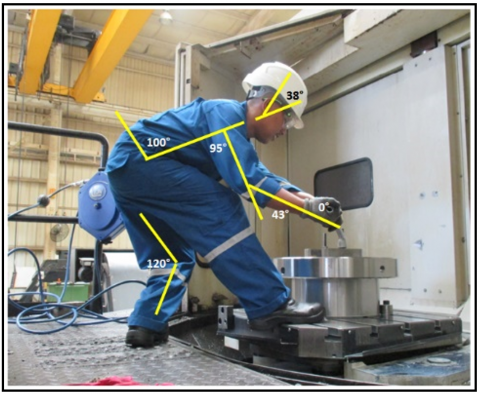
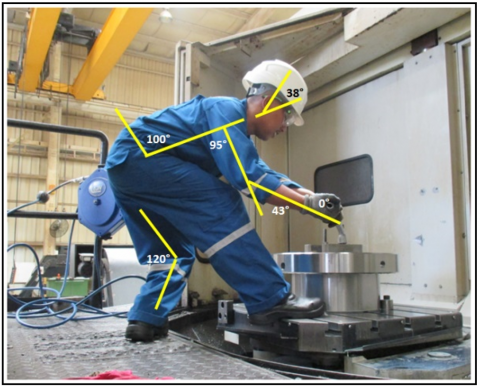
In order to facilitate a better understanding of the issues at hand, it is essential to include drawings of work posture, particularly for the measurement of limb angles. These measurements are crucial for assessing risk levels using the Rapid Entire Body Assessment (REBA) method. The following figure illustrates the body posture condition, highlighting the angles of the limbs that are necessary for the risk assessment process.
2.4 Standing anthropometry
The anthropometric data obtained by the author are presented in Table 4, based on Figure 2.
Table 4. Anthropometric data of standing workers
|
Worker List |
Measurement Result Data |
||||
|
TSB |
TPB |
JTD |
RT |
LB |
|
|
Worker 1 |
105 |
95 |
76 |
177 |
49 |
|
Worker 2 |
107 |
96 |
78 |
174 |
47 |
|
Worker 3 |
105 |
98 |
79 |
176 |
46 |
|
Worker 4 |
104 |
95 |
77 |
174 |
45 |
|
Worker 5 |
106 |
92 |
78 |
173 |
49 |
|
Worker 6 |
107 |
98 |
79 |
180 |
48 |
Note: 1. Standing Elbow Height (TSB), 2. Standing Waist/Hip Height (TPB), 3. Forward Hand Reach (JTD), 4. Arm Span (RT), 5. Body Width (LB) "The units used are cm"
Figure 2. Calculation of limb angle in workpiece tightening activity
2.5 The implementation process of the REBA and QEC methods in this study consists of several main steps
Initial Data Collection: Data collection is carried out by observing the workers' posture during the workpiece tightening activity on the CNC FH8800 machine. This data includes anthropometric measurements of the workers as well as an analysis of body posture and the physical load they bear.
Use of Questionnaires: A questionnaire is used to assess the workers' body posture and the physical strain they experience during the activity. This questionnaire measures body positions (such as the back, arms, wrists, and neck) as well as the frequency and intensity of movements during the tightening activity.
REBA Analysis: The REBA method is used to assess the overall risk of workers' body posture. Each body part is rated based on the angle of its position and the load it bears. The results of this evaluation provide a score that reflects the risk of musculoskeletal injuries caused by that posture. For example, the neck, legs, and upper body are scored based on specific criteria.
QEC Analysis: The QEC method evaluates five different interaction combinations between posture, load, duration, and movement that can increase the risk of injury. This score helps determine the level of exposure to risk and provides guidance for further improvements.
Exposure Score Calculation: After the data is collected, the exposure score is calculated based on the answers from the questionnaires and posture evaluations. This score is used to assess the level of exposure to injury risks on body parts such as the back, shoulders/arms, wrists, and neck.
Design Improvement Proposals: Based on the results from the REBA and QEC analyses, design changes are proposed for the work platform. For example, the platform height is reduced from 120 cm to 64.3 cm to alleviate strain on the workers' bodies, improving comfort and productivity.
Evaluation and Reassessment: After the design changes are implemented, further evaluation is required to ensure that the improvements have successfully reduced injury risks and increased worker performance. If needed, additional adjustments can be made based on feedback from workers and post-implementation data.
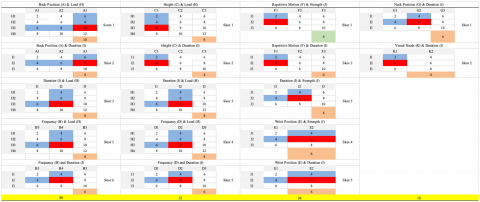
Based on the recapitulation of the answers to the observer and worker questionnaires, the exposure score is then calculated, where the exposure score is calculated for each part of the body such as the back, shoulders/arms, wrists and neck by considering ± 5 combinations/interactions, namely posture with force/load, movement with force/load, duration with force/load, posture with duration and movement with duration. Here is one of the exposure score calculations in workpiece tightening activities (Figure 3).
Figure 3. Exposure score results on workpiece tightening activities
Table 5 is a recapitulation of the results of the exposure score calculation for all operators in workpiece tightening activities and the determination of exposure scores based on Table 5.
Table 5. Recapitulation of exposure score
|
Observed Limbs |
Exposure Score Value |
Average |
Display Score |
|||||
|
Oprt 1 |
Oprt 2 |
Oprt 3 |
Oprt 4 |
Oprt 5 |
Oprt 6 |
|||
|
Back (Moving) |
40 |
40 |
40 |
40 |
40 |
40 |
40 |
High |
|
Shoulders/Arms |
32 |
32 |
32 |
32 |
32 |
32 |
32 |
High |
|
Wrist |
26 |
26 |
26 |
26 |
26 |
26 |
26 |
Medium |
|
Neck |
10 |
10 |
10 |
10 |
10 |
10 |
10 |
Medium |
|
Total Exposure Check value |
108 |
108 |
108 |
108 |
108 |
108 |
108 |
|
After obtaining the exposure score for each limb studied during the workpiece tightening activity for each operator, the next step is to calculate the exposure level. This exposure level helps determine the necessary actions related to the observed work activity to reduce the risk of injury.
$E \%=\frac{X}{X_{\max }} \times 100$
where:
X = Total score obtained for exposure to the risk of injury to the back, shoulders/arms, wrists, and neck, calculated from the questionnaire.
Xmax = Maximum total score for exposure to potential injury for the back, shoulders/arms, wrists, and neck. Xmax is constant for certain jobs. For manual handling work (such as lifting, pulling, or carrying objects), the possible Xmax value is 176.
Example of Exposure Level Calculation:
For example, if the total exposure score (X) is 108 and Xmax is 176:
$E \%=\frac{108}{176_{\operatorname{Max}}} \times 100=60.8 \%$
Thus, the exposure level would be 60.8%, which indicates the level of risk in the observed work activity.
E = 61% (need further research and changes)
The following is a recapitulation of the exposure check level calculation for all operators in workpiece tightening activities based on Table 5, which can be seen in Table 6.
The following is a description of the five interaction combinations used in the Quick Exposure Check (QEC) analysis, which are arranged in an integrated and interrelated manner to provide a complete understanding of the potential ergonomic risks in the workplace:
1) Posture with Load assesses the effects of non-neutral postures when applying pressure to a workpiece, which increases the statistical stress of the muscles.
2) Posture with Duration assesses the impact of maintaining awkward postures for a long time on muscle fatigue.
3) Movement with Load considers the risk, repeated movements simultaneously with compressive forces, especially on the wrist and arm.
4) Movement with Duration measures the effects of fatigue due to long-term repetition without rest.
5) Posture with Movement assesses the risk when rapid posture changes are performed in dynamic and unstable working positions.
Table 6. Recapitulation of exposure check levels and actions
|
Job Type |
Operator |
Exposure Level |
Action |
|
Workpiece Tightening |
1 |
61 % |
Need further research and changes |
|
2 |
61 % |
Need further research and changes |
|
|
3 |
61 % |
Need further research and changes |
|
|
4 |
61 % |
Need further research and changes |
|
|
5 |
61 % |
Need further research and changes |
|
|
6 |
61 % |
Need further research and changes |
3.1 REBA score sheet of work attitude and posture
From Figure 4, it can be seen that the angles of the left and right legs of the workers differ. In this case, the author selected the data from the left foot, as it showed the greatest angular deviation.
Figure 4. Measurement angle of REBA method for workpiece tightening activity
1. Group A posture (trunk stability)
Group A includes the posture of the neck, trunk, and legs, which are essential for maintaining body stability during work.
a. Neck Posture
The neck forms an angle of 38°. According to the REBA assessment, the score is 2.
b. Leg Posture
Both feet support the body weight evenly, giving a base score of 1. However, both legs form an open angle of about 100°, which adds 2 points. Therefore, the total score for the leg section is 3.
c. Trunk Posture
The trunk forms an angle of 120°. Based on the REBA scoring system, the posture receives a score of 4.
A summary table of REBA score calculations for Group A body parts across all operators is provided in Table 7.
2. Group B posture (upper extremities)
Group B includes the posture of the upper extremities, namely the upper arm, lower arm, and wrist, which are crucial for gripping activities.
a. Wrist Posture
The wrist is aligned straight with the lower arm, resulting in a score of 1.
b. Lower Arm Posture
The lower arm forms a 43° angle with the upper arm. This posture is given a score of 2.
c. Upper Arm Posture
The upper arm forms an angle of 95°. Based on the REBA criteria, the score is 4.
Table 8 is a recapitulation of the results of the calculation of REBA scores on group B limbs for all operators.
Table 9 is a recapitulation of the results of calculating the total REBA score for all operators.
Table 10 is a recapitulation of risk levels and actions to be taken based on Table 10.
Table 7. Recapitulation of REBA scores of group A limbs
|
|
Recapitulation of REBA Scores of Group A Members |
Average |
|||||
|
Oprt 1 |
Oprt 2 |
Oprt 3 |
Oprt 4 |
Oprt 5 |
Oprt 6 |
||
|
Neck score |
2 |
2 |
2 |
2 |
2 |
2 |
2.0 |
|
foot score |
3 |
3 |
3 |
3 |
3 |
3 |
3.0 |
|
Foot score |
4 |
4 |
4 |
4 |
4 |
4 |
4.0 |
|
A score value |
7 |
7 |
7 |
7 |
7 |
7 |
7.0 |
|
Charging score |
1 |
1 |
1 |
1 |
1 |
1 |
1.0 |
|
Shock load |
1 |
1 |
1 |
1 |
1 |
1 |
1.0 |
|
Total score A (A score + Load score + shock load) |
9 |
9 |
9 |
9 |
9 |
9 |
9.0 |
Table 8. Recapitulation of REBA scores of group B limbs
|
|
Recapitulation of REBA Scores of Group B Members |
Average |
|||||
|
Oprt 1 |
Oprt 2 |
Oprt 3 |
Oprt 4 |
Oprt 5 |
Oprt 6 |
||
|
Wrist |
1 |
1 |
1 |
1 |
1 |
1 |
1.0 |
|
Forearm |
2 |
2 |
2 |
2 |
2 |
2 |
2.0 |
|
Upper arm |
4 |
3 |
4 |
4 |
3 |
3 |
3.5 |
|
Score B |
5 |
4 |
5 |
5 |
4 |
4 |
4.5 |
|
Grip value |
0 |
1 |
0 |
0 |
0 |
0 |
0.2 |
|
Total score B (Score B + Grip score) |
5 |
5 |
5 |
5 |
4 |
4 |
4.7 |
Table 9. Recapitulation of total REBA scores
|
|
Group C Score Recapitulation |
Average |
|||||
|
Oprt 1 |
Oprt 2 |
Oprt 3 |
Oprt 4 |
Oprt 5 |
Oprt 6 |
||
|
Total score A |
9 |
9 |
9 |
9 |
9 |
9 |
9.0 |
|
Total score B |
5 |
5 |
5 |
5 |
4 |
4 |
4.7 |
|
Table C values |
9 |
9 |
9 |
9 |
8 |
8 |
8.7 |
|
Activity value |
1 |
1 |
1 |
1 |
1 |
1 |
1.0 |
|
Total REBA score |
10 |
10 |
10 |
10 |
9 |
9 |
9.7 |
Table 10. Recapitulation of risk levels and actions
|
Job Type |
Operator |
Total Reba Score |
Risk Level |
Action |
|
Workpiece Tightening |
1 |
10 |
high |
Immediate fixes needed |
|
2 |
10 |
high |
Immediate fixes needed |
|
|
3 |
10 |
high |
Immediate fixes needed |
|
|
4 |
10 |
high |
Immediate fixes needed |
|
|
5 |
9 |
high |
Immediate fixes needed |
|
|
6 |
9 |
high |
Immediate fixes needed |
3.2 Data normality test
Here are the steps to perform a data normality test using the Shapiro-Wilk method
Determine the hypothesis: The hypotheses for this study are as follows:
H₀: The research data is normally distributed.
H₁: The research data is not normally distributed.
The decision criteria are based on the p-value (Sig. value):
•If the p-value (Sig.) is < α, the data is not normally distributed (reject H₀).
•If the p-value (Sig.) is > α, the data is normally distributed (do not reject H₀).
Determine α:
•The significance level (α) is set at 5% (α = 0.05), corresponding to a 95% confidence level.
Test statistical formula:
•The Shapiro-Wilk test coefficient (D) is calculated. In this study, the obtained D value is 1.486861, as shown in Table 11.
Table 11. Shapiro-Wilk test coefficient calculation values (D)
|
No. |
Measured Data |
Symbol |
N (Total) |
x (Total Data) |
$\bar{x}$ (Average) |
x- $\bar{x}$ |
$(x-\bar{x})^2$ |
$\sigma$ (Standard Deviation) |
|
1 |
Body Width |
LB |
6 |
284 |
47.33 |
236.67 |
56012.69 |
96.62 |
|
2 |
Hip Height Standing |
TPB |
6 |
574 |
95.67 |
478.33 |
228799.59 |
195.28 |
|
3 |
Hand Forward Reach |
JTD |
6 |
467 |
77.83 |
389.17 |
151453.29 |
158.88 |
|
4 |
Standing Elbow Height |
TSB |
6 |
634 |
105.67 |
528.33 |
279132.59 |
215.69 |
|
5 |
Hand Stretch |
RT |
6 |
1054 |
175.67 |
878.33 |
771463.59 |
358.58 |
|
Sum |
3013 |
Sum |
1486861.75 |
545.32 |
||||
|
Average |
602.6 |
|||||||
Calculation example:
1) (amount of data) = Number of anthropometric data calculations of operators 1 – 6
2) = 284 - 47.33 = 236.67
3) = 236.672 = 56012.69
4) (Standard deviation)
$=\sqrt{\frac{\sum\left(x_i-\bar{x}\right)^2}{n}}=\sqrt{\frac{(284-47.33)^2}{6}}=96.62$
Furthermore, the calculation uses SPSS to find out whether the data is distributed normally or not.
Based on the output of the Test of Normality above, the Shapiro-Wilk test results show the significance values for TSB (0.415), TPB (0.404), JTD (0.421), RT (0.463), and LB (0.505). Since all the significance values for TSB, TPB, JTD, RT, and LB are greater than 0.05, it can be concluded that the anthropometric data are normally distributed.
The data obtained from Table 12 consists of the anthropometric measurements of workers in a standing position, which are required for this study. The next step involves calculating the mean, standard deviation, control limits, and percentiles for these data. The statistical results from the processing of the workers' anthropometric data, as performed by the author, can be seen in Table 13.
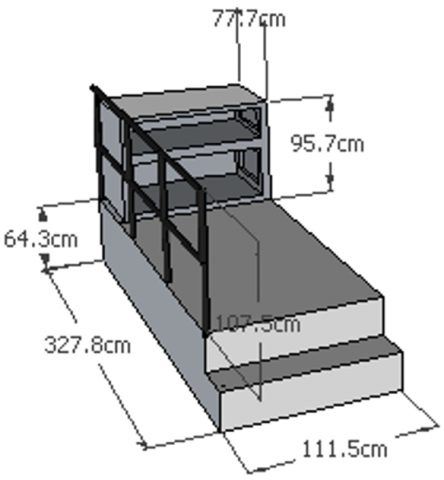
3.3 Proposed work platform height design
The following are the proposed dimensions for the work platform design, based on the anthropometric data processed by the author in Table 13. The dimensions, along with their explanations, can be seen in the following Figure 5.
Table 12. Table output test of normality
|
Variable |
Kolmogorov-Smirnov (Statistik) |
df |
Sig. (KS) |
Shapiro-Wilk (Statistik) |
df |
Sig. (SW) |
|
TSB |
0.209 |
6 |
0.200* |
0.907 |
6 |
0.415 |
|
TPB |
0.217 |
6 |
0.200* |
0.905 |
6 |
0.404 |
|
JTD |
0.223 |
6 |
0.200* |
0.908 |
6 |
0.421 |
|
RT |
0.241 |
6 |
0.200* |
0.914 |
6 |
0.463 |
|
LB |
0.180 |
6 |
0.200* |
0.920 |
6 |
0.505 |
Figure 5. Proposed work platform design
Table 13. Statistical calculation results of workers' anthropometric data
|
Worker |
TSB |
TPB |
JTD |
RT |
LB |
|
1 |
105 |
95 |
76 |
177 |
49 |
|
2 |
107 |
96 |
78 |
174 |
47 |
|
3 |
105 |
98 |
79 |
176 |
46 |
|
4 |
104 |
95 |
77 |
174 |
45 |
|
5 |
106 |
92 |
78 |
173 |
49 |
|
6 |
107 |
98 |
79 |
180 |
48 |
|
Mean/percentile 50th |
105.67 |
95.67 |
77.83 |
175.67 |
47.33 |
|
StdeV |
1.11 |
2.05 |
1.07 |
2.36 |
1.49 |
|
BKA |
107.88 |
99.78 |
79.97 |
180.38 |
50.31 |
|
BKB |
103.46 |
91.56 |
75.70 |
170.95 |
44.35 |
|
Percentile 5th |
103.85 |
92.30 |
76.08 |
171.80 |
44.89 |
|
Percentile 95th |
107.48 |
99.04 |
79.58 |
179.53 |
49.78 |
Based on the research conducted by the author on the workpiece tightening activity at PT. Xyz, the anthropometric data of the workers has been calculated, which serves as the focal point for providing design proposals. The processed anthropometric data results can be seen in Table 14.
Table 14. Anthropometric focal points
|
Worker |
TSB |
TPB |
JTD |
RT |
LB |
|
Mean |
105.67 |
95.67 |
77.83 |
175.67 |
47.33 |
|
StdeV |
1.11 |
2.05 |
1.07 |
2.36 |
1.49 |
|
BKA |
107.88 |
99.78 |
79.97 |
180.38 |
50.31 |
|
BKB |
103.46 |
91.56 |
75.70 |
170.95 |
44.35 |
|
Percentile 5th |
103.85 |
92.30 |
76.08 |
171.80 |
44.89 |
|
Percentile 95th |
107.48 |
99.04 |
79.58 |
179.53 |
49.78 |
4.1 REBA analysis
Based on the average REBA score calculations, it can be concluded that the workpiece tightening activity is at a relatively high-risk level. The anthropometric data is used as a reference for taking appropriate actions, and in this case, it serves as a proposal for a more targeted and accurate design. For more details, refer to Table 15.
Table 15. REBA analysis and anthropometric reference
|
Activity |
Average REBA Score |
Risk Level |
Action |
Proposed Steps (Plan) |
Anthropometric References |
|
Workpiece Tightening |
10 |
Hight |
Immediate fixes needed |
Changes in the Height of the Work Track |
Anthropometric Data TSB |
4.2 Analysis of the actual work platform dimensions compared to the proposed design
The analysis of the comparison between the actual current work platform dimensions and the proposed design can be seen in Table 16.
Table 16. Comparison of the actual work platform and proposed design
|
Dimension |
Comparison of the Work Foundation |
Dispute |
|
|
Current |
Proposed |
||
|
High |
120 cm |
64.3 cm |
-55.7 |
|
length |
250 cm |
327.8 cm |
+77.8 |
|
width |
75 cm |
111.5 cm |
+36.5 |
|
Fence height |
85 cm |
107.5 cm |
+22.5 |
|
Tool Table Height |
NA |
95.7 cm |
NA |
|
Tool Table Width |
NA |
77.8 cm |
NA |
|
Tool Table Length |
NA |
111.5 cm |
NA |
Based on Table 16, it can be seen that there are differences in the dimensions between the actual work platform and the proposed design. These differences include a reduction in the platform height by 55.7 cm, an increase in the platform length by 77.8 cm, an increase in the platform width by 36.5 cm, an increase in the guard height by 22.5 cm, and the addition of a tool table with dimensions of 111.5 × 77.8 × 95.7 cm.
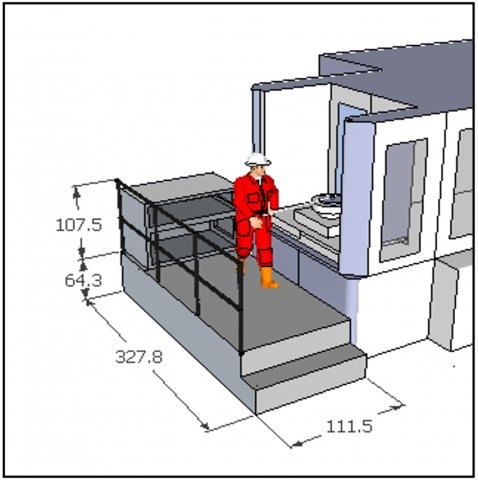
The comparison of the shape between the actual work platform and the proposed design can be seen in Figure 6.
(a)
(b)
Figure 6. Comparison of the actual work platform (a) and the proposed design (b)
4.2.1 Technical analysis of proposed work platform modifications
The proposed changes to the work platform dimensions were derived from a comprehensive analysis of anthropometric data collected from all operators working at the CNC FH8800 workstation. These modifications are aimed at improving ergonomic conditions by reducing musculoskeletal risks and enhancing worker productivity.
4.2.2 Platform height adjustment
The platform height was reduced from 120 cm to 64.3 cm. This change is based on the average standing elbow height (SEH) of the workers, which is 105.67 cm. The original platform height forced workers to elevate their shoulders and bend their backs forward while working, resulting in increased static muscle load and a higher REBA score. By aligning the platform height more closely with the average SEH, the new design supports a more neutral upper-body posture, reducing strain on the neck, shoulders, and lower back.
4.2.3 Platform length and width extension
The length and width of the platform were increased to expand the primary work zone. This change minimizes the need for excessive torso rotation and arm extension when reaching for tools or components. Reducing such repetitive and awkward movements helps lower the risk of upper limb disorders and contributes to more stable and efficient task execution.
4.2.4 Guardrail height increase
The height of the guardrails was increased to align with the elbow zone, providing better support and preventing workpieces from falling during operation. This adjustment enhances both safety and stability during the tightening process, particularly when the worker applies force near the platform edge.
With these adjustments, what was previously a high-risk work activity is now expected to be categorized as a lower-risk task, as assessed using REBA scores. Furthermore, by improving body posture and reducing physical strain, the need for temporary rest during the tightening process may be reduced. As a result, productivity targets become more attainable, and the overall workflow becomes safer and more ergonomic.
Based on the research conducted to propose a redesign of the work platform height during the workpiece tightening activity at PT. Xyz, using the Rapid Entire Body Assessment (REBA) and Quick Exposure Check (QEC) methods, it was found that the current working posture poses a high risk. The REBA assessment yielded a score of 10, and the QEC showed an exposure score of 61%, both of which classify the activity as high-risk. These findings clearly indicate the need for immediate ergonomic intervention.
Anthropometric data analysis from the population unit at the CNC FH8800 workstation revealed that the ideal work platform height should be 64.3 cm, in contrast to the existing height of 120 cm. A height reduction of 55.7 cm is therefore recommended to meet ergonomic standards. This change is expected to improve operator posture, reduce fatigue, and ultimately increase productivity, as the adjusted height better aligns with the workers' anthropometric characteristics.
However, this study has several limitations. First, the sample size was limited to only six operators from a single CNC FH8800 production line, which restricts the generalizability of the findings to broader industrial settings. Second, the research was conducted over a short observation period, without longitudinal measurements to assess the long-term impact of the ergonomic design intervention.
Therefore, further research is needed involving a larger and more diverse sample across different industrial sectors. Future studies should also include long-term evaluations to measure the sustained effects of ergonomic improvements on worker health, safety, and productivity.
[1] Lu, H., Huang, K., Azimi, M., Guo, L. (2019). Blockchain technology in the oil and gas industry: A review of applications, opportunities, challenges, and risks. IEEE Access, 7: 41426-41444. https://doi.org/10.1109/access.2019.2907695
[2] Nyameboame, J., Haddud, A. (2017). Exploring the impact of outsourcing on organizational performance. Journal of Global Operations and Strategic Sourcing, 10(3): 362-387. https://doi.org/10.1108/jgoss-01-2017-0001
[3] Esima, O.V., Wordu, S. (2019). Overcoming the challenges of logistics outsourcing in selected oil and gas companies in rivers state. International Journal of Scientific Research and Management, 7(3): 959-971. https://doi.org/10.18535/ijsrm/v7i3.el06
[4] Majstorović, V.D. (2022). Application of Industry 4.0 model in Oil and Gas companies. Journal of Engineering Management and Competitiveness, 12(1): 77-84. https://doi.org/10.5937/jemc2201077m
[5] Hidayat, A.R. (2023). Analisa waktu optimasi perawatan mesin CNC milling dengan pendekatan value stream mapping serta perbaikan dengan failur mode and effect analysis pada mesin CNC milling. Jurnal Rekayasa Mesin, 18(3): 345-354. https://doi.org/10.32497/jrm.v18i3.4099
[6] Yanto, F.Z., Sutrisno, S. (2023). Analisis postur tubuh operator pada saat bekerja menggunakan metode ovako working analysis system (OWAS). Satuan Tulisan Riset dan Inovasi Teknologi, 7(3): 283-291. https://doi.org/10.30998/string.v7i3.14748
[7] Suarjana, I.W.G., Pomalingo, M.F., Parhusip, B.R. (2022). Penerapan ergo-mechanical design sebagai upaya peningkatan kualitas kesehatan pekerja CV.Victorina. Jurnal Abdimas Jatibara, 1(1): 73-82. https://doi.org/10.29241/jaj.v1i1.1121
[8] Suyetno, A. (2022). Pengaruh penggunaan simulator CNC terhadap hasil belajar mata kuliah CNC selama masa pandemi Covid-19 di Jurusan Teknik Mesin Universitas Negeri Malang. Jurnal Teknik Mesin dan Pembelajaran, 5(1): 7-16. https://doi.org/10.17977/um054v5i1p7-16
[9] Wijaya, D.K., Suprijono, H., Nugroho, D.S. (2020). Optimasi proses cutting mesin CNC router G-weike WK1212 dengan metode full factorial design dan optimasi plot multi respon. Jurnal Pasti, 14(1): 1-14. https://doi.org/10.22441/pasti.2020.v14i1.001
[10] Panggabean, H.R. (2024). Experimental Study of Adaptive jig development to facilitate metal welding learning. Journal homepage: http://iieta.org/journals/ijcmem, 12(4): 441-451. https://doi.org/10.18280/ijcmem.120413
[11] Restuputri, D.P. (2017). Metode REBA untuk pencegahan musculoskeletal disorder tenaga kerja. Jurnal Teknik Industri, 18(1): 19-28. https://doi.org/10.22219/jtiumm.vol18.no1.19-28
[12] Maksuk, M., Amin, M., Jaya, A. (2021). Edukasi dan latihan peregangan otot dalam mengantisapi keluhan muskuloskletal pada penenun tradisional. Abdi: Jurnal Pengabdian Dan Pemberdayaan Masyarakat, 3(1): 83-88. https://doi.org/10.24036/abdi.v3i1.94
[13] Nurzikiresa, R., Janari, D. (2021). Perancangan meja kerja adjustable berdasarkan analisis risiko postur kerja pada karyawan warehouse (Studi kasus PT. Mataram Tunggal Garment). Buana Ilmu, 5(2): 69-88. https://doi.org/10.36805/bi.v5i2.1504
[14] Siswadi, S., Nugroho, A. (2021). Pengembangan desain mesin opak jepit yang ergonomis dan sesuai keinginan konsumen dengan metode quality function deployment (QFD). Tecnoscienza, 5(2): 257-272. https://doi.org/10.51158/tecnoscienza.v5i2.433
[15] Zahcril, S.S.N., Salsabila, K.Y. (2022). Perancangan kursi dan meja laptop yang ergonomis pada sistem CAD. Jurnal Optimasi Sistem Industri.
[16] Aziz, M., Saraswati, R., Supratman, U.W.R. (2022). Optimalisasi parameter mesin CNC milling 3 axis terhadap waktu produksi dengan menggunakan response surface methodology. Formosa Journal of Applied Sciences, 1(4): 293-304. https://doi.org/10.55927/fjas.v1i4.1089
[17] Hailu, W., Getahun, M., Mohammed, A., Nurahmed, N., et al. (2020). Assessment of back pain and disability status among automotive industry workers, in Ethiopia.International Journal, 6(8): 301. https://doi.org/10.18203/issn.2454-2156.intjscirep20203113
[18] Abas, N.H., Zamzam, M.S.S., Mohamad, H. (2020). Work-related musculoskeletal disorders (WMSDS) survey among workers at two precast concrete plants in Johor, Malaysia. Journal of Academic Research in Business and Social Sciences, 10(5): 843-856. https://doi.org/10.6007/ijarbss/v10-i5/7254
[19] Reville, R.T., Schoeni, R.F. (2001). Disability from injuries at work the effects on earnings and employment. No. DRU-2554.
[20] Sears, J.M., Fulton-Kehoe, D., Hogg-Johnson, S. (2021). Initial return to work and long-term employment patterns: associations with work-related permanent impairment and with participation in workers' compensation-based return-to-work programs. American Journal of Industrial Medicine, 64(5): 323-337. https://doi.org/10.1002/ajim.23233
[21] Scott-Marshall, H.K., Tompa, E., Wang, Y., Liao, Q. (2014). Long-term mortality risk in individuals with permanent work-related impairment. Canadian Journal of Public Health, 105: e330-e335. https://doi.org/10.17269/cjph.105.4535
[22] Yusof, A., Shalahim, N.S.M. (2020). Investigation of ergonomic risk factors among male workers in a medical manufacturing company in Northern Malaysia. Malaysian Journal of Public Health Medicine, 20(Special1): 167-175. https://doi.org/10.37268/mjphm/vol.20/no.special1/art.697
[23] Weerdesteijn, K.H., Schaafsma, F., Bonefaas-Groenewoud, K., Heymans, M., Van der Beek, A., Anema, J. (2020). Predicting return to work after long-term sickness absence with subjective health complaints: A prospective cohort study. BMC Public Health, 20: 1095. https://doi.org/10.1186/s12889-020-09203-5