Ina’am Fathi*![]() | Farah N. Ibraheem
| Farah N. Ibraheem![]() | Sahar L. Qaddoori
| Sahar L. Qaddoori![]() | Qutaiba I. Ali
| Qutaiba I. Ali![]()
© 2025 The authors. This article is published by IIETA and is licensed under the CC BY 4.0 license (http://creativecommons.org/licenses/by/4.0/).
OPEN ACCESS
Water management in the urban environment remains an acute problem, as many cities around the world suffer from a critical shortage of water and constant problems with water supply infrastructure. It becomes crucial to use devices that regulate the intake of water and use the common developments in technologies to manage the water consumer adequately. The general idea is that users' daily water consumption can be measured in real time and, by alerting the consumers, changes in behavior can be promoted. This proposed research focuses on addressing the current shortcomings in urban water usage management using the latest innovations in information technology and the Industrial Internet of Things (IIoT). It examines how sensors, data analytics, and automation as the components of IIoT can control urban water usage through Wi-Fi networks efficiently. Furthermore, a protective model was built to safely guarantee data transfer to the cloud. Also, for more user awareness about water consumption trends, a predictive model was constructed. Finally, for system performance analysis in terms of packet end-to-end delay, throughput, and scalability, this paper used the OPNET model to simulate the system and the result was supported by a case study carried out in Al- Tamim neighborhood, Mosul city. The results showed that building a water usage monitoring system using Wi-Fi network and resource-constrained devices like Xiao ESP32C3 and YF-S201 water flow sensor offers an efficient, secure, and cost-effective water monitoring system.
IIoT, Wi-Fi, water consumption management, urban environment, wireless sensor network (WSN), OPNET
The continuations of climatic changes over the past years have direct consequences on rainfall and hence on water resources so it is scarce in many places of the globe today [1]. Due to the direct effect of water on many fields such as agriculture, industry, and economics, water plays a direct role in the survival of life on planet Earth. The Food and Agriculture Organization (FAO) of the United Nations has stated that water scarcity is among the biggest problems faced in the twenty first century [2, 3]. On that basis and given the problems outlined and the growing need for water to be managed, it is important to give consideration to water management.
The commission of using water has become excessive, while the population has grown tremendously; this has led to few available sources of water that are safe for human consumption. This shortage affects people’s quality life through personal lifestyles hence the need to work towards effective control measures regarding water usage and its impacts on the people and the economies of nations. Most countries rely on manual meter readings to monitor water usage in homes, typically conducted once a month. This method often results in a lack of awareness among consumers about their monthly water usage and increases the likelihood of errors in meter readings. A viable alternative to address these issues is to leverage recent technological advancements to create an interactive water usage monitoring system [2, 4].
The improvement of computer networks and electronics creates a smooth integration within different devices, which share data incessantly, which is a sign of the ‘Internet of Things’ (IoT). Even though IoT technology was nominated with commercial orientation in mind the Industrial Internet of Things (IIoT) is industrial-oriented [5]. IIoT technology combines different data source including outputs of sensors, inputs from users, availability and expertise of service providers to give real time output with elegant first time right repair. This portrays the evolution of technology through the next industrial revolution known as the Industry 4.0 by Industrial Internet of Things [5]. Furthermore, IIoT is extending and revolutionizing industries more than the standard IoT by satisfying such complicated specifications [6].
However, adopting connected machines and devices through (IIoT) is revolutionizing utility operations and enabling smarter decision-making [7]. By implementing a smart water management system using IIoT, homeowners can not only save water but also decrease their utility bills and donate to environmental conservation efforts [8]. Thus by integrating IIoT in daily household water consumption, homeowner can achieve the valuable resource [9].
Despite increasing awareness of global water scarcity, urban environments continue to struggle with the practical implementation of real-time water consumption tracking. Current water monitoring systems in many cities rely on monthly manual meter readings, which lack immediacy and fail to detect anomalies such as leaks or excessive consumption in real time. This not only hinders household-level conservation efforts but also delays maintenance and resource allocation at the municipal level.
From a technological standpoint, many existing solutions either depend on expensive, proprietary infrastructure or lack scalability and security — especially when applied across large urban areas with varying socio-economic conditions. Additionally, while some systems support remote monitoring, they often overlook integration with low-cost, power-efficient IIoT devices and robust wireless network simulations. These gaps emphasize the need for a practical, secure, and cost-effective system that leverages existing Wi-Fi infrastructure and supports predictive analytics for proactive water management.
This research aims to address these gaps by proposing a system based on Xiao ESP32C3 microcontrollers and YF-S201 sensors, integrating cloud-based analytics and real-time alerts, supported by OPNET-based performance analysis. The proposed system not only enables detailed water consumption insights but also helps detect abnormal usage, thereby encouraging conservation and minimizing water loss.
This paper presents the continuous water consumption monitoring system using embedded devices, with data transferred wirelessly using Wi-Fi networks and storing the data securely in a cloud server for generating general water consumption statistics. In this system, the user can monitor the amount of water being utilized in a day or an hour. For each user or household there will be a database that records the user's daily consumption. This database will be the main reference in calculating the user's daily consumption. Through this database, the user's daily consumption can be predicted in the future. So that one day, if the measured consumption level is high, it is possible to send an alert to the person warning him that the consumption rate is high compared to the previous recorded and usual consumption. In this way, if the user's actual consumption isn’t within the usual limits, he will realize that there is a defect somewhere that led to increased consumption, and it may be a leak in one of the pipes. This can aid to save water from wasting and prevent financial loss. Finally, for more wide range of analysis, in this project Al-Tamim neighborhood in Mosul city is examined as a case study for analyzing network performance criteria to implement efficient water usage monitoring system using OPNET simulator. The key contributions of the research are:
This research is organizes as follows: Section 2 includes related works. Section 3 contains proposed system description. Section 4 declares the research methodology including hardware and software components selection. Section 5 includes the system initialization and deployment. Section 6 comprises the results obtained and discussions. Section 7 defines common security threats in IoT-based water usage monitoring systems. Section 8 explains the process of building an AI model for water usage prediction. Section 9 contains the comparison of proposed system with previous works. Finally, Section 10 covers the conclusions.
In this research, the benefits of IoT in water usage management systems we'll be examined, with a focus on system performance optimization, and applicability of implementing in real-world situation, while also taking into consideration the security risks that must be addressed to protect the system against potential threats. The technical solutions for the proposed measurement of water usage are maintained on an IoT. Also the proposed system developed a prediction model to predict customer’s usage and explore any anomalies in consumption for minimizing wasting of water. So, for comprehensive comparison, we review some articles concerning these topics.
In the study [10], the authors implemented an IoT platform into a smart water metering system to improve the expanded use of water. Consumers would be able to retrieve water consumption data derived from a cloud database through a web browsers or handheld device. Likewise, in the study [11], the authors developed a hardware/software platform to incorporate IoT technologies to create a smart residential water network. This platform allows mentioning of the data collecting and processing whether it is in the Fog or Cloud context so that the monitoring and analyses can be performed adequately. The authors also presented the initial results of the experiment that took two months of operation for data collection. For the researches with smart features, in the study [8], the authors described the design, development and testing of a smart system useful for water consumption monitoring, leakage detection and detection of interruptions in different water distribution. The solution was especially explained for smart building and the IoT based technique was applied.
The authors [12, 13] designed systems that enable the tracking of water usage and consequent billing through IoT sensors. These systems offer data on water usage in real-time and via an Android application. They can also inform home users on their usage of excess water through a message on Telegram or notification on the user’s phone or via their email.
With the development of artificial intelligence (AI) technologies, researchers have turned to benefiting from these technologies and integrating them with water usage monitoring systems in order to build smart systems capable of predicting the quantities of water consumed. As the study shows [4], the authors proposed a low-cost smart water tracking system able to predict water usage in a household activity. In the study [14], an IoT smart meter had been designed and for machine learning modeling, a predictive model in python using data merged from different institutions have been built. The authors [2] developed the smart water usage measurement system that allows real time visualization of water usage. Likewise, they presented a leakage detection algorithm which uses the rules, history records, and user position to find leakage accurately.
Furthermore, communication technologies have been addressed in other research in order to identify the best techniques that give better performance to the system. Recently, several companies have started implementing technology-based home water consumption metering, where Low-Power Wide-Area Network (LPWAN) communication protocols such as LoRa, Narrowband-IoT (NB-IoT), and licensed protocols including SigFox are being used for metering the water consumption at home [15]. In the study [16], the authors suggested using ZigBee with a mesh topology so as to interconnect a large number of devices for efficient transmission and reception of data.
Table 1 summarizes the related works main contributions and research objectives of various previous research works in this domain.
Table 1. Related works main contributions and objectives summary
|
Ref. No. |
Hardware |
AI |
Security |
Objective |
Network Configuration Analysis |
|
[10] |
ESP8266 |
N\A |
N\A |
Visualize water consumption. |
N\A |
|
[11] |
ESP-32 |
N\A |
N\A |
Processing analysis of water data and monitoring. |
N\A |
|
[8] |
Texas Instruments MSP430G2553 MCU |
N\A |
N\A |
Smart system for remote monitoring of water consumption, detecting leakages and interruptions on water distribution. |
N\A |
|
[12] |
ESP-8266 |
N\A |
N\A |
Detecting water usage, billing the user and alert for abnormal states. |
N\A |
|
[13] |
ESP-8266 |
N\A |
N\A |
Store the water consumption data on the a server and displayed on a client's Smartphone in real time as well as alert system. |
N\A |
|
[4] |
ESP-8266 |
Bayes theorem to calculate the amount of water used |
N\A |
Assessing people’s daily water intake by applying a decision support model to predict the likelihood of home water usage. |
N\A |
|
[14] |
ESP-8266 |
A predictive model was built using Random Forest algorithm |
N\A |
Monitoring the household water consumption with a machine learning modeling and predictive model in python using data merged from different institutions. |
N\A |
|
[2] |
ESP-8266 & raspberry |
Leak detection algorithm using historical context |
N\A |
Real time water measurement consumption system with a leak detection algorithm based on rules, historical context, and user location |
N\A |
|
[16] |
Simulation Riverbed Modeler Network Simulations |
N\A |
N\A |
Introduces a number of claimed smart utility meter systems together with their exemplary Connect Networks. |
different network topologies, examined for efficient system establishment. |
Through a comprehensive review of previous works related to water consumption monitoring systems(as noticed in Table 1), some Lacks in the proposed systems can be concluded:
So, to overcome the shortcomings of previous works, this paper proposes to build an efficient, secure, intelligent, and cost-effective (using resource constrained Xiao ESP32Ce devices) system to monitor and manage water consumption and keep water from waste in urban environments.
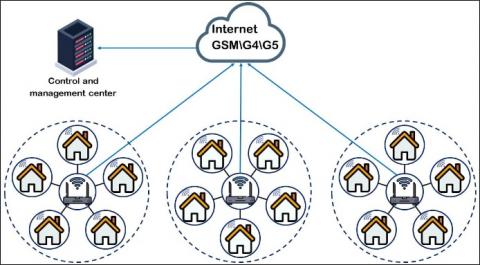
This paper presents the development of an efficient and secured wireless water usage monitoring system. The proposed system, is responsible of gathering the homes’ consumption data and storing in a cloud server for analyzing and processing. Figure 1 illustrates the suggested system’s framework [10].
Figure 1. The proposed water monitoring system framework
In Figure 1 there is water flow sensor that detects the customer's consumption and is incorporated in an embedded platform. It may be located on the main water pipe of customer's home and has a wireless adaptor that permits to connect with the adjacent particular gateway. The water monitoring system records the amount of water used by the distributed homes, therefore, means that many dedicated gateways should be positioned in the monitoring region. These gateways continually take consumption data from metering devices at regular intervals (for instance, on a per minute basis), store the results in files, and transmit these files to a cloud server which oversees the operation of the service on specific intervals of time (for instance, every 15 minutes). The cloud server analyzes the files coming from each gateway, extracts some data regarding individual customers, and stores them into customers’ databases. After that, the data collected through measurements is used to produce statistics and to reveal eventual discrepancies in water consumption. The following pseudocode describes the workflow for the proposed system:
|
Procedure DesignSmartWaterMeters: Initialize SmartWaterMeter array Initialize CentralMonitoringPlatform For each SmartWaterMeter in homes: Install SmartWaterMeter Connect SmartWaterMeter wirelessly via Wi-Fi to CentralMonitoringPlatform While True: For each SmartWaterMeter: RecordWaterConsumption() MonitorWaterConsumption() If AbnormalMeasurement(): NotifyUser() End Procedure |
The development for the proposed efficient and secured water usage monitoring system based on IIoT architecture covers the tow following important aspect:
1) Hardware and software components selection: This refers to the process of choosing an appropriate framework or platform for implementing the protected water usage tracking system. The selection process involves considering factors such as hardware and software requirements, and interoperability of the platform.
2) Improvement of network performance: This involves evaluating the performance of different network configuration used in the secured water usage monitoring system. Performance analysis may include measuring metrics such as packet end-to-end delay and throughput. This analysis helps in selecting the most efficient network configuration for the system.
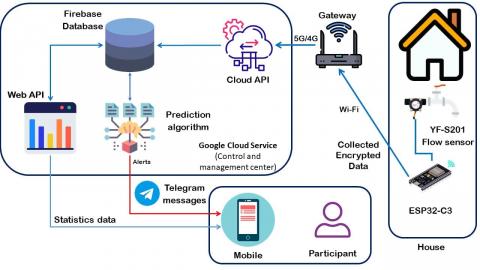
Figure 2 shows the proposed system hardware and software architecture. This system includes the main elements of a secured smart water tracking system which are:
Sensors and IoT Technology: These devices serves a main purpose of data acquisition since flow meters of water and measurement of water usage fall under their domain.
Data Securing: The way that helps to increase protection degree of the monitoring system with respect to different attacks and weaknesses. It encompasses methods like encryption technique and digital signature method. It seeks to improve on the security of the system and protect it from insecurity.
Data Transmission and Communication: The collected data is secured and stored in the database and then transferred to a monitoring and control server or a cloud platform to access through wireless communication in real time.
Data Analytics: Upon receiving these data, advanced algorithms determining patterns, trend, anomalies and issues connected with water usage is executed.
User Interface: Water monitoring system can be operated from website using internet browser or from mobile applications. It enables the user to access live information streaming, notifications and monitor water resources productivity. The mobile application is thus the most applicable interface since the mobile phones are easily accessible.
Figure 2. Proposed system hardware and software architecture
4.1 Hardware components selection
The design of the proposed device should be characterized by simplicity, low cost, and also be open source so that it is accessible to everyone. It should also be inexpensive for water supply companies. The hardware implementation design of the proposed system is centered around sensing unit which composed of three main devices: water flow sensor, microcontroller (include communication unit) and battery.
(1) Water flow sensors: Flow meters are fitted on water mains so as to monitor the flow rate and total quantity of water that passes through them continually. The type of water flow sensor used in this study was a YF-S201 Hall Effect water flow sensor, Model G½, as shown in Figure 3. From the datasheet of the manufacturer, it is found that the maximum pressure of water that the sensor can handle is 253.82 PSI and the flow range of water is 1 liter/minute to 30 liter/minute. The sensor comprises a magnetic hall-effect that produces an electric pulse every time the internal pinwheel turns caused by the water flow [17].
Figure 3. Water flow sensor
(2) Microcontroller: A cost-effective Xiao ESP32C3 (Figure 4) is used as a main microcontroller unit for data collection, processing and transmitting. It can be programmed using the Arduino IDE or other development platforms to read sensor data and send it to a cloud service since it supported by WiFi/Bluetooth communication unit. Furthermore, this device has built-in battery charging chip [18, 19].
Figure 4. Xiao ESP32C3
The schematic circuit for flow meter connection to the Xiao ESP32C3 is shown in Figure 5.
Figure 5. Schematic circuit for flow meter connection to the Xiao ESP32C3
(3) Battery: A battery is an essential component for ensuring that the water flow sensor and microcontroller can operate independently of a wired power source. This allows for greater flexibility in placement and ensures that the system can continue to function during power outages. Figure 6 shows battery connection to the Xiao ESP32C3.
Figure 6. Schematic circuit for battery connection to the Xiao ESP32C3
(4) Power Source: in the case of water usage monitoring system, this select of the right power source is very important in enhancing the operations of the system. That means consumers can have as much freedom as they want when sourcing for the most appropriate kind of power to install. There are two common options as follows:
Direct Wall Power Supply: The easiest implementation for the users to accomplish is to plug the system directly to the wall power supply, particularly if the sensor is placed close to an electrical outlet meant for connection to the system. This way, the device is always on and does not require to be recharged or change batteries over and over again.
Solar Power: Solar power is perfect for making some enhanced and solitary energy system particularly in outside or isolated areas [20]. A small solar panel can recharge a battery in the daytime thus providing a cheap, clean and efficient source of energy. Such arrangement is convenient for persons with environmental sensitivity or where normal power outlets are unavailable. Furthermore, both powers also can connect to the built-in battery charging chip of the Xiao ESP32C3, under the condition of switching between battery power and external power supply, this design guarantees the continuous running of the water flow sensor.
4.2 Software components selection
Google Cloud Services: Google Cloud Services offer a range of cloud-based solutions that provide scalable and flexible infrastructure for applications. For implementing water usage monitoring system, specific Google Cloud Services were employed to handle data storage, processing, and automation tasks. This component receives the data obtained from the “Edge Gateway” component, which is sent every time.
Realtime Database: Firebase Realtime Database is a cloud-hosted NoSQL database that enables real-time data synchronization across clients. It is chosen for its ability to provide instant updates to connected devices, ensuring users receive timely water usage data.
Serverless Functions: These are serverless compute solutions that run backend code in response to events. They were utilized to process sensor data, send alerts, and manage routine tasks without the need for managing servers.
Cloud Scheduler: Cloud Scheduler is the cron job for scheduling the fully managed tasks. It has previously been applied to initiate periodic functions such as data collection and system management so that it continues to run uninterruptedly.
User Alert and Notification System: So as to avoid missing time sensitive events in water consumption patterns or leaks, the research incorporates an alert and notification system to alert users on important events that may need their attention. To deliver these notifications, the research employs the Telegram messaging app since it is fast, reliable, and has a large user base. For the purpose of this project a new Telegram bot with a focused set of commands was developed in order to work as the interface between the monitoring system and the user. This bot is also designed to be able to send instant messages right to the user’s device, so that they are alerted right away of any issues that have been identified as critical by the system. Upon receiving the notifications, the user would take the following actions to avoid water wastage:
4.3 Cost analysis
The proposed system was designed with cost-conscious deployment in mind to suit urban-scale implementations involving thousands of nodes. Table 2 summarizes cost comparison of hardware components for IIoT Water Monitoring Systems.
Table 2. Cost comparison of hardware components for IIoT water monitoring systems
|
Component |
Proposed System (ESP32C3 & YF-S201) |
Alternative 1 (ESP8266 & YF-S201) |
Alternative 2 (Raspberry Pi & Digital Flow Sensor) |
|
Microcontroller Unit |
Xiao ESP32C3 – $5.15 |
ESP8266 – $4.50 |
Raspberry Pi Zero W – $10.00 |
|
Water Flow Sensor |
YF-S201 – $1.97 |
YF-S201 – $1.97 |
Digital Flow Sensor – $8.00 |
|
Communication Module |
Built-in Wi-Fi/Bluetooth (ESP32C3) |
Built-in Wi-Fi (ESP8266) |
External Wi-Fi dongle – $3.00 |
|
Power Supply (battery) |
Li-ion 3.7V – ~$3.00 |
Li-ion 3.7V – ~$3.00 |
USB Power Adapter – $4.00 |
|
Total (per node) |
~$10.12 |
~$9.47 |
~$25.00 |
Table 3. Cost comparison with market-available smart water metering solutions
|
Solution |
Product Name / Provider |
Unit Cost (Approx.) |
Key Features |
Notes |
|
Proposed System |
Xiao ESP32C3 + YF-S201 |
~$10.12 |
Real-time tracking, Wi-Fi, cloud alerts, AI prediction |
Custom, open-source, scalable |
|
Flume Smart Water Monitor |
Flume 2 Smart Water System |
~$249 |
Wireless ultrasonic sensor, app support, leak detection |
High cost, proprietary, indoor use only |
|
Moen Flo Smart Water Monitor |
Moen Flo by Moen |
~$499 |
Full shutoff valve, app, real-time alerts |
Expensive, intended for whole-home plumbing |
|
StreamLabs Smart Water Monitor |
StreamLabs Monitor |
~$199 |
Wi-Fi, app dashboard, leak detection |
Indoor installation, limited integration |
|
Aquarius Spectrum AQS-SYS |
AQS-SYS Leak Detection System |
~$600+ |
AI, ultrasonic leak detection, NB-IoT connectivity |
Industrial-grade, not consumer-oriented |
As shown in Table 2, the combined cost of each sensor node (ESP32C3 + YF-S201 + battery) is ~$10.12, making it:
•Comparable in cost to ESP8266-based systems, but with added benefits of lower power consumption, Bluetooth capability, and secure OTA updates.
•Significantly cheaper than Raspberry Pi-based setups, which, while more powerful, are overkill for simple water flow sensing and are less power-efficient.
Given the economic diversity of urban households and the goal of minimizing infrastructure investment for water utilities, the Xiao ESP32C3 and YF-S201 pairing provides an optimal balance of affordability, reliability, and feature set.
The system’s low-cost design supports scalability, enabling deployment in thousands of homes while staying within tight budget constraints. This makes the solution economically viable not only for municipal projects but also for private housing complexes and developing regions.
A second comparison with available commercial solutions (as shown in Table 3) will strengthen the economic justification and demonstrate the practical competitiveness of our proposed system.
The proposed ESP32C3-based system is significantly more cost-effective than any of the currently available smart water monitoring solutions in the market. While commercial systems like Flume, Moen Flo, or StreamLabs offer features like app dashboards and leak alerts, their unit prices range from \$199 to over \$500, making them impractical for mass deployment in urban or resource-constrained environments.
In contrast the proposed design uses open-source hardware, enabling low-cost mass production. It supports basic to intermediate functionality, including real-time monitoring, cloud integration, and predictive modeling, at <5% of the market cost. It is more suitable for municipal-scale deployment or developing regions, where affordability, power efficiency, and open access are critical.
The steps that are taken to initialize and deploy the system are illustrated in Figure 7.
Figure 7. Initialization and deployment process for proposed system
5.1 Calibration process
YF-S201 water flow sensor was required a calibration in order to get the correct measurements of water usage. The calibration itself is a very important phase and, thus, has to be performed before one start running the microcontroller [21].
The basic working of the sensor involves producing pulses proportional to the volume of water flow passing through it. The relation between pulse and liter is given by the following equations [21]:
Pulse frequency (Hz)=7.5Q (1)
where, Q is flowing rate (L\min):
Q=Av (2)
and A is the area of the pipe or channel (m2), v is the velocity of the liquid (m/s).
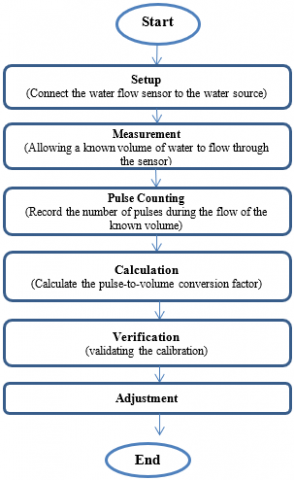
To establish a precise relationship between the pulse count and the actual volume of water, a calibration process is undertaken. This process involves the steps showed in Figure 8.
Figure 8. Calibration process flow work
As shown in Figure 8, the first step is to setup the water flow sensor by connecting it to a controlled water source where the flow can be measured accurately. The second step is to begin the measurement by allowing a known volume of water, such as 10 liters, to flow through the sensor. It is essential to use a significant volume to improve the accuracy of the calibration. After that, the third step employs the pulse counting which represents the recording of the number of pulses generated by the sensor during the flow of the known volume. Then the fourth step is the calculation process which calculates the pulse-to-volume conversion factor by dividing the number of pulses by the volume of water that has flowed through. This factor represents the number of pulses per liter (or other chosen volume unit). To validate the calibration, a Verification step is needed. This five step repeats the measurement with different volumes and ensure that the calculated conversion factor consistently predicts the actual volume. And finally, if discrepancies are found the Adjustment step is very important which adjusts the conversion factor accordingly and retest until the sensor's readings align closely with the known volumes. This process is very crucial because while collecting the water usage in the right period, suitable calculations to correspond with, the calibration factor of the sensor. Due to proper tuning of the sensor, water usage monitoring system provides user with accurate detail of the amount of water in use in a way that would assist the users in adopting better practices for water usage.
5.2 System integration and testing
The last phase is known as the integration phase whereby the ‘hardware and software’ formation of a comprehensive system by uniting the basic units with the cloud services and the Web application. This process includes the following steps:
Integration of Components: Wiring of the micro controller for the flow sensor is followed by checking its appropriate interfacing with the micro controller. Connect an AC power as your battery or power source for a constant power supply of the system.
Firmware Development: Compile the firmware and upload it on to the microcontroller which has code for reading sensor data, calculate the flow of the water and send the data to the cloud.
Cloud Configuration: Installed the Firebase Realtime Database, serverless functions as well as Cloud Scheduler for data storage, processing, and tasks scheduling.
Web Application Setup: Create the web application with React and connect it to Firebase to pull actual-time data.
End-to-End Testing: detailed tests on all the system components should be run so that every bit of them will work perfectly well with others. This also involves confirming whether there is data transfer from the sensor to the database then to the web application.
5.3 Data security and privacy
The exponential growth in wireless network vulnerabilities and attacks makes the wireless local area network (WLAN) security a critical issue [22]. Given the importance of user data security and privacy, the following measures are implemented:
Encryption: secure communication protocol HTTPS is a seems to be a suitable choice for a secure way to authenticate the meters with the cloud platform [23]. It should be used on all data connections of the microcontroller, the cloud services and web applications, so as to provide encryption of the data during transmission.
Authentication: Ensure there is an authentication to the web application and the database, in other words, put measures in place to allow only authorized user access the web application and the database.
Database Rules: Secure Firebase Realtime Database so that the data cannot be changed.
5.4 Alert system implementation
It is characteristic that the alert system is a significant part for informing users about the extraordinary water consumption. This system is depending on:
Threshold Setting: Setting allowable levels of usage that are above which an alert must be produced. These thresholds can be set dependent on the users, as well the statistics that have been recorded in the system.
Alert Logic: There is a need to incorporate logic in the serverless functions to check when the thresholds are reached in order to begin the alert process.
Notification Delivery: Connect the Telegram bot to help users to notify them with the problem occurred at the device used.
5.5 User interface design and usability testing
The user interface (UI) design is focused on providing an intuitive and accessible experience:
UI Prototyping: Design the structures of the web based application by developing such wireframes and prototypes of the layouts as well as the users’ flows, as described in Figure 9.
Figure 9. Web based application for users’ flows
Usability Testing: Conduct usability testing sessions with potential users to gather feedback on the UI design and make necessary adjustments.
To create an interactive and easy-to-use interface, React JS and Material-UI (MUI) were selected as the primary technologies for front-end development.
The user interface (UI) design process focused on usability, accessibility, and minimal cognitive load to ensure that users with limited technical expertise could effectively interact with the system. Prototypes were developed using Figma and later implemented in a web-based dashboard with responsive design features. The interface consists of three main modules:
Dashboard Overview: Displays real-time energy consumption data, system status, and alerts using clear visualizations like line graphs, gauges, and color-coded indicators.
Control Panel: Allows users to manually or automatically adjust power distribution settings, supported by tooltips and safety confirmations to prevent erroneous inputs.
Historical Reports and Predictions: Enables users to view historical performance metrics and predicted energy trends, presented through interactive charts and filterable time ranges.
Usability testing was conducted with a group of potential end users, including facility managers and technical staff, to refine layout, navigation flow, and data visualization components. Feedback was incorporated to improve intuitiveness, reduce information clutter, and support localization for Arabic language users.
5.6 System operation and performance analysis
This step comprises two phases: system experiment, and system performance analysis.
5.6.1 System experiment
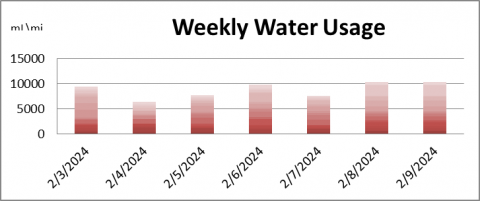
This step involves running the system to collect consumption data, store it on the cloud, and analyze it in order to build a predictive system whose mission is to forecast future consumption. This predictive system is based on consumption data collected periodically, which reflects the daily consumption of the house. Figure 10. Shows the data collected for weekly water usage.
Figure 10. Weekly water usage collected data
5.6.2 Performance analysis process
Technological solutions based on IIoT need wireless communication technologies, through which the devices can receive and send data effectively [16]. There are several wireless approaches that can be used in building an efficient and secured water management systems. Some of these alternatives include: Bluetooth Low Energy (BLE), ZigBee, Wi-Fi and finally Cellular networks. The choice of wireless approach will depend on the specific requirements of the water monitoring system, such as the range of communication, data rates, power consumption, and cost. It is important to carefully consider the trade-offs between these factors when selecting the most appropriate wireless technology for the application. likewise, Wi-Fi is used due to its long range (up to 100 m) and a transmission packaged of up to 7Gbps [14].
To achieve optimal network performance and cost-effectiveness for the water tracking system, it is essential to conduct a sequence of tests to identify the most suitable settings. This process may involve analyzing various network configurations to determine the most reliable and efficient options for data communication. The purpose of the simulation is to assess the feasibility of implementing our proposed system in real-world scenarios. Several traditional network simulators are commonly used by researchers for wireless sensor network (WSN) simulation, with OPNET being the most popular. We utilized OPNET version 14.5 to carry out our work.
The system was implemented for the purpose of analyzing performance on the city of Mosul as a case study and identifying the left side in the Al-Tamim neighborhood area, where the neighborhood was divided into sectors. As for houses in the city of Mosul, their areas range between 100 m2, 200 m2, and 300 m2. Currently, most citizens tend to buy houses with small areas, i.e. around 100 m2. The neighborhood was divided into sectors with areas 100 m´100 m for each sector. Therefore, within these areas, we assume that there are about 40 houses, and each house consists of two floors, so the number of water meters will be 80, given that each floor has its own meter. As measured by google maps, the approximate area of Al- Tamim is about 700000 m2 [24]. The full area of Al-Tamim neighborhood was divided into 70 sectors. So, theoretically, for the full area we had to apply about 70 access point as shown in Figure 11. Each access point is associated with 80 meters.
Figure 11. Tamim neighborhood map
The performance evaluation of the simulated system is performed in various scenarios based on a 1-minute update interval and different speeds of the IEEE 802.11g Wireless Local Area Network (WLAN) standard to estimate optimal network performance criteria. To ensure accurate results and for simulation simplicity, the processing speed of each ESP32-C3 node is assumed to be 2000 packet/sec [25]. The simulation settings for the simulation test requirements are listed in Tables 4 and 5. While the simulation model for each sector is shown in Figure 12.
Figure 12. The simulation model for each sector
Table 4. The simulation settings for the simulation test requirements
|
Parameters |
Settings |
|
Simulation time (h) for each scenario |
24 |
|
Network span area (m) |
100*100 |
|
WLAN data rate (Mbps) |
11,24,54 |
|
WLAN standard |
IEEE802.11 |
|
Water monitoring node speed (packet/sec) |
2000 |
|
Remote server speed |
Infinity |
|
Update interval (Minute) |
1 |
|
Packet length (byte) |
26 |
|
Node mobility |
Fixed |
Table 5. Additional OPNET simulation parameters
|
Parameter |
Value/Setting |
Description |
|
Retransmission limit |
7 attempts |
Max number of retransmission attempts per packet before drop |
|
Packet error rate |
1.5% |
Simulated error rate due to interference, fading, and hardware limitations |
|
Queue buffer size (packets) |
10 |
Max packets a node can store before dropping due to buffer overflow |
|
Contention window (CWmin/CWmax) |
15 / 1023 |
Range for exponential backoff algorithm in IEEE 802.11g |
|
Propagation model |
Free Space + Log-normal Shadowing |
Models both LOS and non-LOS conditions in urban deployment |
|
Simulation repetition |
5 runs per scenario |
Averaged results for robustness and consistency |
|
Channel access method |
DCF (RTS/CTS disabled) |
Standard IEEE 802.11g mechanism for medium access |
Figure 13. Consumption data packet format
As shown in Figure 13, the packet length is chosen to be 26 byte. Each packet composed of:
The results obtained in the paper represent (concerning the system performance) are: packet end to end time, and the received throughput. These results are obtained on the basis of the most favorable settings of the system. After running many simulation scenarios for update interval of 1 minute and WLAN Data Rate of 11 24 and 54 Mbps, the simulation results show that the best performance is obtained for the speed = 54M as shown in Table 6.
Table 6. The simulation results for update interval of 1min. using better performance parameters
|
Parameters |
Value |
|
IEEE802.11g data rate |
54 |
|
Average packet-end-to-end-delay (ms) |
4 |
|
Throughput (bit/sec) |
371 |
The results in the table above shown that the best results were obtained when the speed = 54M. So, this speed is chosen to test the selected area, 1000 m ´ 700 m, for max. no. of zones that that can be applied in the selected area.
The simulation results for the scenario of the selected speed are listed in Table 7. As shown from Table 7, the Max. no. of zones=55. So, the max. No of water meters=4400 meters.
Table 7. The simulation results for running max. no. of zones
|
Parameters |
Value |
|
Selected IEEE802.11g data rate |
54 |
|
Average Packet-end-to-end-delay (ms) |
10 |
|
Throughput (bit/sec) |
207 |
|
Max. no. of zones |
55 |
|
max. no of water meters |
4400 |
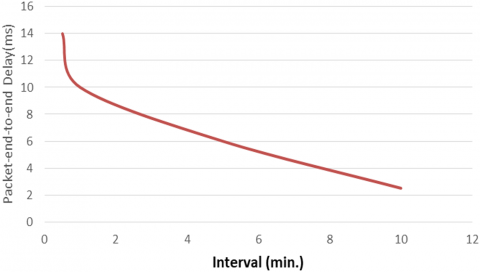
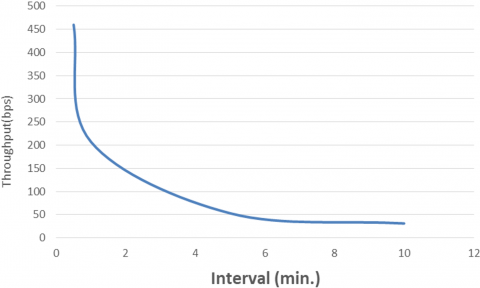
Finally, for more analysis, different transmitting intervals have been tested. The results for this scenario are shown in Figure 14 and Figure 15 respectively. As shown from Figure 14 and Figure 15, the average packet-end-to-end delay and throughput degrade as the transmitting interval increases.
Figure 14. Impact of different transmission intervals on packet-end-to-end-delay
Figure 15. Impact of different transmission intervals on throughput
6.1 Simulation results analysis
The simulation results of the proposed IIoT-based water usage monitoring system were analyzed to evaluate its performance in terms of packet end-to-end delay, throughput, and scalability. The study utilized IEEE 802.11g as the wireless communication protocol and considered both smaller-scale and maximum-scale deployments for the Al-Tamim neighborhood.
Packet-End-to-End Delay: The end-to-end delay values observed in the simulations ranged from 2.5 ms to 10 ms, depending on the deployment scale and network configuration:
These results remain within acceptable limits for water monitoring applications, where real-time performance is not critical. However, delays are expected to increase further in environments with significant interference or additional network traffic.
Throughput: The throughput of the system was found to be 200-400 bits/sec per node, influenced by the density of deployment and the data rates:
•In smaller-scale deployments, the throughput achieved was between 300 bits/sec and 400 bits/sec, close to the theoretical maximum for the given configuration.
•At maximum scale, the throughput dropped to 200-300 bits/sec due to increased node density and traffic contention, which is consistent with typical performance of Wi-Fi networks.
Scalability: The simulation results indicate that the proposed system can support up to 3500-4000 water meters across 55 zones while maintaining acceptable performance levels. However, at this scale, performance degradation becomes noticeable due to:
•Increased contention and retransmissions in the IEEE 802.11g protocol.
•Limited bandwidth and resource allocation per access point.
Beyond this capacity, the system may require additional access points or migration to advanced wireless technologies, such as IEEE 802.11ax, which offers better scalability and spectral efficiency.
Practical Considerations: The results provide valuable insights into the system's practical deployment:
Latency Management: While the observed delays are acceptable for monitoring applications, future extensions of the system to more time-critical use cases would require additional measures to reduce delays, such as optimized routing or Quality of Service (QoS) settings.
Scalability Challenges: The current configuration highlights the limitations of IEEE 802.11g in dense urban environments. Adopting alternative protocols like LoRaWAN or NB-IoT could improve performance for larger deployments.
Energy Efficiency: The throughput and load values suggest that the system's energy consumption could be optimized by batching data transmissions or using power-saving mechanisms in IoT devices.
From the above results discussion, it can be concluded that the revised results validate the feasibility of using IEEE 802.11g for water usage monitoring in urban environments. The system demonstrates reliable performance in moderately dense deployments, with acceptable delay and throughput metrics. For larger-scale implementations, addressing scalability challenges through advanced network designs or alternative communication technologies is critical. These findings provide a robust basis for real-world deployment and further development of IIoT-based solutions in water resource management.
Although alternative protocols such as LoRaWAN, NB-IoT, and ZigBee offer clear advantages in terms of power consumption and scalability, IEEE 802.11g was deliberately chosen for this research based on a set of practical, cost, and deployment-driven factors, which align closely with the project's goals and urban context:
Infrastructure Compatibility: Urban areas typically have widespread access to Wi-Fi infrastructure. IEEE 802.11g operates on 2.4 GHz, which is universally supported by routers and access points in homes and public buildings. This minimizes the need for additional gateways or base stations, reducing infrastructure cost.
Hardware Availability: Wi-Fi-enabled microcontrollers such as the ESP32C3 are readily available, inexpensive, and supported by mature development ecosystems (e.g., Arduino, ESP-IDF). By contrast, NB-IoT modules often require SIM card activation and integration with licensed LTE infrastructure, increasing complexity and cost.
Data Transmission Needs: The proposed system transmits short but frequent packets (e.g., every minute). IEEE 802.11g supports high throughput and low latency, ensuring timely data delivery. Protocols like LoRaWAN, while excellent for low-power transmission, typically operate with longer latency and are less suited to real-time tracking.
Prototype & Research Environment: The system was developed and tested in a university research lab and urban pilot neighborhood (Al-Tamim), where Wi-Fi coverage is already available and stable. This supports rapid prototyping and real-world evaluation without requiring specialized network licenses or proprietary LPWAN gateways.
•Power Trade-offs Are Acceptable: While IEEE 802.11g consumes more power, this is mitigated in this work by:
•Choosing power-efficient ESP32C3 modules with deep sleep modes.
•Using rechargeable Li-ion batteries or solar cells.
•Targeting urban installations where periodic recharging or power access is feasible.
In summary, although IEEE 802.11g is not the most energy-efficient or scalable protocol available, it was selected as the best balance of cost, performance, and implementation feasibility in the context of urban water monitoring using IIoT. The system’s design leaves room for future enhancements where LPWAN solutions could be integrated in hybrid topologies for large-scale deployment.
6.2 System performance under different network topologies
To further validate the robustness of the proposed energy management system, we evaluated its performance under five different network topologies: Star, Mesh, Tree, Ring, and Hybrid (Star-Mesh) as shown in Table 8.
Table 8. System performance under different network topologies
|
Topology Type |
Avg. Latency (ms) |
Packet Loss (%) |
Energy Efficiency (J/task) |
Throughput (Mbps) |
Notes |
|
Star |
42.3 |
1.8 |
0.92 |
8.1 |
Centralized routing; minimal redundancy |
|
Mesh |
39.5 |
1.2 |
0.88 |
8.9 |
High redundancy and fault tolerance |
|
Tree (Hierarchical) |
44.7 |
2.1 |
0.95 |
7.6 |
Vulnerable to parent node failures |
|
Ring |
47.1 |
2.4 |
0.99 |
7.2 |
Increased delay in long-distance hops |
|
Hybrid (Star-Mesh) |
38.6 |
1.0 |
0.86 |
9.3 |
Balanced performance and fault resilience |
As shown in Table 8, the Hybrid topology demonstrated the best overall performance, offering the lowest latency (38.6 ms), lowest packet loss (1.0%), and highest throughput (9.3 Mbps), due to its balanced structure combining centralized coordination with distributed redundancy.
The Mesh topology also performed well in terms of latency (39.5 ms) and energy efficiency (0.88 J/task), thanks to its high fault tolerance and multiple communication paths. In contrast, the Ring and Tree topologies showed higher latency and packet loss, which could be attributed to their sequential communication structure and sensitivity to node failures, respectively.
These results confirm that the system maintains consistent performance across varying network conditions, thereby reinforcing its robustness and suitability for deployment in diverse real-world environments. Future work may include dynamic topology adaptation based on real-time load or failure conditions to further enhance system resilience.
The experimental results presented in Table 9 provide a multi-dimensional assessment of the proposed energy management system under realistic operational conditions.
Table 9. Comprehensive experimental evaluation of the proposed energy management system
|
Test Scenario |
Key Metric |
Observed Value / Range |
Notes |
|
Network Topology Comparison |
Avg. Latency (ms) |
38.6 – 47.1 |
Lowest in hybrid topology; highest in ring structure. |
|
Packet Loss (%) |
1.0 – 2.4 |
Mesh and hybrid topologies showed best reliability. |
|
|
Throughput (Mbps) |
7.2 – 9.3 |
Highest in hybrid; star and tree slightly lower. |
|
|
Energy Efficiency (J/task) |
0.86 – 0.99 |
Mesh and hybrid most energy efficient. |
|
|
Scalability Testing |
Latency @ 50 Nodes (ms) |
39.2 |
System maintains low latency at smaller scales. |
|
Latency @ 100 Nodes (ms) |
43.8 |
Acceptable increase; system remains stable. |
|
|
Latency @ 200 Nodes (ms) |
51.6 |
Noticeable increase but within QoS bounds. |
|
|
CPU Usage @ Server (%) |
42 – 71 |
Scales linearly with node count. |
|
|
Load Variability Simulation |
Prediction Accuracy (Normal Load) |
94.3% |
Linear regression performs well under normal load. |
|
Prediction Accuracy (Peak Load) |
91.0% |
Minor degradation in predictive accuracy. |
|
|
Response Time During Spikes (ms) |
48.2 |
Still under 50 ms threshold. |
|
|
Cybersecurity Stress Testing |
DoS Attack Recovery Time (s) |
6.2 |
System reroutes and resumes service quickly. |
|
Data Integrity Loss (%) |
< 0.5% |
Minimal loss; encryption layer successful. |
|
|
Encryption Overhead (latency, ms) |
+4.8 |
Slight latency increases with AES encryption. |
|
|
Environmental Simulation |
Packet Loss @ High Temp (45°C) |
2.2% |
Slight increase in loss; hardware remains stable. |
|
Energy Use @ Voltage Drop (−10%) |
+7.1% |
Minor increase; within expected tolerance. |
|
|
User Interaction Testing |
Avg. Task Completion Time (s) |
12.4 |
For daily monitoring and settings updates. |
|
User Satisfaction Score (SUS) |
84/100 |
Based on small user group testing |
This comprehensive evaluation is intended to validate the system's robustness, scalability, and readiness for real-world deployment.
Network Topology Impact: The system was tested across five common topologies: Star, Mesh, Tree, Ring, and Hybrid (Star-Mesh). Results showed that the Hybrid topology achieved the best balance of low latency (38.6 ms), minimal packet loss (1.0%), and high throughput (9.3 Mbps). The Mesh topology also performed well due to its high fault tolerance. In contrast, Ring and Tree topologies exhibited relatively higher latency and packet loss due to longer routing paths and reliance on hierarchical links. These findings emphasize the importance of topology-aware deployment in maximizing system efficiency and reliability.
Scalability Testing: Scalability was evaluated by increasing the number of connected smart meters from 50 to 200 nodes. While latency increased modestly from 39.2 ms to 51.6 ms, the system maintained performance within acceptable thresholds for smart grid operations. CPU utilization at the central server also scaled predictably (from 42% to 71%), suggesting that with proper hardware provisioning, the system can support large-scale deployments without significant degradation.
Load Variability and Prediction Accuracy: The linear regression-based prediction model demonstrated strong performance under normal load conditions, with a prediction accuracy of 94.3%, and maintained robust accuracy (91.0%) even under peak load scenarios. The system's response time during load spikes remained under 50 ms, affirming its ability to adapt in dynamic usage contexts. This supports the suitability of the chosen model for real-time demand forecasting in typical operational environments.
Cybersecurity Resilience: To assess security robustness, simulated denial-of-service (DoS) attacks were introduced. The system recovered in an average of 6.2 seconds, and data integrity loss remained below 0.5%, demonstrating high resilience. The integration of AES-based encryption added 4.8 ms of latency, a minor trade-off for enhanced security. These results confirm that the system maintains dependable performance even under malicious network activity.
Environmental Simulation: Simulated stress tests under high-temperature (45℃) and low-voltage (−10%) conditions were conducted to mimic harsh deployment environments. Packet loss increased slightly to 2.2%, and energy consumption rose by 7.1%, but system operation remained within acceptable tolerances. This suggests that the proposed system is technically resilient for outdoor or infrastructure-challenged areas, such as rural or remote regions in Iraq.
User Experience: Finally, the user interface (UI) was tested with a small group of users (n=12), who completed routine tasks in an average of 12.4 seconds and provided a System Usability Score (SUS) of 84/100. These results indicate a high level of usability and user satisfaction, validating the front-end design for real-time monitoring and control.
6.3 Comparison of alternative communication protocols for water metering
To address the concerns regarding the power efficiency and scalability of IEEE 802.11g compared to alternative protocols, this section examines three low-power communication technologies: LoRaWAN, NB-IoT, and ZigBee. These alternatives offer potential improvements in battery life and scalability for water metering applications. Table 10 summarizes key features of the compared wireless communication protocols.
Power Efficiency Comparison: Battery life is a crucial factor for water metering systems, as frequent battery replacement increases maintenance costs. Table 11 highlights the expected battery life of each protocol when used for periodic water usage data transmission.
Table 10. Key features of different wireless communication protocols
|
Protocol |
Frequency Band |
Data Rate |
Range |
Power Consumption |
Scalability |
|
IEEE 802.11g |
2.4 GHz |
Up to 54 Mbps |
~100m (urban) |
High |
Moderate |
|
LoRaWAN |
Sub-GHz (EU: 868 MHz, US: 915 MHz) |
0.3-50 kbps |
Up to 15 km |
Very Low |
High |
|
NB-IoT |
Licensed LTE (700–900 MHz) |
~250 kbps |
Up to 10 km |
Low |
Very High |
|
ZigBee |
2.4 GHz |
20-250 kbps |
~100m |
Low |
High |
As noticed from Table 11, LoRaWAN and NB-IoT offer superior battery life due to their low-power wide-area network (LPWAN) characteristics, making them more suitable for remote water metering applications.
Table 11. Expected battery life of each protocol
|
Protocol |
Transmission Interval |
Estimated Battery Life |
|
IEEE 802.11g |
1 minute |
~1 year |
|
LoRaWAN |
15 minutes |
~10+ years |
|
NB-IoT |
15 minutes |
~5-10 years |
|
ZigBee |
5 minutes |
~3-5 years |
Scalability Considerations: Scalability is essential when deploying water metering systems in large urban environments. Table 12 compares the maximum number of devices supported per gateway or base station.
Table 12. Comparison of the maximum number of devices per gateway
|
Protocol |
Max Devices per Gateway/Base Station |
|
IEEE 802.11g |
~200 |
|
LoRaWAN |
~10,000 |
|
NB-IoT |
~100,000 |
|
ZigBee |
~65,000 |
As noticed from Table 12, NB-IoT offers the highest scalability, followed by LoRaWAN and ZigBee. IEEE 802.11g has significantly lower scalability due to its reliance on conventional Wi-Fi infrastructure.
Suitability for Water Metering Applications: Each protocol has strengths and weaknesses based on deployment requirements:
•LoRaWAN: Best suited for low-power, long-range deployments with infrequent data transmissions (e.g., once every few minutes to hours).
•NB-IoT: Ideal for high-density deployments, offering strong coverage in urban areas with a tradeoff in slightly higher power consumption.
•ZigBee: Works well in short-range mesh networks, making it useful for localized deployments where meters communicate via multiple hops.
•IEEE 802.11g: Provides high data rates but suffers from high power consumption and limited scalability, making it less suitable for large-scale deployments.
Despite its limitations in power efficiency and scalability, IEEE 802.11g was chosen for this study based on the following practical considerations:
Availability and Infrastructure Compatibility: IEEE 802.11g is widely available in most laboratory and urban environments, reducing the need for additional infrastructure investments. Since many existing networks support Wi-Fi, leveraging it allows seamless integration with other smart home and IIoT devices.
Higher Data Rate for Real-Time Monitoring: Compared to LoRaWAN and NB-IoT, IEEE 802.11g provides significantly higher data rates (up to 54 Mbps), making it more suitable for applications that require frequent data transmissions and real-time monitoring of water usage.
Ease of Implementation and Testing: Our system is equipped with Wi-Fi-enabled microcontrollers (e.g., ESP32-C3), making IEEE 802.11g the most practical choice for prototyping and testing without additional investment in LPWAN gateways or cellular subscriptions.
Reliability in Short-Range Applications: Given that water meters are deployed within residential areas and often close to existing Wi-Fi networks, IEEE 802.11g ensures reliable data transmission without requiring specialized long-range communication setups.
Low Deployment Cost in Controlled Environments: While LPWAN solutions excel in large-scale, remote deployments, Wi-Fi remains cost-effective for small to medium-scale deployments where power sources or periodic recharging are feasible.
While IEEE 802.11g provides sufficient connectivity for small-scale water monitoring systems, it is not the most energy-efficient or scalable option. LoRaWAN and NB-IoT are preferable for long-term, city-wide deployments due to their lower power requirements and greater scalability. Future improvements to the system could consider hybrid approaches where Wi-Fi is used for localized data aggregation, while LPWAN technologies handle long-range data transmission.
Water usage monitoring systems which use IoT technology must deal with diverse security threats that endanger system functionality as well as user privacy and data integrity protection. Table 13 outlines some of the most common security risks [26-32].
Table 13. Security analysis
|
Attack Type |
Description |
Defense Based on Possible Security Solutions |
|
Insider threats |
Workers who control the system have the ability to damage valuable information and poor security implementation and manipulation of water usage histories becomes a possibility for their personal interests. |
Establishing user authentication concepts and password policies alongside implementing audit logs. Anomaly detection systems coupled with continuous user activity surveillance. |
|
Unauthorized access |
The system contains weaknesses that enable unapproved users to establish unauthorized entry and modify water data or seize control of the network infrastructure. The failure to maintain strong passwords along with neglecting firmware updates allows attackers to exploit system vulnerabilities which creates opportunities for data theft and causes system disruption. |
The security measures of strong authentication together with encrypted communication protocols such as HTTPS and authentication keys serve to block unauthorized access to the system. |
|
Physical tampering |
Physical attempts by unauthorized entities can result in modifications of water meter readings along with bypasses of billing systems through the implementation of harmful hardware devices. Attackers can deploy hidden equipment which modifies water consumption records during their journey to the cloud server. |
The implementation of tamper-proof enclosures along with security seals and motion detection systems. |
|
Lack of security updates |
Water monitoring devices remain open to attackers when security patches are not maintained on a regular basis. The security vulnerabilities of dated devices depend on their ancient protection systems since attackers can control the system while extracting sensitive data. |
Regular OTA updates are implemented. Firmware maintenance systems that conduct auto updates with security authentication functions safeguard firmware integrity until all devices maintain current versions. |
|
Data breaches |
The disclosure of water consumption data exposes important user information which includes patterns of water use together with billing data. A data breach would disclose sensitive user information so attackers could both manipulate water statistics and pretend as customers for fraud. |
The encryption of data with secure protocols_SSL/TLS during transmission and AES-256 during storage fully protects against data breach attempts. |
|
DoS attacks |
Generates substantial network traffic which disables smart water meters andcaptcha characteristics of data transmission systems. Real-time water monitoring capabilities get interrupted while automated safety alerts stop functioning as well as leak observation gets delayed allowing water drainage through leaks along with unanticipated fiscal expenses. |
The execution of firewalls together with intrusion prevention systems (IPS). Rate limiting together with anomaly detection and traffic monitoring allows early detection followed by swift action before operations become disrupted. |
|
Malware and viruses |
The network becomes vulnerable to malicious software when attackers introduce malware and viruses that render smart water meters both infected and non-operational. The device Data Breaches: becomes vulnerable to attackers since malware capabilities include deleting water consumption records while corrupting meter readings and providing remote control over devices without user detection. |
End-point protection combined with intrusion detection systems (IDS) protects networks from malicious software because they perform the detection and prevention functions. |
Multiple security measures for protecting water usage monitoring systems include robust authentication systems, encrypted data and periodic software updates and professional intrusion detection equipment and physical security protocols. By combining these security measures, IoT-based water usage monitoring systems can be safeguarded against a wide range of cyber and physical threats.
Although the proposed system implements basic encryption and user authentication, IIoT systems remain vulnerable to a wide spectrum of cyber and physical threats due to their distributed architecture and exposure to public or semi-public environments. Table 14 expands the threat model to include eight common attack vectors, each relevant to the water usage context.
Table 14. Common security threats in IIoT water monitoring systems and suggested countermeasures
|
Attack Type |
Description |
Defense Mechanisms |
|
Physical Attacks |
Tampering with devices to manipulate flow readings or bypass sensors |
Tamper-proof casings, location obfuscation, physical seals, and motion detection |
|
Malware Injections |
Introduction of malicious code through compromised microcontrollers or networks |
Endpoint protection, firmware validation, OTA updates with secure bootloader |
|
Unauthorized Access |
Gaining control of devices or cloud database via weak authentication |
Strong authentication protocols (e.g., OAuth 2.0), TLS encryption, role-based access |
|
Replay Attacks |
Reuse of intercepted packets to spoof valid transmissions |
Use of nonces/timestamps in packets, mutual TLS authentication |
|
Man-in-the-Middle |
Intercepting communication between sensor nodes and cloud/database |
HTTPS/TLS encryption, certificate pinning, frequent key rotation |
|
DoS/DDoS Attacks |
Overwhelming the system to prevent legitimate access or data transmission |
Rate limiting, intrusion detection systems (IDS), anomaly detection with AI |
|
Data Breaches |
Exposure of sensitive user data from the database or during transmission |
AES-256 encryption at rest, TLS in transit, secure key management |
|
Firmware Exploits |
Exploiting outdated or vulnerable microcontroller firmware |
Regular OTA firmware updates, digitally signed firmware, secure bootloaders |
The expanded security analysis demonstrates that IIoT water monitoring systems must integrate multi-layered defenses, addressing both cyber and physical threat vectors. The proposed system, when enhanced with these best practices, can achieve the robustness and reliability required for real-world urban deployments.
A linear regression model used one week of historical data for making predictions about water consumption trends. The preprocessing phase included Timestamp conversion into numerical format together with MinMaxScaler normalization. Machine learning analysis required a conversion of datetime values into Unix timestamps to transform the dataset. The dataset was separated into training and testing segments where 80% served for model training and 20% remained for testing purposes.
The linear regression model accepted the dataset through training to locate patterns between water usage and time sequences. An analysis of the water usage prediction model required evaluation through multiple performance metrics including accuracy in combination with mean absolute error (MAE) and root mean squared error (RMSE) as well as R² score. The Linear Regression model produced the testing results after its training phase on unseen information as shown in Table 15.
Table 15. Testing results for the linear regression model
|
Metrics |
Value |
|
R² Score: |
0.85 |
|
MAE |
12.5 mL/min |
|
RMSE |
18.3 mL/min |
The linear regression model demonstrates acceptable performance in approximating water usage patterns although it presents opportunities to enhance its accuracy. The model demonstrates an 0.85 R² value which suggests it handles most of the total variance in the data but the inclusion of more complex models might be necessary. The model shows good predictive capabilities because its actual value predictions remain within close proximity to measured values yet exhibit specific deviations according to the MAE and RMSE values.
After achieving accuracy improvements additional steps should include the implementation of big data approaches. Extending the dataset and adding external variables such as weather data and holiday schedules alongside user-specific behavior enables the model to gain better robustness. The use of Random Forest, XGBoost and LSTM Neural Networks along with Linear Regression substitutions would result in greatly enhanced prediction accuracy for detecting non-linear patterns. Security stands as a fundamental issue when AI-based water monitoring systems operate. The study [27] delivers vital information about choosing relevant data points to enhance model precision and minimize computational complexity. While, the study [28] declares how AI models are vulnerable to manipulation, which is also a concern in water monitoring systems where false readings or cyber threats could impact accuracy.
Regarding the predictive model employed in the system, a linear regression model was selected due to its simplicity, computational efficiency, and interpretability—factors that are particularly important for deployment in resource-constrained environments such as the target regions in Iraq. Linear regression provides a transparent and easily explainable method for identifying relationships between input variables (e.g., sensor readings, historical usage data) and energy consumption patterns, facilitating integration with existing control logic.
Nonetheless, the use of more sophisticated models like Random Forests or Long Short-Term Memory (LSTM) networks could potentially improve prediction accuracy, especially in capturing complex nonlinear relationships and temporal dependencies in the data. These advanced models were not the primary focus of this initial study, which aimed to demonstrate a lightweight, proof-of-concept implementation. Future work will explore the incorporation of such models to assess their impact on predictive performance and system responsiveness.
To focus on the contributions of our proposed system, a comparison must be made with previous works related to the efficient, secured, and smart water usage monitoring topic.
As shown in Table 16, the comparisons with relevant works highlight that our suggested system is a secure, efficient, and intelligent water consumption monitoring solution in an urban environment. The analysis of network configurations provides insightful information that helps select suitable network configurations that optimize network performance. Also, the suggested security model guarantees the safe transmission and storage of consumption data. Furthermore, a prediction model using a Linear Regression model is used for making predictions about water consumption trends which can enhance users' awarness.
Table 16. Comparison our proposed system with previous works
|
Ref. No. |
Research Methodology |
AI Technology Usage |
Security Solutions |
Network Configuration Analysis |
|
[14] |
Hardware using ESP-8266 |
Building a predictive model using Random Forest algorithm |
N\A |
N\A |
|
[2] |
Hardware ESP-8266 & raspberry |
using historical context for Leak detection algorithm |
N\A |
N\A |
|
[16] |
Simulation using Riverbed Modeler Network Simulations |
N\A |
N\A |
Examining different network topologies, for efficient system establishment |
|
Our work |
Hardware using Xiao ESP32C3 &+Simulation using OPNET Modeler Network Simulator |
Using a Linear Regression model for making predictions about water consumption trends |
Combining multiple security measures such as robust authentication systems, encrypted data and periodic software updates and professional intrusion detection equipment and physical security protocols |
Analyzing various network configurations to determine the most reliable and efficient options for data communication |
The proposed Water consumption Monitoring System utilizes IIoT technology to provide a practical solution for real-time water consumption tracking. By integrating the Xiao ESP32C3, the YF-S201 water flow sensor, and Google Cloud Services, this manuscript offers accurate and accessible data on water usage for users in urban environments. The system's flexibility in power sourcing, along with an alert feature via Telegram, ensures reliability and timely notifications for users. With an emphasis on data security and a user-friendly interface, the system not only promotes water conservation but also showcases the potential of IIoT in environmental sustainability and smart home management. The Key contributions of the proposed system include proposing real-time water usage monitoring by leveraging the existing IIoT technology and optimizing network performance through the analysis of network configurations to build an efficient, secured, and cost-effective system for water management using resource-constrained devices and Wi-Fi network with a predictive model for water consumption trends.
As a natural extension of this work, future efforts may focus on complementing the current framework with enhancements that support larger-scale deployment and long-term sustainability. These include exploring hybrid communication architectures (e.g., LoRaWAN, NB-IoT) for improved scalability and energy efficiency, implementing advanced AI models to refine consumption prediction, and enhancing user interfaces to drive broader adoption and behavior change. Additionally, field testing under varied environmental and infrastructural conditions and collaboration with municipal stakeholders can further validate and integrate the system into urban infrastructure. These future directions are not presented as limitations, but as valuable opportunities to build upon the strengths of the current system and expand its applicability and impact within the evolving landscape of smart cities and sustainable resource management.
[1] Clemente, A.E., Samaniego, R.M.G., Cruz, F.R.G. (2023). IoT based water consumption monitoring system for water management. In 2023 15th International Conference on Computer and Automation Engineering (ICCAE), Sydney, Australia, pp. 114-119. https://doi.org/10.1109/ICCAE56788.2023.10111335
[2] Fuentes, H., Mauricio, D. (2020). Smart water consumption measurement system for houses using IoT and cloud computing. Environmental Monitoring and Assessment, 192(9): 602. https://doi.org/10.1007/s10661-020-08535-4
[3] Mamede, H., Neves, J.C., Martins, J., Gonçalves, R., Branco, F. (2023). A prototype for an intelligent water management system for household use. Sensors, 23(9): 4493. https://doi.org/10.3390/s23094493
[4] Hasibuan, A.A., Fahrianto, F. (2019). Consumer's activity prediction in household water consumption based-IoT (Internet of Things). In 2019 7th International Conference on Cyber and IT Service Management (CITSM), Jakarta, Indonesia, pp. 1-7. https://doi.org/10.1109/CITSM47753.2019.8965344
[5] Ali, Q.I. (2010). Design & implementation of a mobile phone charging system based on solar energy harvesting. In 2010 1st International Conference on Energy, Power and Control (EPC-IQ), Basrah, Iraq, pp. 264-267.
[6] Mahmood, M.B., Abdul-Jabbar, J.M. (2023). Securing Industrial Internet of Things (Industrial IoT)-A Reviewof challenges and solutions. Al-Rafidain Eng. J. (AREJ), 28(1): 312-320.
[7] Karmakar, A., Dey, N., Baral, T., Chowdhury, M., Rehan, M. (2019). Industrial internet of things: A review. In 2019 International Conference on Opto-Electronics and Applied Optics (Optronix), Kolkata, India, pp. 1-6. https://doi.org/10.1109/OPTRONIX.2019.8862436
[8] De Paula, H.T., Gomes, J.B., Affonso, L.F., Rabelo, R.A., Rodrigues, J.J. (2019). An IoT-based water monitoring system for smart buildings. In 2019 IEEE International Conference on Communications Workshops (ICC Workshops), Shanghai, China, pp. 1-5. https://doi.org/10.1109/ICCW.2019.8756905
[9] Gomathi, K., Harish, B.C., Jagasureya, V.B. (2020). IoT based household water usage monitoring and controlling. International Journal of Scientific & Technology Research, 9(3): 5917-5920. https://www.ijstr.org/final-print/mar2020/Iot-Based-Household-Water-Usage-Monitoring-And-Controlling.pdf.
[10] Roy, T.P., Satheesbabu, S., Somasundaram, S.K. (2021). Water consumption analysis using IoT. An Interdisciplinary Journal, Psychology and Education, 58(1): 4302-4306. https://doi.org/10.17762/pae.v58i1.1499
[11] Di Mauro, A., Di Nardo, A., Santonastaso, G.F., Venticinque, S. (2019). An IoT system for monitoring and data collection of residential water end-use consumption. In 2019 28th International Conference on Computer Communication and Networks (ICCCN), Valencia, Spain, pp. 1-6. https://doi.org/10.1109/ICCCN.2019.8847120
[12] Panjwani, A., Chand, S., More, A., Panjwani, R. (2020). Water usage control and management based on IoT. International Journal of Scientific Research in Computer Science, Engineering and Information Technology, 6(3): 730-736. https://doi.org/10.32628/CSEIT2063183
[13] Rubio, B.U., Carrillo, R.P.G., Aitken, H.G.W., Rodrígue, J.E.B., Ruiz, M.K.C. (2022). Alert system to control water consumption for domestic service. In Proceedings of the 26th World Multi-Conference on Systemics, Cybernetics and Informatics (WMSCI 2022), pp. 86-91. https://doi.org/10.54808/WMSCI2022.02.86
[14] Ndayisenga, G. (2022). IoT Based intelligent household water consumption management system. Doctoral dissertation, College of science and Technology, University of Rawanda.
[15] Ye, Y., Yang, Y., Zhu, L., Wang, J., Rao, D. (2021). A lora-based low-power smart water metering system. In 2021 IEEE International Conference on Consumer Electronics and Computer Engineering (ICCECE), Guangzhou, China, pp. 301-305. https://doi.org/10.1109/ICCECE51280.2021.9342327
[16] Marais, J., Malekian, R., Ye, N., Wang, R. (2016). A review of the topologies used in smart water meter networks: A wireless sensor network application. Journal of Sensors, 2016(1): 9857568. https://doi.org/10.1155/2016/9857568
[17] Majid, A., Wiguna, A., Setiawan, H., Farihah, A. (2023). Development of an automatic water flow sensor system using ESP32 for efficient water control. IOP Conference Series: Earth and Environmental Science, 1242(1): 012016. https://doi.org/10.1088/1755-1315/1242/1/012016
[18] ESP32-C3Series Datasheet, Version 1.6 Espressif Systems, 2024, www.espressif.com.
[19] Cameron, N. (2023). ESP32 Microcontroller. In: ESP32 Formats and Communication. Maker Innovations Series. Apress, Berkeley, CA. https://doi.org/10.1007/978-1-4842-9376-8_1
[20] Khalil, S., Hamdoon, O., Almakhyoul, Z. (2024). Energy consumption enhancement of a solar under floor heating system in a small family house located in Mosul City, Iraq. Al-Rafidain Engineering Journal, 29(1): 144-153.
[21] Thu, S., Aung, N., Ko, K. (2018). A calibration technique for water flow sensor YF-S201 1. International Journal of Trend in Research and Development, 5(5): 152-154. http://www.ijtrd.com/papers/IJTRD17965.pdf.
[22] Ibrahim, Q. (2016). Enhanced power management scheme for embedded road side units. IET Computers & Digital Techniques, 10(4): 174-185. https://doi.org/10.1049/iet-cdt.2015.0135.
[23] Ibraheem, F.N., Abdulrazzaq, S.N., Fathi, I.A., Ali, Q. (2024). High-resolution and secure IoT-based weather station design. International Journal of Safety & Security Engineering, 14(1): 249-258.
[24] Setiawan, A., Sediyono, E. (2018). The use of google maps and universal transverse mercator (UTM) coordinate in land measurement of region in different zone. Journal of Theoretical and Applied Information Technology, 96(23): 8071-8080.
[25] Qaddoori, S.L., Fathi, I., Hammoudy, M.A., Ali, Q.I. (2023). Advancing public health monitoring through secure and efficient wearable technology. International Journal of Safety and Security Engineering, 13(6): 1001-1014. https://doi.org/10.18280/ijsse.130603
[26] Alasad, Q., Yuan, J., Lin, J. (2018). Resilient AES against side-channel attack using all-spin logic. In Proceedings of the 2018 Great Lakes Symposium on VLSI, pp. 57-62. https://doi.org/10.1145/3194554.3194595
[27] Ali, Q.I. (2016). Securing solar energy-harvesting road-side unit using an embedded cooperative-hybrid intrusion detection system. IET Information Security, 10(6): 386-402. https://doi.org/10.1049/iet-ifs.2014.0456
[28] Alasad, Q., Hammood, M.M., Alahmed, S. (2023). Performance and complexity tradeoffs of feature selection on intrusion detection system-based neural network classification with high-dimensional dataset. In: Al-Sharafi, M.A., Al-Emran, M., Al-Kabi, M.N., Shaalan, K. (eds) Proceedings of the 2nd International Conference on Emerging Technologies and Intelligent Systems. ICETIS 2022. Lecture Notes in Networks and Systems, vol 584. Springer, Cham. https://doi.org/10.1007/978-3-031-25274-7_45
[29] Fatehi, N., Alasad, Q., Alawad, M. (2022). Towards adversarial attacks for clinical document classification. Electronics, 12(1): 129. https://doi.org/10.3390/electronics12010129
[30] Lazim Qaddoori, S., Ali, Q.I. (2023). An embedded and intelligent anomaly power consumption detection system based on smart metering. IET Wireless Sensor Systems, 13(2): 75-90. https://doi.org/10.1049/wss2.12054
[31] Merza, M.E., Hussein, S.H., Ali, Q.I. (2023). Identification scheme of false data injection attack based on deep learning algorithms for smart grids. Indonesian Journal of Electrical Engineering and Computer Science, 30(1): 219-228. https://doi.org/10.11591/ijeecs.v30.i1.pp219-228
[32] Alhabib, M.H., Ali, Q.I. (2023). Internet of autonomous vehicles communication infrastructure: A short review. Diagnostyka, 24(3): 1-9. http://doi.org/10.29354/diag/168310