Iman Zaidan Alshih Yahya*![]() | Ahmed Mohammed Mahmood
| Ahmed Mohammed Mahmood![]() | Waleed Mohammed Najm
| Waleed Mohammed Najm![]() | Emad Toma Karash
| Emad Toma Karash![]()
© 2025 The authors. This article is published by IIETA and is licensed under the CC BY 4.0 license (http://creativecommons.org/licenses/by/4.0/).
OPEN ACCESS
The use of material handling equipment is ubiquitous in daily life. One type of material handling machinery that is widely used in many different engineering domains is the crane. This work aims to address the full design and analysis of an industrial crane with a high load capacity. Four structural crane models were designed in this work, and the cross-sectional area of the system was altered in areas that were thought to have high stresses and deformations. This was done in order to lower the values and disperse the facades throughout the system, producing a model with a high loading efficiency. Finite element analysis was performed for the estimated load situation with a specific influence factor. The maximum stress and deformation regions for each component were identified in order to validate the design values. The maximum deformation values in all three models are significantly and quickly smaller than those in the first model, according to the modeling study's conclusion. The largest drop (44.35%) occurred in the fourth model. The values of the various displacements and stresses also dropped, as the fourth model's maximum percentage of stress reduction from the first model was 57.81. Furthermore, it is determined that the displacements and stresses in the fifteenth nodes of the three models are substantially smaller than those in the first model. It appears to decline considerably in the decade of the fourth model.
truss, column, finite elements, deformation, strain, stress
A truss structural analysis's first objective is to ascertain the members' internal forces. The member forces are required in order to design the joints and members.
The safety of construction machinery is subject to increasingly stringent regulations as a result of the increased output of construction. Production safety when using overhead cranes for lifting and hoisting operations is mostly dictated by the state of the undercarriage, crane runways, and metal structures [1].
Material handling equipment is used to move loads in departments, factories, and plants, as well as at construction sites, points of storage and reloading, and other locations. In contrast to long-distance transportation, which involves moving loads over long distances, material handling equipment moves loads over relatively short distances [2-4]. In the design case considering the global stability of structures: buckling and lateral torsional buckling, it is crucial to know the critical load of the compressive and bending elements. Empirical formulas, for instance, can be used to determine this load. Computer programs or Euler's formula, for instance. LT-frame. Experimental methods can also be used to determine the critical load. But empirical models are never complete structures; instead of bifurcation points, equilibrium paths are defined by boundary points. The horizontal asymptotes and initial imperfections that influence the nonlinear relationships between load and displacements are known as the critical load, and they characterize the equilibrium path of imperfect systems [5-7]. The high specific strength, modulus, and stiffness of lattice truss structures have made them a thought-provoking option for various lightweight engineering structures [8-10]. By using the factor modal combination rule as the basis for their procedure, researchers [11, 12] enhanced displacement-based adaptive pushover. According to their findings, the suggested methodology can accurately reproduce the peak dynamic responses and outcomes.
The study [13] provides graphical techniques based on experimental findings for determining the critical loads of column and beam elements. The principles of each method's application are presented by the author, along with the findings of his experimental investigations into the instability phenomenon of imperfect planar steel trusses. After determining the tested truss's critical load using the previously discussed methods, the findings of the numerical analysis were compared. The techniques for figuring out the critical moment in the truss analysis have been shown to be valid. The main goal of this article [14] is to create a range of models with different composite materials and shapes. The findings indicate that the rate of deformation has increased. versus non-linear beams and those with linear shapes. Furthermore, the findings indicate a rise in stresses and strains in regions that have curves, or nonlinear regions. Bhimsen et al. [15] In the current study, a cantilever beam system with variously shaped holes on its surface under direct external load conditions was studied. The strain results show that models made of composite materials have increased in various proportions; the model made of glass fibers had the highest values, reaching 92.18%. Marchuk et al. [16] In this article, the normal operating condition of electric overhead cranes was studied while they are subjected to a very large dynamic load. This research presents a simulation of the dynamics of the electric overhead crane for three critical operations of the crane: lifting the load, lowering the load, and transport movement.
In this study, a four of models will be designed for gabled structures subject to load. The effect of these load on all the arms that make up the trussed structure will be studied, in order to determine the maximum deformation, displacement and stress on the models, with the aim of reducing these loads by changing the cross-sectional area of the structure. This will be repeated until the best model that is resistant to these loads is reached without collapsing during work. This study [17] compared the stresses in various cross sections that were obtained using the Winkler-Patch method and finite element analysis. The goal was to decrease the stresses in the sections by adjusting the design parameters, specifically the mass of the material in the trapezoidal section. The strength and durability of the machine elements and the structure are assessed using stress concentration factors. It has been observed that weight gain affects stress. In this study [18], researchers used the ANSYS Workbench platform to study the solution of a complex frame member design problem for an industrial building based on the rational design algorithm of the suggested structure. This program was used to create structures that were the ideal size. This study [19] aims to analyze the stress-strain states of an actual casting crane while accounting for additional inertia loads, thermal effects, and the weight of the lifted load. The pattern of stress distribution within the transverse elements is the study's goal. A methodology based on force calculations that consider allowable stresses and FEM is proposed to model and analyze the stress-strain states of a casting crane. The traverse metal frame's stress-strain state was analyzed, and the results indicated that the equivalent stress values ranged from 6 to 125 MPa and were unevenly distributed among the elements. During strength calculations and element optimization of hoisting and transport machines, the finite element method implemented in CAD/CAE systems is widely used [20-23]. This allows to: improve the accuracy of performed calculations; obtain a picture / chart with stress-strain states of the entire assembly. In this study [24], the optimization study of some fundamental geometric and material parameters of industrial portal frame structures with varying capacities of vertical cranes is presented. The findings indicate that when the span or gate spacing varies with respect to their optimal values, the weight differential between double and single gate frames falls. This study [25] examined the damage characteristics and thermal response of steel structures that were subjected to fire manufacturing. Initially, the ultimate bearing capacity and fire resistance were computed and inspected, along with the thermal response of the manufactured steel structures under fire. Experimental investigations into the damage characteristics and thermal response of prefabricated steel structures under fire were conducted, and the findings confirmed the validity of the suggested analysis technique. In this study [26], the novel truss system known as truss-Z is introduced. It enables the construction of intricate, reversible structural networks with a distinct organic aesthetic. One modular unit is used for the supporting structure and two modular units are used to construct the main truss structure. The environmental elements are actual impediments, like buildings, roads, and waterways, that could interfere with the operation of trusses and the positioning of supports. A truss-Z network connecting six pins in a three-obstacle environment is demonstrated. Joinery, full-size fabrication, and truss module fabrication issues are also covered. The purpose of this work [27] is to provide a straightforward and precise finite element (3D) model that can be used to predict how beam-to-column joints in steel frames will behave when subjected to lateral loads. The joint is designed using the ANSYS software package. The findings indicated that compared to other modeling techniques, this one should provide a significantly smaller number of elements and a faster solution time while avoiding the aforementioned drawbacks.
Numerous studies have employed the ANSES program in engineering designs and diverse fields to determine the stress and strain conditions of these structures under varying loads [28-33].
The technique of this study was primarily motivated by the significant value that previous research has demonstrated in assessing the stresses of truss constructions.
In this article, the ANSYS program and the finite element method will be used to design four steel truss structure models that can support a heavy load. This article will develop a model with high resistance and a large reduction in the values of stresses and deformations during loading. By building three different models and comparing them to the first model, which has an equal cross-sectional area throughout, the models will be developed by increasing the cross-sectional area of the structural parts that exhibit the maximum deformation and stress.
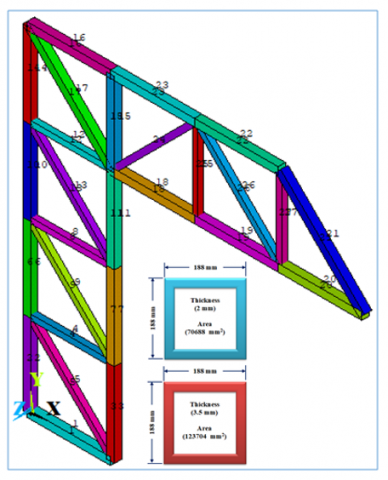
Figure 1 shows the structural elements, their dimensions, and areas. Table 1 shows the four models' structural elements and nodes, each measuring four meters, as well as the cross-sectional area of each element.
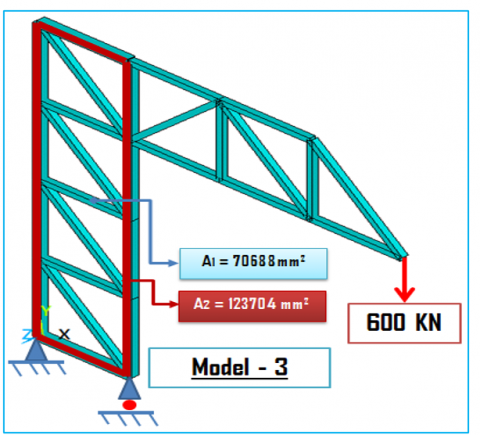
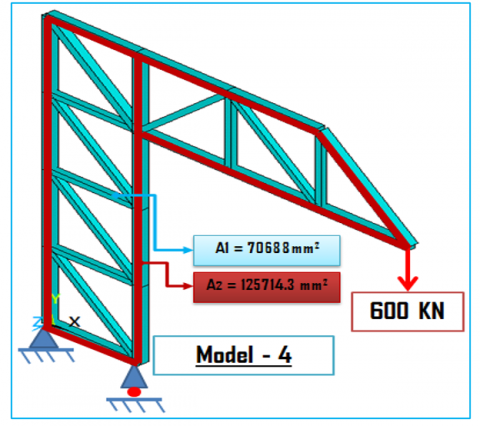
Four steel models of truss structures with high loads were created. As seen in Figure 2 (Model - 1), the cross-sectional area of every component in the first model was the same. The second model's components had a different cross-sectional area and were arranged differently, as seen in Figure 2 (Model - 2). The third model's cross-sectional area was likewise rearranged and displayed as Figure 2 (Model - 3). Additionally, the fourth model's cross-sectional area was different and arranged as Figure 1 (Model - 4) illustrates.
In every model, a load of (P = 600 KN) was applied, and Figure 2 illustrates which node applied the load. The mechanical properties of steel are ultimate stress (485 MPa), yield tensile stress (368 MPa), density (7800 Kg/m3), Poisons ratio (0.29), shear modulus (80 GPa) and modulus of elasticity (210 GPa).
Figure 1. The structural elements, dimensions, and area of each element
Table 1. The structural elements and the nodes and area of each element in the four models
|
Element |
Nodes |
Area (mm2) |
|||
|
Model 1 |
Model 2 |
Model 3 |
Model 4 |
||
|
1 |
1 - 2 |
70688 |
70688 |
123704 |
70688 |
|
2 |
1 - 3 |
70688 |
70688 |
70688 |
123704 |
|
3 |
2 - 4 |
70688 |
123704 |
123704 |
123704 |
|
4 |
3 - 4 |
70688 |
70688 |
70688 |
70688 |
|
5 |
2 - 3 |
70688 |
70688 |
70688 |
70688 |
|
6 |
3 - 3 |
70688 |
70688 |
123704 |
123704 |
|
7 |
4 - 6 |
70688 |
123704 |
123704 |
123704 |
|
8 |
5 - 6 |
70688 |
70688 |
70688 |
70688 |
|
9 |
4 - 5 |
70688 |
70688 |
70688 |
70688 |
|
10 |
5 - 7 |
70688 |
70688 |
123704 |
123704 |
|
11 |
6 - 8 |
70688 |
123704 |
123704 |
123704 |
|
12 |
7 - 8 |
70688 |
70688 |
70688 |
70688 |
|
13 |
6 - 7 |
70688 |
70688 |
70688 |
70688 |
|
14 |
7 -12 |
70688 |
70688 |
123704 |
123704 |
|
15 |
8 - 13 |
70688 |
123704 |
123704 |
123704 |
|
16 |
12 - 13 |
70688 |
70688 |
123704 |
70688 |
|
17 |
8 - 12 |
70688 |
70688 |
70688 |
70688 |
|
18 |
8 -9 |
70688 |
123704 |
123704 |
70688 |
|
19 |
9 - 10 |
70688 |
123704 |
123704 |
70688 |
|
20 |
10 - 11 |
70688 |
123704 |
123704 |
70688 |
|
21 |
11 - 15 |
70688 |
70688 |
123704 |
70688 |
|
22 |
14-15 |
70688 |
70688 |
123704 |
70688 |
|
23 |
13 - 14 |
70688 |
70688 |
123704 |
70688 |
|
24 |
8 -14 |
70688 |
70688 |
70688 |
70688 |
|
25 |
9 - 14 |
70688 |
70688 |
70688 |
70688 |
|
26 |
10 - 14 |
70688 |
70688 |
70688 |
70688 |
|
27 |
10 - 15 |
70688 |
70688 |
70688 |
70688 |
Figure 2. The four models
The most significant results from the ANSYS program are displayed in Figures 2 - 10 as well as Tables 1 and 2.
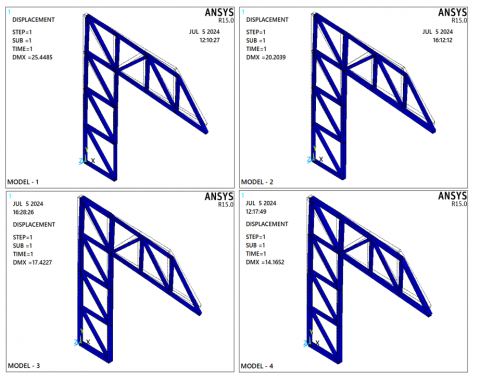
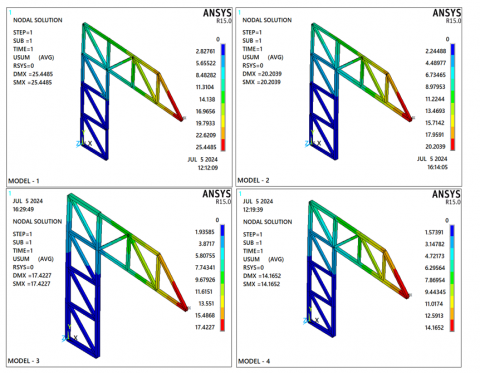
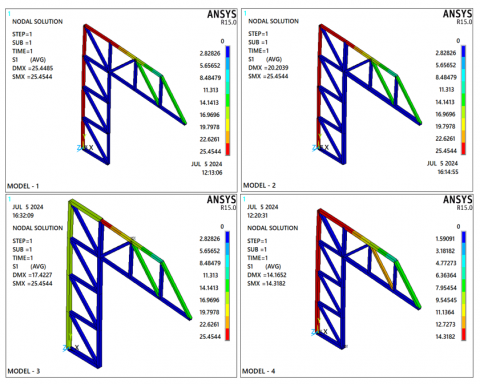
The deformation results on the four models following loading are displayed in Figure 2. Maximum deformation values for the four models were 25.4485, 20.2039, 17.4227, and 14.162 mm, respectively. It turns out that the maximum stress values are lower in the three models than in the first model.
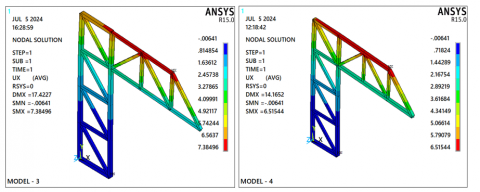
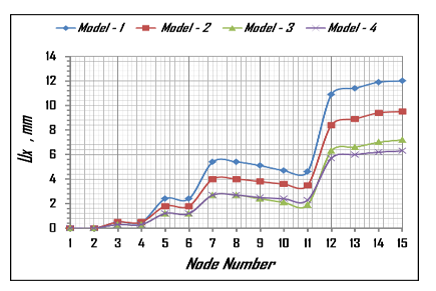
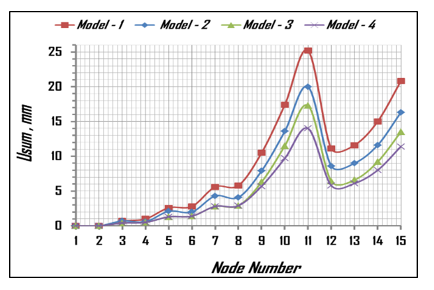
The displacement values that appear on the structural components of the four models after loading decrease in various directions, as seen in Figures 3, 4, 5, and Table 1. Pairs in the three models decreased relative to the first model by (12.291, 9.74411, 7.38496, 6.51544 mm) in the x-direction and by (2.12278, 2.08567, 1.24838, 1.22179 mm) in y-axis direction, while the total displacements decreased by (25.4485, 20.2039, 17.4227, and 14.162 mm), respectively.
Figure 3. Each model's deformation results
Figure 4. Indicates the findings of each model's displacement about the x-axis $\left(U_x\right)$
Figure 5. Indicates the findings of each model's displacement about the y-axis ( $U_y$ )
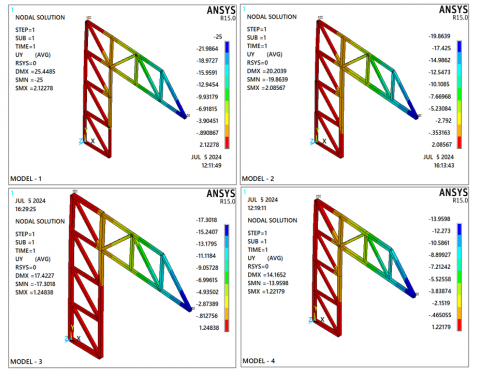
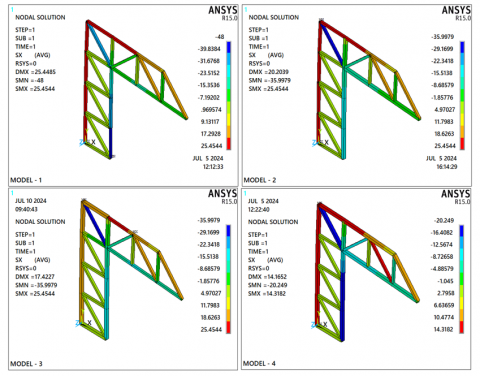
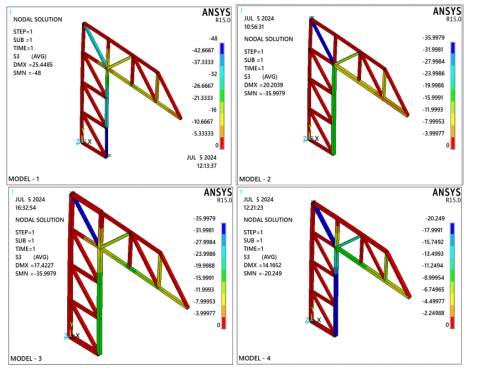
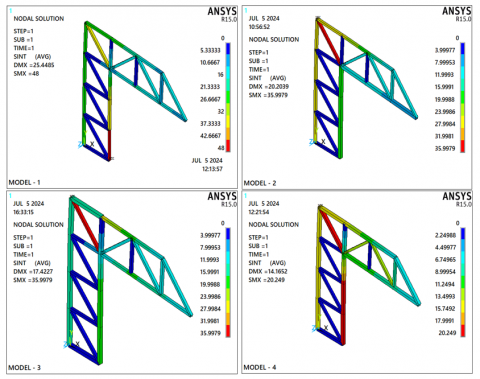
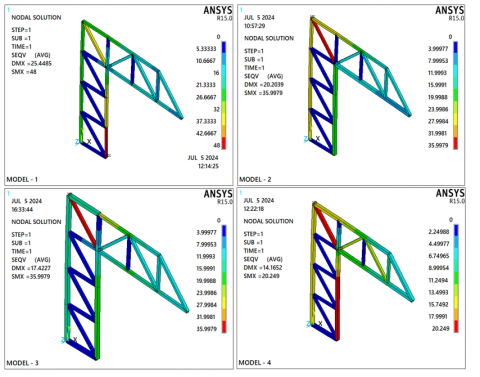
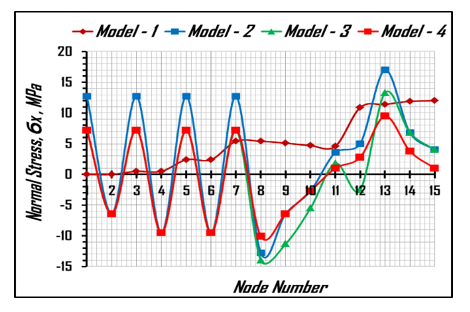
Results of various stresses that appear on the loaded models are shown in Figures 6-10. The maximum tensile and compressive stresses had the following values, as can be seen from the figures.
1. a. The models for tension normal stress ($\sigma_x$) are: (25.4485, 20.2034, 17.4227, 14.1652 MPa), respectively.
b. The models for compressive normal stress ($\sigma_x$) are: (48, 35.9979, 35.9979, 20.249 MPa), respectively.
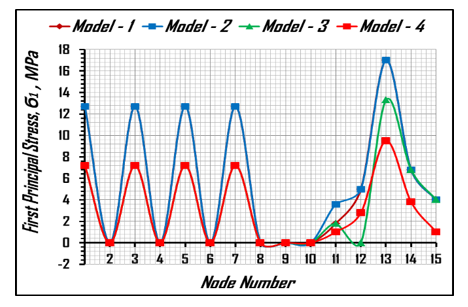
2. The following are the models for the first normal stress ($\sigma_1$): 25.4485, 20.2039, 17.4227, 14.1652 MPa, in that order.
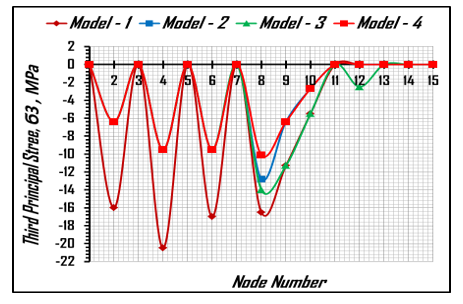
3. The following models, in order of third normal stress ($\sigma_3$), are available: 25.4485, 20.2039, 17.4227, and 14.1652 MPa.
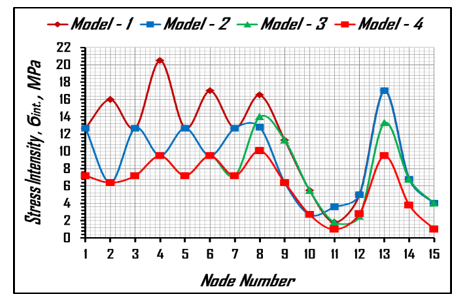
4. The following are the models for intensity stress ($\sigma_{i n t}$.): 25.4485, 20.2034, 17.4227, and 14.1652 MPa, respectively.
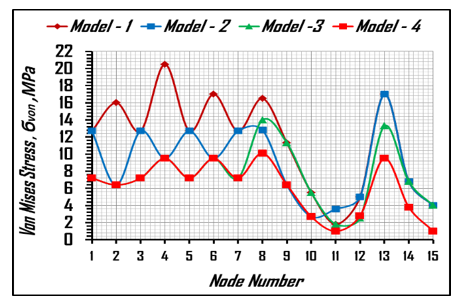
5. Von mises stress ( $\sigma_{v o n}$ ) models are as follows: 25.4485, 20.2034, 17.4227, and 14.1652 MPa, respectively.
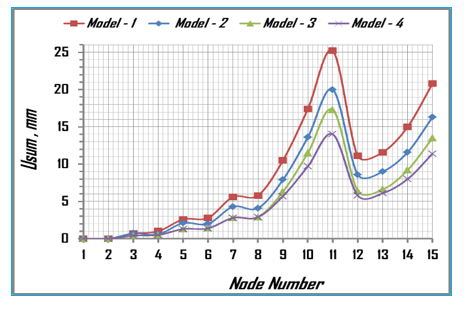
Figure 6. The results of the sum displacement ($U_{\text {sum }}$) for each model
Figure 7. The results of the normal stress ($\sigma_x$) for each model
Figure 8. The results of the first normal stress $\left(\sigma_1\right)$ for each model
Figure 9. The results of the third normal stress $\left(\sigma_3\right)$ for each model
Figure 10. The results of the intensity stress $\left(\sigma_{\text {int} .}\right)$ for each model
Figure 11. The results of the von Mises stress $\left(\sigma_{v o n}\right)$ for each model
Table 2. The following degree of freedom results are in the global coordinate system
|
NODE |
Model - 1 |
Model - 2 |
Model - 3 |
Model - 4 |
||||||||
|
$\boldsymbol{U}_x$ mm |
$\boldsymbol{U}_y$ mm |
$\boldsymbol{U}_{\text {sum}}$ mm |
$\boldsymbol{U}_x$ mm |
$\boldsymbol{U}_y$ mm |
$\boldsymbol{U}_{\text {sum}}$ mm |
$\boldsymbol{U}_x$ mm |
$\boldsymbol{U}_y$ mm |
$\boldsymbol{U}_{\text {sum}}$ mm |
$\boldsymbol{U}_x$ mm |
$\boldsymbol{U}_y$ mm |
$\boldsymbol{U}_{\text {sum}}$ mm |
|
|
1 |
0.0 |
0.0 |
0.0 |
0 |
0 |
0 |
0.0 |
0 |
0 |
0.0 |
0.0 |
0.0 |
|
2 |
0.0 |
0.0 |
0.0 |
0.0 |
0.0 |
0.0 |
0.0 |
0.0 |
0.0 |
0.0 |
0.0 |
0.0 |
|
3 |
0.5 |
0.5 |
0.7 |
0.5 |
0.5 |
0.7 |
0.3 |
0.3 |
0.4 |
0.3 |
0.3 |
0.4 |
|
4 |
0.5 |
-0.9 |
1.0 |
0.5 |
-0.4 |
0.6 |
0.3 |
-0.4 |
0.5 |
0.3 |
-0.4 |
0.5 |
|
5 |
2.4 |
1.0 |
2.6 |
1.8 |
1.0 |
2.1 |
1.2 |
0.5 |
1.3 |
1.2 |
0.5 |
1.3 |
|
6 |
2.4 |
-1.6 |
2.8 |
1.8 |
-0.7 |
2.0 |
1.2 |
-0.7 |
1.4 |
1.2 |
-0.7 |
1.4 |
|
7 |
5.4 |
1.5 |
5.6 |
4.0 |
1.5 |
4.3 |
2.7 |
0.8 |
2.8 |
2.7 |
0.8 |
2.8 |
|
8 |
5.4 |
-2.2 |
5.8 |
4.0 |
-1.1 |
4.1 |
2.7 |
-1.1 |
2.9 |
2.7 |
-1.1 |
2.9 |
|
9 |
5.1 |
-9.2 |
10.5 |
3.8 |
-6.9 |
7.9 |
2.4 |
-5.9 |
6.3 |
2.5 |
-5.0 |
5.7 |
|
10 |
4.7 |
-16.7 |
17.4 |
3.6 |
-13.1 |
13.6 |
2.1 |
-11.3 |
11.5 |
2.4 |
-9.4 |
9.7 |
|
11 |
4.6 |
-24.8 |
25.2 |
3.5 |
-19.7 |
20.0 |
1.9 |
-17.2 |
17.3 |
2.3 |
-13.8 |
14.0 |
|
12 |
10.9 |
1.9 |
11.1 |
8.4 |
1.9 |
8.6 |
6.3 |
1.1 |
6.4 |
5.7 |
1.1 |
5.8 |
|
13 |
11.4 |
-2.2 |
11.6 |
8.9 |
-1.1 |
9.0 |
6.6 |
-1.1 |
6.6 |
6.0 |
-1.1 |
6.1 |
|
14 |
11.9 |
-9.2 |
15.0 |
9.4 |
-6.9 |
11.6 |
7.0 |
-5.9 |
9.2 |
6.2 |
-5.0 |
8.0 |
|
15 |
12.0 |
-16.9 |
20.8 |
9.5 |
-13.3 |
16.3 |
7.2 |
-11.4 |
13.5 |
6.3 |
-9.5 |
11.4 |
Table 3. The following different stress values are in global coordinates
|
NODE |
Model - 1 |
Model - 2 |
||||||||||
|
$\sigma_{x}$ MPa |
$\sigma_{1}$ MPa |
$\sigma_{3}$ MPa |
$\sigma_{i n t.}$ MPa |
$\sigma_{von}$ MPa |
$\sigma_{x}$ MPa |
$\sigma_{1}$ MPa |
$\sigma_{3}$ MPa |
$\sigma_{i n t.}$ MPa |
$\sigma_{von}$ MPa |
|||
|
1 |
0.0 |
12.7 |
0.0 |
12.7 |
12.7 |
12.7 |
12.7 |
0 |
12.7 |
12.7 |
||
|
2 |
0.0 |
0.0 |
-16.0 |
16.0 |
16.0 |
-6.4 |
0.0 |
-6.4 |
6.4 |
6.4 |
||
|
3 |
0.5 |
12.7 |
0.0 |
12.7 |
12.7 |
12.7 |
12.7 |
0.0 |
12.7 |
12.7 |
||
|
4 |
0.5 |
0.0 |
-20.5 |
20.5 |
20.5 |
-9.5 |
0.0 |
-9.5 |
9.5 |
9.5 |
||
|
5 |
2.4 |
12.7 |
0.0 |
12.7 |
12.7 |
12.7 |
12.7 |
0.0 |
12.7 |
12.7 |
||
|
6 |
2.4 |
0.0 |
-17.0 |
17.0 |
17.0 |
-9.5 |
0.0 |
-9.5 |
9.5 |
9.5 |
||
|
7 |
5.4 |
12.7 |
0.0 |
12.7 |
12.7 |
12.7 |
12.7 |
0.0 |
12.7 |
12.7 |
||
|
8 |
5.4 |
0.0 |
-16.5 |
16.5 |
16.5 |
-12.8 |
0.0 |
-12.8 |
12.8 |
12.8 |
||
|
9 |
5.1 |
0.0 |
-11.3 |
11.3 |
11.3 |
-6.4 |
0.0 |
-6.4 |
6.4 |
6.4 |
||
|
10 |
4.7 |
0.0 |
-5.5 |
5.5 |
5.5 |
-2.7 |
0.0 |
-2.7 |
2.7 |
2.7 |
||
|
11 |
4.6 |
1.8 |
0.0 |
1.8 |
1.8 |
3.6 |
3.6 |
0.0 |
3.6 |
3.6 |
||
|
12 |
10.9 |
5.0 |
0.0 |
5.0 |
5.0 |
5.0 |
5.0 |
0.0 |
5.0 |
5.0 |
||
|
13 |
11.4 |
17.0 |
0.0 |
17.0 |
17.0 |
17.0 |
17.0 |
0.0 |
17.0 |
17.0 |
||
|
14 |
11.9 |
6.8 |
0.0 |
6.8 |
6.8 |
6.8 |
6.8 |
0.0 |
6.8 |
6.8 |
||
|
15 |
12.0 |
4.0 |
0.0 |
4.0 |
4.0 |
4.0 |
4.0 |
0.0 |
4.0 |
4.0 |
||
|
Model - 3 | Model - 4 | ||||||||||
|
|
$\sigma_{x}$ MPa |
$\sigma_{1}$ MPa |
$\sigma_{3}$ MPa |
$\sigma_{i n t.}$ MPa |
$\sigma_{von}$ MPa |
$\sigma_{x}$ MPa |
$\sigma_{1}$ MPa |
$\sigma_{3}$ MPa |
$\sigma_{i n t.}$ MPa |
$\sigma_{von}$ MPa |
||
|
1 |
7.2 |
7.2 |
0.0 |
7.2 |
7.2 |
7.2 |
7.2 |
0.0 |
7.2 |
7.2 |
||
|
2 |
-6.4 |
0.0 |
-6.4 |
6.4 |
6.4 |
-6.4 |
0.0 |
-6.4 |
6.4 |
6.4 |
||
|
3 |
7.2 |
7.2 |
0.0 |
7.2 |
7.2 |
7.2 |
7.2 |
0.0 |
7.2 |
7.2 |
||
|
4 |
-9.5 |
0.0 |
-9.5 |
9.5 |
9.5 |
-9.5 |
0.0 |
-9.5 |
9.5 |
9.5 |
||
|
5 |
7.2 |
7.2 |
0.0 |
7.2 |
7.2 |
7.2 |
7.2 |
0.0 |
7.2 |
7.2 |
||
|
6 |
-9.5 |
0.0 |
-9.5 |
9.5 |
9.5 |
-9.5 |
0.0 |
-9.5 |
9.5 |
9.5 |
||
|
7 |
7.2 |
7.2 |
0.0 |
7.2 |
7.2 |
7.2 |
7.2 |
0.0 |
7.2 |
7.2 |
||
|
8 |
-14.0 |
0.0 |
-14.0 |
14.0 |
14.0 |
-10.1 |
0.0 |
-10.1 |
10.1 |
10.1 |
||
|
9 |
-11.3 |
0.0 |
-11.3 |
11.3 |
11.3 |
-6.4 |
0.0 |
-6.4 |
6.4 |
6.4 |
||
|
10 |
-5.5 |
0.0 |
-5.5 |
5.5 |
5.5 |
-2.7 |
0.0 |
-2.7 |
2.7 |
2.7 |
||
|
11 |
1.8 |
1.8 |
0.0 |
1.8 |
1.8 |
1.0 |
1.0 |
0.0 |
1.0 |
1.0 |
||
|
12 |
-2.5 |
0.0 |
-2.5 |
2.5 |
2.5 |
2.8 |
2.8 |
0.0 |
2.8 |
2.8 |
||
|
13 |
13.3 |
13.3 |
0.0 |
13.3 |
13.3 |
9.5 |
9.5 |
0.0 |
9.5 |
9.5 |
||
|
14 |
6.8 |
6.8 |
0.0 |
6.8 |
6.8 |
3.8 |
3.8 |
0.0 |
3.8 |
3.8 |
||
|
15 |
4.0 |
4.0 |
0.0 |
4.0 |
4.0 |
1.0 |
1.0 |
0.0 |
1.0 |
1.0 |
||
The values of various displacements and stresses at each node significantly decreased when comparing the values of the three models with the first model in the table and figures (Figures 3-11).
The fluctuations in the values of the various displacements and stresses in the four models at each node are displayed in Tables 2 and 3.
The most significant results from the Excel program are displayed in Figures 12-19, which compare the four models for the various displacements and stresses that manifest on the models when loaded.
The results show that variations in cross-sectional area have a considerable impact on structural integrity and load distribution in beams. Increasing the cross-sectional area often improves the beam's moment of inertia, improving its ability to withstand bending and deflection under load.
Figure 12. Relation between X - component of displacement $\left(U_x\right)$ and node number of all models
Figure 13. Relation between Y - component of displacement $\left(U_y\right)$ and node number of all models
Figure 14. Relation between displacement vector sum $\left(U_{\text {sum}}\right)$ and node number of all models
Figure 15. Relation between normal stress $\left(\sigma_x\right)$ and node number of all models
Figure 16. Relation between first principal stress $\left(\sigma_1\right)$ and node number of all models
Figure 17. Relation between third principal stress $\left(\sigma_3\right)$ and node number of all models
Figure 18. Relation between stress intensity $\left(\sigma_{\text {int.}}\right)$ and node number of all models
Figure 19. Relation between von mises stress $\left(\sigma_{v o n}\right)$ and node number of all models
The most significant findings can be obtained by analyzing and assessing the data from the ANSYS and Excel programs. In each model, some structural components had a different cross-sectional area, with the exception of the first model, which had equal cross-sectional areas in every part of the structure. These results are as follows:
This study suggests carrying out additional theoretical and applied research in the area of truss structural control and the following states of stress, strain, and deformation under load:
Recommend carrying out an experimental investigation of the topics included in this article to demonstrate it practically and carry out additional research if required.
[1] Lenivtsev, G.A.G., Dudanov, I.V. (2021). Modeling the stress-strain state of crane metal structures. IOP Conference Series: Materials Science and Engineering, 1103: 012017. https://doi.org/10.1088/1757-899X/1103/1/012017
[2] Krishnaveni, M.N.V., Reddy, M.A., Roy, M.R. (2015). Static analysis of crane hook with t-section using ANSYS. International Journal of Engineering Trends and Technology (IJETT), 25(1): 53-58. http://doi.org/10.14445/22315381/IJETT-V25P209
[3] Al-Kazzaz, D.A. (2022). Constraint-based design formation - A case study of wind effects on high-rise building designs. International Journal of Design & Nature and Ecodynamics, 17(2): 239-248. https://doi.org/10.18280/ijdne.170210
[4] Wei, C.X., Jia, Y.P., Liu, Q.G., Yu, H.F. (2020). Determining the reasonable height of Vierendeel truss based on stiffness and global stability. International Journal of Safety and Security Engineering, 10(4): 573-578. https://doi.org/10.18280/ijsse.100418
[5] Piątkowski, M. (2018). Critical load of steel trusses - Graphical methods. MATEC Web of Conferences, 219: 02015. https://doi.org/10.1051/matecconf/201821902015
[6] Zhang, Z.J., Chen, B.S., Bai, R., Liu, Y.P. (2023). Non-linear behavior and design of steel structures: Review and outlook. Buildings, 13(8): 2111. https://doi.org/10.3390/buildings13082111
[7] Alatrushi, L.K.H., Kassim, M.T.E., Karash, E.T., Najm, W.M. (2024). The effect of changing the reinforcing angle of a composite material on the tensile and compressive resistance using the ANSYS program. Annales de Chimie - Science des Matériaux, 48(5): 639-653.
[8] Li, Y., Jiang, D., Zhao, R., Wang, X., Wang, L., Zhang, L.C. (2024). High mechanical performance of lattice structures fabricated by additive manufacturing. Metals, 14(10): 1165. https://doi.org/10.3390/met14101165
[9] Huang, Y., Xue, Y., Wang, X., Han, F. (2017). Effect of cross sectional shape of struts on the mechanical properties of aluminum based pyramidal lattice structures. Materials Letters, 202: 55-58. http://doi.org/10.1016/j.matlet.2017.05.073
[10] Queheillalt, D.T., Wadley, H.N.G. (2005). Cellular metal lattices with hollow trusses. Acta Materialia, 53(2): 303-313. https://doi.org/10.1016/j.actamat.2004.09.024
[11] Almeida, C.J., Conde, F.M., Coelho, P.G., Pratas, T.L. (2021). Stiffness and strength-based lightweight design of truss structures using multi-material topology optimization. In IX International Conference on Computational Methods for Coupled Problems in Science and Engineering Coupled Problems. https://doi.org/10.23967/coupled.2021.052
[12] Ismael, M.A., Abd, H.J., Abbas, S.R. (2023). Structural performance of reinforced concrete columns with bracing reinforcement. Annales de Chimie - Science des Matériaux, 47(5): 287-296. https://doi.org/10.18280/acsm.470504
[13] Kassim, M.T.E., Karash, E.T., Sultan, J.N. (2023). A mathematical model for non-linear structural analysis reinforced beams of composite materials. Mathematical Modelling of Engineering Problems, 10(1): 311-333. https://doi.org/10.18280/mmep.100137
[14] Karash, E.T., Ali, H.M., Kassim, M.T.E. (2024). Designing cantilever models from various materials and comparing them when they are under constant load and have holes. Revue des Composites et des Matériaux Avancés-Journal of Composite and Advanced Materials, 34(3): 363-377. https://doi.org/10.18280/rcma.340312
[15] Shrestha, B., Bhandari, A., Poudel, S., Rao, K.V. (2019). Crane hook analysis for different cross-section using ANSYS. International Journal of Advances in Scientific Research and Engineering (IJASRE), 5(12): 67-73. http://doi.org/10.31695/IJASRE.2019.33644
[16] Marchuk, N.I., Deordiev, S.V., Prasolenko, E.V. (2018). Optimal design solutions for structures using ANSYS software. IOP Conferences Series: Materials Science and Engineering, 456: 012022. https://doi.org/10.1088/1757-899X/456/1/012022
[17] Sahirov, Y., Artiukh, V., Mazur, V., Vaynshtok, N., Reshetnikova, I. (2019). Analysis of stress-strain states of casting crane traverse. E3S Web of Conferences, 110: 1-13. https://doi.org/10.1051/e3sconf/20191100
[18] Winarno, Priadi, A.A., Wulandari, R.S. (2024). Shipbuilding risk assessment: Legal frameworks and practical challenges in Indonesian shipyards. International Journal of Safety and Security Engineering, 14(4): 1061-1072. https://doi.org/10.18280/ijsse.140405
[19] Zhao, Y.G.B., Zhang, L.Q. (2020). Damage quantification of frame-shear wall structure with metal rubber dampers under seismic load. Revue des Composites et des Matériaux Avancés-Journal of Composite and Advanced Materials, 30(5-6): 227-234. https://doi.org/10.18280/rcma.305-605
[20] Chalak, H.D., Zenkour, A.M., Garg, A. (2023). Free vibration and modal stress analysis of FG-CNTRC beams under hygrothermal conditions using zigzag theory. Mechanics Based Design of Structures and Machines, 51(8): 4709-4730. https://doi.org/10.1080/15397734.2021.1977659
[21] Xia, L., Wei, Y.L. (2023). Thermal response and damage features of fabricated steel structures under fire. International Journal of Heat and Technology, 41(2): 360-368. https://doi.org/10.18280/ijht.410209
[22] Wangkahart, S., Junsiri, C., Srichat, A., Poojeera, S., Laloon, K., Hongtong, K., Boupha, P. (2022). Using greenhouse modelling to identify the optimal conditions for growing crops in Northeastern Thailand. Mathematical Modelling of Engineering Problems, 9(6): 1648-1658. https://doi.org/10.18280/mmep.090626
[23] Ahmad, N.M., Kharufa, O.H. (2023). The role of nature in developing sustainable structural systems for architecture. International Journal of Sustainable Development and Planning, 18(9): 2655-2662. https://doi.org/10.18280/ijsdp.180904
[24] Liu, X., Saren, S., Chen, H., Li, M., Jeong, J.H., Miyazaki, T., Thu, K. (2025). Dynamic performance analysis of adsorption heat transformer system driven by large pressure jump for low-grade waste heat upgrade. Applied Energy, 377: 124478. https://doi.org/10.1016/j.apenergy.2024.124478
[25] Zawidzki, M. (2013). Creating organic three-dimensional structures for pedestrian traffic with reconfigurable modular ‘Truss-Z’ system. Journal of Design & Nature and Ecodynamics, 8(1): 61-87. https://doi.org/10.2495/DNE-V8-N1-61-87
[26] Mashaly, K.E., El-Heweity, M., Abou-Elfath, H., Osman, M. (2011). Finite element analysis of beam-to-column joints in steel frames under cyclic loading. Alexandria Engineering Journal, 50: 91-104. http://doi.org/10.1016/j.aej.2011.01.012
[27] Sediqer, T.A.A., Karash, E.T., Sultan, J.N., Najem, M.K. (2023). Finding the weight difference of a rectangular structure with a parabolic arc for mathematical models made of steel and other composite materials. WSEAS Transactions on Applied and Theoretical Mechanics, 18: 178-194.
[28] Ali, H.M., Najem, M.K., Karash, E.T., Sultan, J.N. (2023). Stress distribution in cantilever beams with different hole shapes: A numerical analysis. International Journal of Computational Methods and Experimental Measurements, 11(4): 205-219.
[29] Najim, M., Sultan, J., Karash, E. (2020). Comparison of the resistance of solid shell of composite materials with other solid metal materials. IMDC-SDSP 2020: 28-30. https://doi.org/10.4108/eai.28-6-2020.2298518
[30] Karash, E.T. (2011). Modelling of unilateral contact of metal and fiberglass shells. Applied Mechanics and Materials, 87: 206-208. https://doi.org/10.4028/www.scientific.net/AMM.87.206
[31] Karash, E.T., Sediqer, T.A.A., Kassim, M.T.E. (2021). A comparison between a solid block made of concrete and others made of different composite materials. Revue des Composites et des Matériaux Avancés, 31(6): 341-347. https://doi.org/10.18280/RCMA.310605
[32] Najem, M.K., Karash, E.T., Sultan, J.N. (2022). The amount of excess weight from the design of an armored vehicle body by using composite materials instead of steel. Revue des Composites et des Matériaux Avancés-Journal of Composite and Advanced Materials, 32(1): 1-10. https://doi.org/10.18280/rcma.320101
[33] Karash, E.T., Sultan, J.N., Najem, M.K. (2022). The difference in the wall thickness of the helicopter structure are made of composite materials with another made of steel. Mathematical Modelling of Engineering Problems, 9(2): 313-324. https://doi.org/10.18280/mmep.090204