Saad M. Alwash*![]() | Alaa Hamzah Abdullah
| Alaa Hamzah Abdullah![]() | Osama Qasim Jumah Al-Thahab
| Osama Qasim Jumah Al-Thahab![]() | Shamam F. Alwash
| Shamam F. Alwash![]()
© 2025 The authors. This article is published by IIETA and is licensed under the CC BY 4.0 license (http://creativecommons.org/licenses/by/4.0/).
OPEN ACCESS
An important problem in engineering is increasing efficiency, especially in photovoltaic (PV) power generation. The challenge is how to increase PV efficiency and maximize power globally in various environmental conditions. PV output power depends on many variables, such as insolation and temperature. Under fast-varying sunlight conditions, the P-U curve of photovoltaic arrays (PVAs) has several peaks. The Maximum Power Point Tracking (MPPT) employs the Perturb and Observe (P&O) technique, which, when selecting a large step, may fail to extract the global point. On the other hand, when selecting a small step, the result slows down the response to extract MPP. To overcome these limitations, Fibonacci sequence is proposed to improve the perturbation size of P&O control algorithm. This proposed way considers a modified algorithm for adjusting the duty cycle of the boost converter DC-DC and provide a gate pulse to it. The proposed model stand-alone PV system is simulated using MATLAB SIMULINK R2023b environment, and the results are then evaluated to ensure the operation within the specified parameters. The new P&O results show a stable output value is more efficient than the classic P&O MPPT with a fixed step.
PV cell, MPPT, P&O algorithm, Fibonacci series
In fact, renewable energy generation using solar photovoltaic (PV) power, Wind Turbines (WT) energy, and fuel cells is important in reducing environmental problems and climate change [1]. These approaches and methods are becoming more popular as the costs of traditional hydrocarbon fuels increase and the urgency of minimizing carbon dioxide CO2 pollutants increase. Consequently, more people are becoming aware of the pollution created by nonrenewable energy sources [2]. In this context, photovoltaic array systems (PVAs) are one of the common viable environmentally friendly sources of energy today's [3].
A number of research publications have tested and evaluated various methods and algorithms for extracting the MPP of PV to improve system efficiency [4]. These techniques are classified according to measured voltage and current (direct, indirect method), look-up table, fuzzy logic control, and artificial intelligence-based methods [5, 6]. The classic indirect technique divides into fixed designer voltage and Fractional Open Circuit Voltage (FOCV) [7]. On the other hand, the direct, like the Perturbation and Observation (P&O) technique, works by adding or subtracting suitable operation voltage to reach the gradually narrow search range optimal power point. Furthermore, P&O has been commonly used because of its simplicity of structure, good performance, and ease of implementation on inexpensive digital controlling devices. Incremental Conductance (INC) is similar to the working principle of P&O algorithm [8]. In contrast, researchers are utilizing IoT and AI-based systems to send data communication and dynamically maximize energy harvesting by using machine learning techniques that instantly adapt to change in environmental conditions [9-11].
Artificial Neural Networks (ANNs) are a technology that works well with computers and DSPs [12]. Several researchers have developed strategies, such as a deep neural network approach for predicting optimal power points and training end-to-end over embedded networks [13]. Additionally, the MPPT utilizes a new search algorithm based on the improved Fibonacci search, which is an optimization method for PV and wind turbine systems [14, 15].
The classical P&O algorithm has two essential drawbacks: oscillation around the MPP and the difficulty of extracting global MPP under rapidly changing sunlight conditions. The oscillation problem around the MPP has been resolved using various ways to adapt the P&O algorithm with variable steps [16, 17].
Furthermore, various researchers have used different strategies to modify the perturbation size, which has been optimized using algorithms such as PSO, Grey Wolf, and Whale [18-20]. In contrast, a hybrid Neuro-Fuzzy network technique with variable P&O perturbation size is used to extract a global MPPT from a PV-array system [21-23].
This work proposes an improved variable-steps P&O-MPPT algorithm, employing the Fibonacci sequence to adjust the variable steps to track the global power. The proposed system supposed to enhance the MPPT response and efficiency as compared to traditional systems.
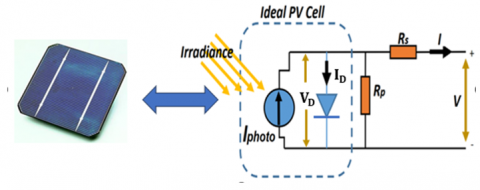
The electrical characteristics of a PV cell can be determined using the ideal equivalent circuit of single-diode model as depicted in Figure 1.
Figure 1. Equivalent model of PV cell
The output of the PV cell includes a voltage in open circuit that is $V_{o c}$, current when output short circuit is $I_{s c}$, and power output is also $P_{\text {max}}$.; the cell conversion can be analyzed as follows [24]:
$I=I_{P h o t o}-I_D-\frac{V_D}{R_P}$ (1)
$V_D=V+I R_S$ (2)
$I_D=I_{{sat. }}\left(e^{\frac{V_D}{A V_T}}-1\right)$ (3)
$I=I_{{Photo. }}-I_{ {sat. }}\left(\mathrm{e}^{\frac{V_D}{A V_T}}-1\right)-\frac{V+I R_s}{R_p}$ (4)
A solar cell gives maximum DC voltage when no current is drawn commonly referred to as the open-circuit voltage $V_{o c}$. A theoretical value for the open-circuit voltage is given:
$V_{o c}=\frac{A K T}{q} \ln \left(\frac{I_{{photo. }}}{I_{{sat. }}}+1\right)$ (5)
A theoretical value for the output maximum current of a solar cell when the terminals of the cell are shorted, known as short-circuit current $I_{S C}$ is given:
$I_{s c} \approx I_{P h o t o}$. (6)
The output characteristics of the outcome solar cell are non-linear and vary due to the climatic factors, the two factors intensity of sunlight, and the cell temperature. The current produced by the PV cell relies on the sunlight and temperature cell, which can be calculated using Eq. (7).
$I(T, G)=\frac{G}{G_{s t c}}\left[I_{s t c}+K_I\left(T-T_{s t c}\right)\right]$ (7)
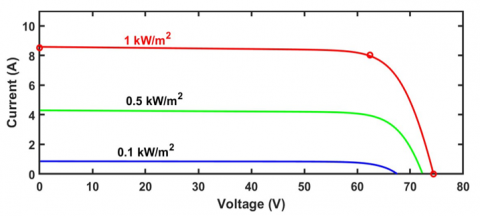
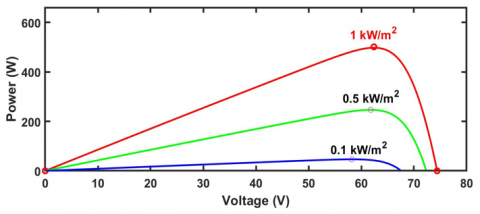
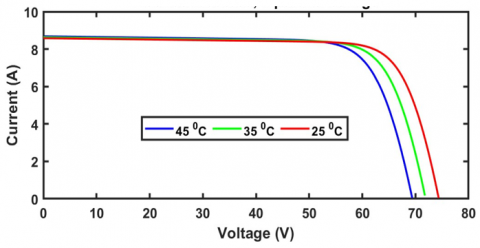
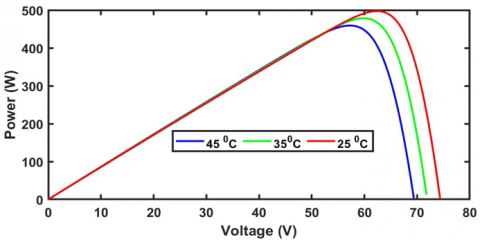
The non-linear characteristics of the outcome of the solar cell in terms of current vs voltage and power vs voltage curve with the intensity of sunlight, which have been tested at constant temperature 25℃ and intensity of $\left(1 \mathrm{KW} / \mathrm{m}^2, 0.5 \mathrm{KW} / \mathrm{m}^2\right.$, and $\left.0.1 \mathrm{KW} / \mathrm{m}^2\right)$, are depicted in Figure 2. On the other hand, the non-linear characteristics of the outcome of the solar cell in terms of ($\mathrm{I}-\mathrm{V}$) and ($\mathrm{P}-\mathrm{V}$) with the intensity of $\left(1 \mathrm{KW} / \mathrm{m}^2\right)$ at the cell temperature have been tested in steps (45℃, 35℃ and 25℃), are depicted in Figure 3. In cases where these two factors change, the MPP also changes. Therefore, voltage and current must be controlled to achieve the optimal power operating point. Table 1 presents the properties of the PV arrays (two module strings) at MPP under various temperature and solar irradiation examples.
Table 1. The properties of the PV array at MPP
|
Conditions test of PV module |
Voltage at Vmpp. (V) |
Current at Impp. (A) |
Max. Power (W) |
|
G1=1 KW/m2 at 25℃ |
62.4 |
8.03 |
501.072 |
|
G2=0.5 KW/m2 at 25℃ |
61.798 |
3.988 |
246.450 |
|
G3=0.1 KW/m2 at 25℃ |
58.189 |
0.799 |
46.493 |
|
G4=1 KW/m2 at 35℃ |
59.750 |
8.006 |
478.358 |
|
G5=1 KW/m2 at 45℃ |
57.214 |
8.026 |
459.199 |
(a) I-V characteristics
(b) P-V characteristics
Figure 2. Effects of sunlight on the properties of PV
(a) I-V curve
(b) P-V curve
Figure 3. Effects of temperature on properties of PV
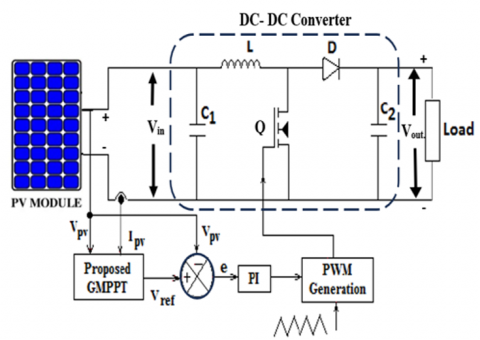
Figure 4 depicts the proposed block schematic of the simulated PV test system to extract MPPT algorithms. It is made up of five major components: the PV module, the boost DC-DC converter, the algorithm MPPT-P&O, PWM generator, and the DC-load (battery or resistance). In an MPPT-PV stand-alone system, a boost converter is positioned among the DC load and the individual solar array. It adjusts the unregulated DC voltage level and optimizes MPPT from the PV panel to the DC-required power.
In general, the boost converter is made up of four component parts: an inductor, a diode, a power transistor switch, and a capacitor. The control algorithm provides the reference voltage signal, and the duty cycle (D value between 0 and 1) is generated by comparing the output of a PI controller to a sawtooth waveform; the gate pulse to drive the power transistor is adjusted according to the error signal $\left(V_{\text {ref. }}-V_{P V(\text { act.})}\right)$, the duty cycle is given by [25-27]:
$Duty \,cycle (D)=1-\frac{V_{{in }}}{V_{{out }}}$ (8)
Figure 4. Block diagram of stand-alone PV systems
Based on the assumption of ideal operational (no losses), these inductors (L) and capacitor (C) equations can be obtained as follows [28]:
$L_{\min }=\frac{V_{{in}} \times D}{\Delta I_{{out } \times f_s}}$ (9)
$C_{\min }=\frac{I_{{out}} \times D}{\Delta V_{{out}} \times f_s}$ (10)
where, $\Delta V_{\text {out}}$. is a ripple output voltage, $\Delta I_{\text {out}}$ is a ripple output current, and $f_s$ is a switch frequency. The MPP input resistance, $R_{i n(m p p)}$, seen by the source, is computed using the voltage $\left(V_{m p p}\right)$ and the current $\left(I_{m p p}\right)$, at the MPP curve.
$R_{i n(m p p)}=\frac{V_{i n(m p p)}}{I_{i n(m p p)}}$ (11)
On the other side, the output voltage can be derived, assuming the system is lossless ($P_{\text {in }}=P_{\text {out.}}$).
$\frac{V_{{in }(m p p)}^2}{R_{{in }(m p p)}}=\frac{V_{{out }(m p p)}^2}{R_{{out }(m p p)}}$ (12)
$\frac{V_{i n(m p p)}^2}{R_{i n(m p p)}}=\frac{\left(\frac{V_{i n(m p p)}}{1-D}\right)^2}{R_{{out }(m p p)}}$ (13)
$R_{{out }(m p p)}=\frac{R_{{in }(m p p)}}{(1-D)^2}$ (14)
$D=1-\sqrt{\frac{R_{{in }(m p p)}}{R_{{out }(m p p)}}}$ (15)
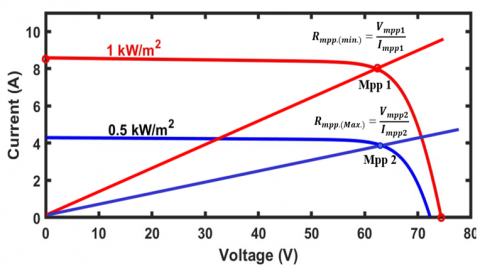
Figure 5 depicts the range of optimal output resistance $R_{m p p (\min)} \leq R_{\text {out}(\text {opt})} \leq R_{m p p (\max )}$, adjusted according to the error signal for the control boost converter with the MPPPV array's at $1000 \mathrm{~W} / \mathrm{m}^2$ and $500 \mathrm{~W} / \mathrm{m}^2$ irradiance levels. From Eq. (12) can be get:
$V_{{out }(m p p)}=V_{{in }(m p p)} \sqrt{\frac{R_{{out }(m p p)}}{R_{{in }(m p p)}}}$ (16)
Figure 5. The range of $R_{{out }(m p p)}$ for the boost converter with the MPP
The maximum output voltage $V_{\text {out}}$. depends on the input voltage $V_{i n .}$ and duty cycle as seen in Eq. (17).
$V_{{out}(\max G)}=\frac{V_{{in(mpp G) }}}{\left(1-D_k\right)}$ (17)
One important difficulty in the design of PV-MPPT systems is the requirement to reach global MPPs rather than search for local MPPs in rapidly changing sunlight conditions. The performance of classic P&O algorithms suffers due to oscillation and reduced system efficiency caused by improper fixed duty ratio D selection and significant perturbation shifts. The improved P&O algorithm with the Fibonacci sequence is proposed to find the maximum power and efficiency when there is no fixed-step. The Fibonacci series $F_n$ is the sum of the two preceding numbers [29]. The Fibonacci series is represented as follows: $F_n=F_{n-2}+F_{n-1}$ for all $n \geq$ 2 when taken $F_o=1$ and $F_1=1$, where $F_n$ is $\mathrm{n}^{\text {th }}$ generation Fibonacci number that can be represented in Table 2:
Table 2. Fibonacci sequence number
|
Index (n) and Fibonacci Values (Fₙ) |
Cases |
||||||||
|
Index (n) |
0 |
1 |
2 |
3 |
4 |
5 |
6 |
7 |
…… |
|
Fibonacci (Fₙ) |
1 |
1 |
2 |
3 |
5 |
8 |
13 |
21 |
…… |
where, the dynamic proposed step size $\Delta V(k)$ at each iteration (k), will be seen in Eq. (18).
$\Delta V(k)=M \times\left[\frac{\Delta P(k)}{\Delta V(k)}\right] \times s(n)$ (18)
The expression $s(n)$ represents a fraction of a Fibonacci number.
$s(n)=\frac{F(n)}{F(n+1)}$ (19)
where, $n=\min ([a .|\Delta P(k)|+b], N)$
The tuning parameters are: a=0.5, b=2, where N: Max. Fibonacci index. The scaling factor M tuning controls the system's performance and is used to regulate the perturbation size.
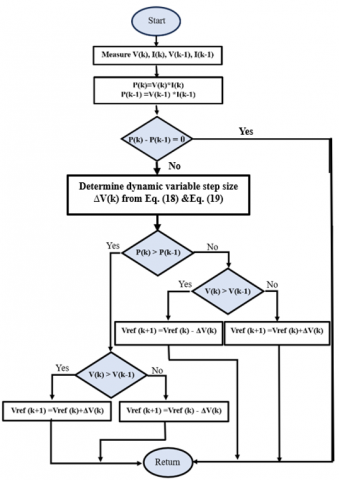
However, when solar radiation or temperature changes, the maximum power output must be adjusted to find the MPP. Typically, two operational regions are illustrated in Figure 6, one on the left side and one on the right side of the power global point in the P-V curve.
The example simulates PV panel ($P_{\text {max }}=240 \mathrm{~W}$) at temperature 25℃ conditions, and here are four distinct cases that can be discussed as follows:
First case at point (1) to reach a point (A): when perturbation occurs, the operational point shifts from $\mathrm{k}-1$ to k . The power and voltage increase during the perturbation $P(k)>P(k-$ 1) and $V(k)>V(k-1)$, presenting that the MPP search is positioned in the correct path. The search for the MPP proceeds in the same direction, raising the perturbation size by $\mathrm{k}+1$ to reach the operational point. After that, a Fibonacci fractional $\left(\frac{F(n)}{F(n+1)}\right)$ and suitable scaling factor M is used to raise the voltage $V_{\text {ref. }}(k+1)=V_{\text {ref. }}(k)+\Delta V(k)$ in a variable step.
Second case at point (1) to reach point (B): when perturbation occurs, the operational point shifts from $\mathrm{k}-1$ to k . The power and voltage decrease during the perturbation $P(k)<P(k-1)$ and $V(k)<V(k-1)$, presenting that the MPP search is positioned in the wrong path. The search for the MPP proceeds must reverse direction and raising the perturbation size by $\mathrm{k}+1$ to reach the correct operational point. The voltage then increases the step size to $V_{\text {ref }}(k+1)=$ $V_{\text {ref. }}(k)+\Delta V(k)$ in a variable step.
In the third case, at point (2) to reach point (C): when perturbation occurs, the operational point shifts from $\mathrm{k}-1$ to k . The power increase during the perturbation $P(k)>P(k-$ 1) and $V(k)<V(k-1)$, indicating that the MPP search is positioned in the correct direction. The search for the MPP proceeds in the same direction, raising the perturbation size by $\mathrm{k}+1$ to reach the operational point. After that, a Fibonacci fractional and suitable scaling factor M is used to decrease the voltage $V_{\text {ref. }}(k+1)=V_{\text {ref. }}(k)-\Delta V(k)$ in a variable step.
In the fourth case, at point (2) to reach point (D): when perturbation occurs, the operational point shifts from $\mathrm{k}-1$ to k . The power decreases during the perturbation $P(k)<P(k-$ 1) and $V(k)>V(k-1)$, presenting that the MPP search is positioned in the wrong path. The search for the MPP proceeds must reverse direction, raising the perturbation size by $\mathrm{k}+1$ to reach the operational point. After that, Fibonacci fractional and suitable scaling factor M is used to decrease the voltage $V_{\text {ref. }}(k+1)=V_{\text {ref. }}(k)-\Delta V(k)$ in a variable step. Figure 7 illustrates a flowchart of proposed improved P&O method.
Table 3 summarizes the four operational cases with variable step sizes to extract the MPP.
Figure 6. A typical P-V curve representing the operational zone of a PV
Table 3. Summary of the four operational cases
|
Cases |
$\Delta \mathbf{P}$ |
$\Delta \mathbf{V}$ |
$\frac{\Delta P}{\Delta V}$ |
$V_{\text {out }}$ Control Action |
|
At Point (1) to reach point (A) |
+ |
+ |
+ |
Increase |
|
At Point (1) to reach point (B) |
- |
- |
+ |
Increase |
|
At Point (2) to reach Point (C) |
+ |
- |
- |
Decrease |
|
At Point (2) to reach Point (D) |
- |
+ |
- |
Decrease |
Figure 7. Flowchart for the proposed P&O algorithm with varying step sizes
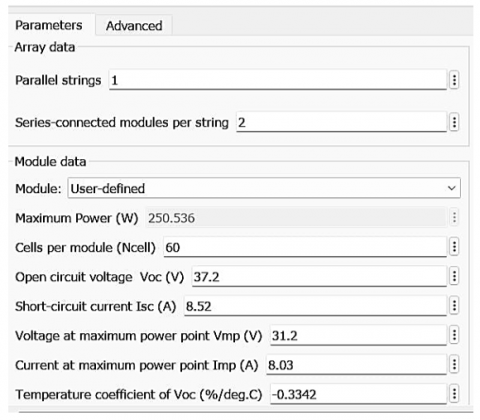
MATLAB/Simulink R2023b was used to model and simulate the proposed system. Additionally, the computational efficiency of the improved $\mathrm{P} \& \mathrm{O}$ and classical $\mathrm{P} \& \mathrm{O}$ algorithms are compared by simulating each MPPT method under similar conditions. In the case study, a with solar module ($P_{\text {max }}=$ 250.536 W), the cell operating temperature is set in every simulation at 25℃. The parameters of a solar PV module are tabulated in Figure 8.
Figure 8. Solar module parameters $\left(G_{S T C}=1000 \mathrm{~W} / \mathrm{m}^2\right)$
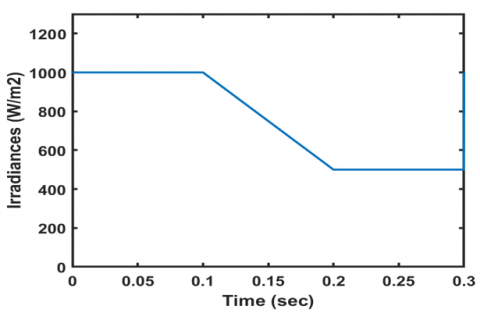
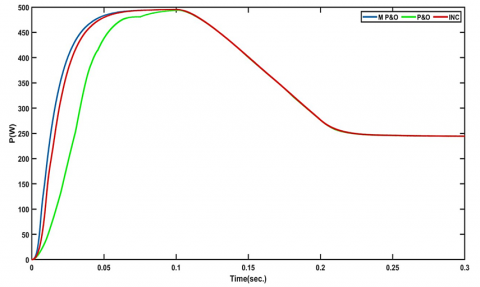
Furthermore, the algorithm must be evaluated at variable sunlight from 0 s to 0.1 s, with the irradiation set at 1000 W/m², and from 0.2 s to 0.3 s, with the irradiation set at 500 W/m² levels, depicted in Figure 9, to determine the performance tracking speed and efficiency. Figure 10 shows that the improved P&O algorithm is more accurate than classical, capable of finding the maximum power, and more efficient because there is no fixed step size. An MPPT algorithm's average efficiency, including improved P&O, can be as follows:
$\eta_{\text {avrg }(M P P T)}=\frac{\int P_{(M P P T)} d t}{\int P_{(\text {Rate } P V \text { panel })} d t} \times 100$ (20)
Figure 9. MATLAB-Simulink operation of the proposed PV system
Figure 10. Graphs for changing irradiances with time
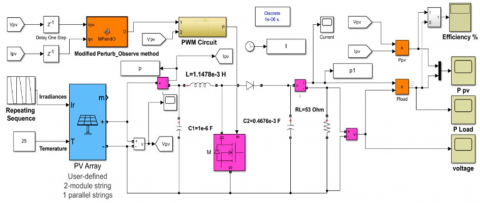
The calculated average MPPT efficiencies for the classical P&O, INC, and improved P&O algorithms are 94.50%, 97.837%, and 98.1 7%, respectively. Table 4 compares the MPPT tests with the algorithms proposed in this study. The fully proposed simulink model was built in MATLAB SIMULINK as can be seen in Figure 11.
Figure 11. MATLAB-Simulink, operation of the proposed PV system
Table 4. Presents a comparison of the three MPPT algorithms
|
Type of Algorithms |
From Variable Irradiation at (T=25°C) |
$\boldsymbol{\eta}_{\text {avrg. }(M P P T)}$ |
|
P&O |
$(1000-500) \mathrm{W} \backslash \mathrm{m}^2$ |
94.50 |
|
MP&O |
Time simulation from |
98.1 |
|
INC |
(0-0.3) sec. |
97.837 |
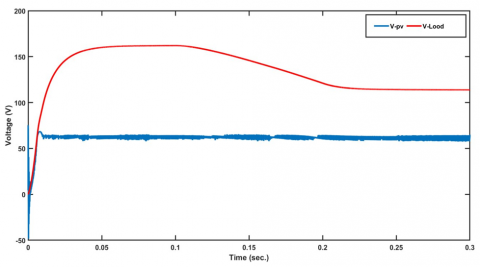
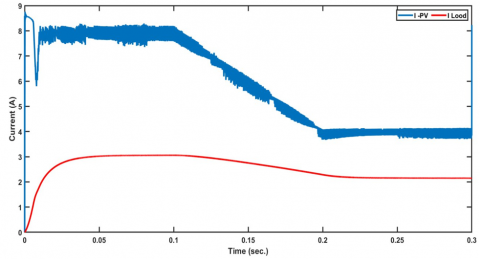
Figure 12 shows the simulation results obtained with the proposed MP&O approach, load voltage, and PV array voltage. On the other hand, Figure 13 shows the output load current and PV array current plotted against running time. The simulation time used in this analysis is 0.3 seconds.
Figure 12. The load voltage and PV output voltage
Figure 13. The load current and PV output current
This paper concerns the proposed improved P&O that employs the Fibonacci fraction and uses dynamic steps to extract the MPP of a PV system. The new method, with variable step size, decreases the swings around the MPP and enhances the MPPT's overall efficiency. It can increase the output efficiency of solar PV by extracting the global MPP under various sunlight conditions. The simulation showed that the improved MPPT algorithm, P&O with Fibonacci fraction, achieved a higher rising time response and MPPT efficiency than conventional MPP methods. Additionally, the advantages are as follows: easy algorithm, fast responses, requiring little calculations (low complexity), and accurate with stable output values.
|
V |
Voltage across the solar cell, (V) |
|
$V_D$ |
Voltage across the diode, (V) |
|
K |
Boltz man constant, $=1.380649 \times 10^{-23} \mathrm{~J} / \mathrm{K}$ |
|
T |
Absolute Temperature of p-n junction, Kelvin (K) |
|
q |
Electron charge $=1.6 \times 10^{-19}$, (C) |
|
I |
An output current of the PV cell, (A) |
|
ID |
Diode current, (A) |
|
$I_{\text {Sat. }}$ |
Diode reverse saturation current, (A) |
|
$I_{\text {photo. }}$ |
Photocurrent generated due to light, (A) |
|
$R_S$ |
Series resistance, (Ω) |
|
$R_P$ |
Parallel resistance, (Ω) |
|
$A$ |
Diode ideality factor |
|
$K_I$ |
Temperature coefficient $\left(I_{s c}\right)$ |
|
G |
Irradiance sunlight |
|
STC |
Standard Test Condition $\begin{aligned}\left(G_{S T C}=1000 \frac{\mathrm{~W}}{\mathrm{~m}^2}\right), & \text { and } T_{S T C} =298 \mathrm{~K}\left(25^{\circ} \mathrm{C}\right)\end{aligned}$ |
|
$V_T=\frac{K T}{q}$ |
Thermal voltage (=25.6 mv at 25℃) |
[1] Macaulay, J., Zhou, Z. (2018). A fuzzy logical-based variable step size P&O MPPT algorithm for photovoltaic system. Energies, 11(6): 1340. https://doi.org/10.3390/en11061340
[2] Piegari, L., Rizzo, R. (2010). Adaptive perturb and observe algorithm for photovoltaic maximum power point tracking. IET Renewable Power Generation, 4(4): 317-328. https://doi.org/10.1049/iet-rpg.2009.0006
[3] Aashoor, F.A.O., Robinson, F.V.P. (2012). A variable step size perturb and observe algorithm for photovoltaic maximum power point tracking. In IEEE 47th International Universities Power Engineering Conference (UPEC), Uxbridge, UK, pp. 1-6. https://doi.org/10.1109/UPEC.2012.6398612
[4] Belabed, M., Bechekir, S., Brahami, M., Bendaho, H., Brahimi, A., Bousmaha, I.S. (2024). Comparative analysis of MPPT algorithms: P&O and Inc for optimizing PV systems. In International Conference on Artificial Intelligence in Renewable Energetic Systems, pp. 60-70. Cham: Springer Nature Switzerland. https://doi.org/10.1007/978-3-031-80301-7_8
[5] Rico-Camacho, R.I., Ricalde, L.J., Bassam, A., Flota-Bañuelos, M.I., Alanis, A.Y. (2022). Transient differentiation maximum power point tracker (Td-MPPT) for optimized tracking under very fast-changing irradiance: A theoretical approach for mobile PV applications. Applied Sciences, 12(5): 2671. https://doi.org/10.3390/app12052671
[6] Udavalakshmi, J.K., Sheik, M.S. (2018). Comparative study of perturb and observe and look-up table maximum power point tracking techniques using MATLABI Simulink. In IEEE International Conference on Current Trends Towards Converging Technologies (ICCTCT), Coimbatore, India, pp. 1-5. https://doi.org/10.1109/ICCTCT.2018.8550835
[7] Nadeem, A., Sher, H.A., Murtaza, A.F. (2020). Online fractional open‐circuit voltage maximum output power algorithm for photovoltaic modules. IET Renewable Power Generation, 14(2): 188-198. https://doi.org/10.1049/iet-rpg.2019.0171
[8] Motahhir, S., El Ghzizal, A., Sebti, S., Derouich, A. (2018). Modeling of photovoltaic system with modified incremental conductance algorithm for fast changes of irradiance. International Journal of Photoenergy, (1): 3286479. https://doi.org/10.1155/2018/3286479
[9] Abdolrasol, M.G., Ayob, A., Mutlag, A.H., Ustun, T.S. (2023). Optimal fuzzy logic controller based PSO for photovoltaic system. Energy Reports, 9: 427-434. https://doi.org/10.1016/j.egyr.2022.11.039
[10] Nath, D.C., Kundu, I., Sharma, A., Shivhare, P., Afzal, A., Soudagar, M.E.M., Park, S.G. (2024). Internet of Things integrated with solar energy applications: A state-of-the-art review. Environment, Development and Sustainability, 26(10): 24597-24652. https://doi.org/10.1007/s10668-023-03691-2
[11] Kathole, A.B., Jadhav, D., Vhatkar, K.N., Amol, S., Gandhewar, N. (2024). Solar energy prediction in IoT system based optimized complex-valued spatio-temporal graph convolutional neural network. Knowledge-Based Systems, 304: 112400. https://doi.org/10.1016/j.knosys.2024.112400
[12] Olabi, A.G., Abdelkareem, M.A., Semeraro, C., Al Radi, M., Rezk, H., Muhaisen, O., Sayed, E.T. (2023). Artificial neural networks applications in partially shaded PV systems. Thermal Science and Engineering Progress, 37: 101612. https://doi.org/10.1016/j.tsep.2022.101612
[13] Abdullah, A.H., Alwash, S.M., Salih Abed, W.M., Al Abboodi, H.M. (2025). Enhanced maximum power point tracking using embedding deep networks and self-adaptive genetic algorithm. International Journal of Intelligent Engineering & Systems, 18(1): 117-132. https://doi.org/10.22266/ijies2025.0229.10
[14] Zhang, J. H., Wei, X.Y., Hu, L., Ma, J.G. (2019). A MPPT method based on improved fibonacci search photovoltaic array. Tehnički Vjesnik, 26(1): 163-170. https://doi.org/10.17559/TV20180721153103
[15] Alwash, S.M., Al-Thahab, O.Q.J., Alwash, S.F. (2024). Improved fibonacci search algorithm for optimal power tracking in DFIG-based wind turbine systems. International Journal of Intelligent Engineering & Systems, 17(3): 771-782. https://doi.org/10.22266/ijies2024.0630.60
[16] Ahmed, J., Salam, Z. (2015). An improved perturb and observe (P&O) maximum power point tracking (MPPT) algorithm for higher efficiency. Applied Energy, 150: 97-108. doi.org/10.1016/j.apenergy.2015.04.006
[17] Ashique, R.H., Salam, Z., Ahmed, J. (2015). An adaptive P&O MPPT using a sectionalized piece-wise linear PV curve. IEEE Conference on Energy Conversion (CENCON), Johor Bahru, Malaysia, pp. 474-479. https://doi.org/10.1109/CENCON.2015.7409591
[18] Abderrahim, Z., Eddine, H.K., Sabir, M. (2021). A new improved variable step size MPPT method for photovoltaic systems using grey wolf and whale optimization technique bbased PID controller. Journal Européen des Systèmes Automatisés, 54(1): 175-185. https://doi.org/10.18280/jesa.540120
[19] Asadi, H. (2019). A modified perturb-and-observe-based maximum power point tracking technique for photovoltaic energy conversion systems. Journal of Control, Automation and Electrical Systems, 30(5): 822-831. https://doi.org/10.1007/s40313-019-00495-6
[20] Harrag, A., Messalti, S. (2019). PSO‐based SMC variable step size P&O MPPT controller for PV systems under fast changing atmospheric conditions. International Journal of Numerical Modelling: Electronic Networks, Devices and Fields, 32(5): e2603. https://doi.org/10.1002/jnm.2603
[21] Chen, Y.T., Jhang, Y.C., Liang, R.H. (2016). A fuzzy-logic based auto-scaling variable step-size MPPT method for PV systems. Solar Energy, 126: 53-63. https://doi.org/10.1016/j.solener.2016.01.007
[22] Kouser, S., Dheep, G.R., Bansal, R.C. (2023). Maximum power extraction in partial shaded grid-connected PV system using hybrid fuzzy logic/neural network-based variable step size MPPT. Smart Grids and Sustainable Energy, 8(2): 7. https://doi.org/10.1007/s40866-023-00161-6
[23] Harrag, A., Messalti, S. (2019). IC-based variable step size neuro-fuzzy MPPT improving PV system performances. Energy Procedia, 157: 362-374. https://doi.org/10.1016/j.egypro.2018.11.201
[24] Yaqoob, S.J., Saleh, A.L., Motahhir, S., Agyekum, E.B., Nayyar, A., Qureshi, B. (2021). Comparative study with practical validation of photovoltaic monocrystalline module for single and double diode models. Scientific Reports, 11(1): 19153. https://doi.org/10.1038/s41598-021-98593-6
[25] Jusoh, A., Alik, R., Guan, T.K., Sutikno, T. (2017). MPPT for PV system based on variable step size perturb and observe algorithm. TELKOMNIKA (Telecommunication Computing Electronics and Control), 15(1): 79-92. https://doi.org/10.12928/telkomnika.v15i1.3160
[26] Hashim, N., Salam, Z., Johari, D., Ismail, N.F.N. (2018). DC-DC boost converter design for fast and accurate MPPT algorithms in stand-alone photovoltaic system. International Journal of Power Electronics and Drive Systems, 9(3): 1038. https://doi.org/10.11591/ijpeds.v9.i3.pp1038-1050
[27] Hayat, A., Sibtain, D., Murtaza, A.F., Shahzad, S., Jajja, M.S., Kilic, H. (2023). Design and analysis of input capacitor in DC-DC boost converter for photovoltaic-based systems. Sustainability, 15(7): 6321. https://doi.org/10.3390/su15076321
[28] Yilmaz, U., Kircay, A., Borekci, S. (2018). PV system fuzzy logic MPPT method and PI control as a charge controller. Renewable and Sustainable Energy Reviews, 81: 994-1001. https://doi.org/10.1016/j.rser.2017.08.048
[29] Tatabhatla, V.M.R., Agarwal, V., Agarwal, A., Singh, A.K. (2024). Reduced partial shading effect and enhancement of performance metrics using a Fibonacci based algorithm. International Journal of Numerical Modelling: Electronic Networks, Devices and Fields, 37(3): e3242. https://doi.org/10.1002/jnm.3242