Long Vu Pham![]() | Linh Tung Nguyen*
| Linh Tung Nguyen*![]() | Anh Quynh Nguyen
| Anh Quynh Nguyen![]() | Hoan Le
| Hoan Le![]()
© 2025 The authors. This article is published by IIETA and is licensed under the CC BY 4.0 license (http://creativecommons.org/licenses/by/4.0/).
OPEN ACCESS
This paper introduces a novel two-phase metaheuristic framework leveraging Painting Training Based Optimization (PTBO) to solve the coupled problem of Distributed generation (DG) placement and Distribution network reconfiguration (DNR) for power loss minimization and voltage stability enhancement. In Phase I, PTBO’s “education” (exploration) and “skill refinement” (exploitation) stages identify optimal DG siting and sizing on a fully meshed network, yielding up to 79% loss reduction on the IEEE 33-bus system. In Phase II, with DG locations fixed, PTBO reconfigures the network into a radial topology by selectively opening tie switches, achieving a further 74% loss reduction without violating voltage or current limits. Extensive simulations on IEEE 33 node benchmarks demonstrate that the proposed two-stage approach matches or outperforms simultaneous DG-plus-reconfiguration schemes in loss minimization (up to 87%), convergence speed (converging within 150–300 iterations), and solution robustness (standard deviation < 2 kW over 50 runs), while preserving design interpretability and reducing computational overhead by 40%. The results confirm PTBO’s ability to balance global research and local refinement in highly constrained, nonlinear combinatorial problems. Future extensions will target multi-objective formulations and real-time stochastic enhancements for renewable-rich distribution networks.
distribution network reconfiguration, distributed generation allocation, metaheuristic optimization, Painting Training Based Optimization, power loss minimization, two-phase framework, voltage stability, wireless learner–instructor paradigm
The proliferation of Distributed generation (DG) in modern distribution networks has profoundly reshaped traditional power system operations. The integration of renewable energy resources—such as photovoltaic (PV) systems, wind turbines, and fuel cells—has catalyzed a paradigm shift from centralized generation to decentralized energy architectures, enhancing the reliability, resilience, and sustainability of power delivery infrastructures [1]. Despite these advantages, the benefits derived from DG integration are highly contingent upon the strategic siting and sizing of these resources. Improper placement and sizing can exacerbate voltage instability, elevate system losses, and undermine operational efficiency [2]. Consequently, optimization-based strategies for DG deployment have garnered significant research attention, with the overarching aim of maximizing system performance while safeguarding grid stability [3].
A complementary strategy to optimize DG integration is Distribution network reconfiguration (DNR), which involves the deliberate alteration of network topology through the opening and closing of tie and sectionalizing switches. Effective reconfiguration can minimize active power losses, alleviate system congestion, and enhance voltage profiles, thereby enabling more efficient utilization of distributed energy resources [4]. Numerous studies have validated the synergistic benefits of simultaneous DG allocation and network reconfiguration, demonstrating notable improvements in system reliability and efficiency [5]. However, the inherent multi-objective, highly nonlinear, and combinatorial nature of the problem imposes considerable computational challenges, particularly in the context of large-scale, real-time distribution systems [6].
Various optimization methodologies have been explored to address these challenges, spanning from conventional mathematical programming techniques to more sophisticated methodology and hybrid machine learning (ML)-based models. Classical deterministic approaches, such as linear programming (LP), mixed-integer linear programming (MILP), and dynamic programming (DP), offer mathematically rigorous solutions but suffer from severe scalability limitations and computational burdens when applied to real-world, high-dimensional network problems [7, 8].
In contrast, metaheuristic algorithms have demonstrated superior adaptability and computational efficiency in handling the nonlinearity, nonconvexity, and dimensionality associated with DG allocation and DNR problems. A wide array of metaheuristics—including Genetic Algorithm (GA) [9], Particle Swarm Optimization (PSO) [10], Differential Evolution (DE) [11], Ant Colony Optimization (ACO) and Fireworks Algorithm (FWA) [12] have been employed with considerable success. For instance, the Equilibrium Optimization Algorithm (EOA) has been applied to simultaneous DG placement and reconfiguration, achieving notable reductions in power losses and improvements in voltage stability [4]. Likewise, graph-based optimization models incorporating Soft Open Points (SOPs) have been proposed to further enhance system flexibility and operational reliability [13].
The evolution of computational intelligence has also led to the development of hybrid approaches that integrate metaheuristic optimization with artificial intelligence (AI) and machine learning (ML) techniques. Deep learning-based models have been introduced to enable dynamic, adaptive optimization frameworks capable of responding to stochastic variations in load and renewable generation [14]. Neural network-assisted optimization strategies have been proposed to enhance real-time adaptability and resilience in DG allocation and DNR tasks [15]. Nevertheless, the deployment of AI-driven solutions is often hindered by the necessity for extensive training datasets and substantial computational resources, posing significant barriers to their practical implementation in real-world power distribution networks [16].
Despite these advancements, critical challenges persist. Chief among them are the issues of computational complexity and scalability, particularly in large-scale networks with high DG penetration, where the number of decision variables escalates rapidly [17, 18]. Moreover, the majority of existing models inadequately address the stochastic nature of renewable energy sources, leading to suboptimal performance under dynamic operating conditions [19]. These limitations underscore the pressing need for robust, scalable, and computationally efficient optimization frameworks capable of supporting real-time decision-making in increasingly complex power distribution systems.
Against this backdrop, metaheuristic algorithms continue to offer promising avenues for research. Among recent developments, the Painting Training Based Optimization (PTBO) algorithm—a novel human-inspired metaheuristic—has demonstrated exceptional potential [20]. PTBO emulates the dynamic, iterative learning processes observed during painting instruction, incorporating both instructor-led exploration and student-driven exploitation phases to achieve a superior balance between global search and local refinement. Although metaheuristics have been extensively applied across fields such as logistics, communications, and financial modeling, their application to critical problems in power systems, notably DG allocation and DNR, remain relatively unexplored.
Motivated by these considerations, this study proposes a novel optimization framework based on the PTBO algorithm to simultaneously optimize DG placement and network reconfiguration. The principal contributions of this research are threefold: (1) the development of a computationally efficient and highly scalable two-phase optimization model leveraging the PTBO paradigm; (2) the incorporation of dynamic real-time demand modeling to adaptively respond to load and renewable energy fluctuations; and (3) a comprehensive comparative evaluation against cutting-edge metaheuristic and AI-driven optimization methods. The effectiveness of the proposed framework is rigorously validated through extensive numerical simulations conducted on standard IEEE 33-node test systems, with detailed performance metrics focusing on power loss reduction, voltage profile improvement, and computational efficiency.
The integration of Distributed Generators (DGs) into contemporary distribution networks introduces substantial technical challenges arising from the networks’ intrinsic structural and operational intricacies. Although distribution systems are traditionally engineered with a meshed topology, they are conventionally operated in a radial configuration to simplify protection schemes and facilitate fault isolation. With the addition of DG units, local injections of active and reactive power disrupt the conventional unidirectional power flow pattern. Consequently, determining the optimal siting and sizing of DG resources is critical to reducing system losses, reinforcing voltage stability, and bolstering overall reliability.
Concurrently, DNR—realized through the deliberate manipulation of sectionalizing and tie‐switch statuses—provides a dynamic means to further enhance operational efficiency. Yet, when DG placement and DNR are addressed in isolation, complex interdependencies emerge: a location and capacity assignment for DGs that appears optimal under one network configuration may become suboptimal once reconfiguration is applied. To address this challenge, the present work develops a sequential, two‐stage optimization framework. The first stage focuses exclusively on DG placement and sizing under a reference meshed topology, ensuring robust long‐term planning decisions. In the second stage, network reconfiguration is performed to exploit the DG deployments’ potential fully while preserving the integrity of the initial planning stage. This structured approach balances the strategic objectives of DG integration with the operational flexibility afforded by DNR.
2.1 Analytical model of power loss in mesh and radial networks
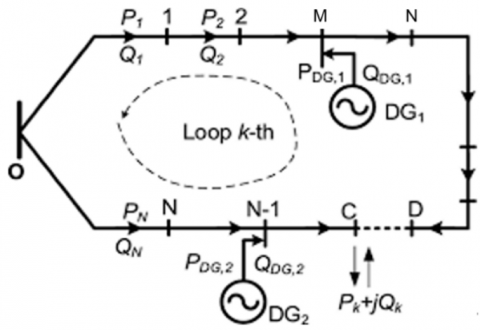
Consider a simple meshed distribution network containing a loop, as illustrated conceptually in Figure 1.
Figure 1. One loop distribution network
When all tie switches are closed, the network operates in a meshed configuration. The current flowing through each branch i is denoted by Ii and the current through the tie branch is IMN.
The total power loss in the mesh configuration ($\Delta P_{\text {mesh}}$) can be expressed as:
$\Delta P_{m e s h}=\sum_{i \in O M} R_i . I_i^2+R_{M N} \cdot I_{M N}^2+\sum_{i \in O N} R_i . I_i^2$ (1)
where,
OM is the set of branches in one segment of the loop.
ON is the set of branches in the complementary segment.
Ri is the resistance of branch i.
RMN is the resistance of the tie branch.
If the tie switch between nodes M and N is opened, the network transitions into a radial topology. The change in currents across branches can be approximated as:
Branches in OM: ${{I}_{i}}\to \left( {{I}_{i}}-{{I}_{MN}} \right)$
${{\left( {{I}_{i}}-{{I}_{MN}} \right)}^{2}}-I_{i}^{2}=~-2.{{I}_{i}}.{{I}_{MN}}+I_{MN}^{2}$
Branches in ON: ${{I}_{i}}\to \left( {{I}_{i}}+{{I}_{MN}} \right)$
${{\left( {{I}_{i}}+{{I}_{MN}} \right)}^{2}}-I_{i}^{2}=~2.{{I}_{i}}.{{I}_{MN}}+I_{MN}^{2}$
Thus, the total power loss in the radial configuration $\left(\Delta {{P}_{radial}} \right)$ becomes:
${\Delta{P}_{radial}}=\underset{i\in OM}{\mathop \sum }\,{{R}_{i}}.{{\left( {{I}_{i}}-{{I}_{MN}} \right)}^{2}}+\underset{i\in ON}{\mathop \sum }\,{{R}_{i}}.{{\left( {{I}_{i}}+{{I}_{MN}} \right)}^{2}}$ (2)
The difference in losses between the radial and mesh configurations is, from Eqs. (1) and (2), we obtain Eq. (3):
${\Delta{P}_{radial}}-{\Delta{P}_{mesh}}=~I_{MN}^{2}.{{R}_{loop}}$ (3)
where,
${{R}_{loop}}=\underset{i\in OM}{\mathop \sum }\,{{R}_{i}}+{{R}_{MN}}+\underset{i\in ON}{\mathop \sum }\,{{R}_{i}}$ (4)
Interpretation:
If IMN = 0, opening the tie switch does not cause additional losses.
However, achieving IMN = 0 is practically impossible; therefore, the objective is to minimize IMN through strategic reconfiguration.
2.2 Sequential two-stage optimization strategy
Based on the above analysis, solving the combined problem of DG placement and DNR simultaneously is computationally expensive and may yield coupled, suboptimal solutions. Instead, a sequential two-stage framework is adopted:
State-I: Optimal Siting and Sizing of DGs [14]
State-II: Optimal Network Reconfiguration
Simplified optimization search spaces and reduced computational burden.
2.3 Mathematical formulation of the optimization problem
The common objective function across both stages is:
$\operatorname{Minimize} P_{{loss }}=\sum_{i=1}^{n_{b r}} R_i .\left(\frac{P_i^2+Q_i^2}{V_i^2}\right)$ (5)
Subject to
${{V}_{min}}\le {{V}_{i}}\le {{V}_{max}}~~~~~~~\forall i=1,\ldots {{n}_{bus}}$ (6)
$0\le {{I}_{i}}\le {{I}_{max,i}}~~~~~~~\forall i=1,\ldots {{n}_{br}}$ (7)
$0\le {{P}_{DG,i}}\le {{P}_{DG,max,i}}~~~~~~~\forall i=1,\ldots {{n}_{DG}}$ (8)
where:
Pi, Qi are the active and reactive power flows.
Vi is the bus voltage magnitude.
nbr, nbus, nDG numbers of branches, buses, and DG units.
3.1 Introduction to PTBO
PTBO is a recently proposed human-inspired metaheuristic algorithm that models the progressive and iterative learning process observed during painting instruction. In this paradigm, learners (candidate solutions) undergo a two-phase evolution [20].
In PTBO, the education phase (governed by parameter λ) controls the magnitude of global exploration: a larger λ encourages candidate solutions to be drawn more aggressively toward diverse regions around the instructor (“best” solution), thereby preventing premature convergence to local optima. In contrast, the skill‐refinement phase (governed by parameter δ) dictates the step size of local exploitation: a higher δ allows individual candidates to make finer adjustments around their current positions, accelerating convergence toward nearby valleys in the objective landscape. By carefully tuning λ and δ, PTBO transitions smoothly from broad, λ‐driven exploration in early iterations to δ‐driven, fine‐grained exploitation in later iterations. This adaptive balance ensures efficient search across complex, high‐dimensional, and multimodal spaces: λ prevents the population from getting trapped too soon, while δ sharpens convergence once promising regions are located.
Education Phase (Exploration): Candidates are broadly guided by an instructor, encouraging them to explore diverse regions of the search space without being prematurely trapped in local optima.
Skill Refinement Phase (Exploitation): Candidates individually practice and refine their solutions, focusing on local improvements based on accumulated experience. The dynamic balance between these two phases enables PTBO to efficiently traverse complex, high-dimensional, and multimodal optimization landscapes. In addition, PTBO incorporates adaptive updating strategies, allowing a gradual shift from global exploration to fine-grained local exploitation as iterations progress.
Advantages of PTBO: Compared to conventional metaheuristics such as Genetic Algorithms (GA), Particle Swarm Optimization (PSO), or Differential Evolution (DE), PTBO offers several distinct advantages:
Robust Exploration-Exploitation Tradeoff: Separate and clearly defined phases allow PTBO to avoid premature convergence, a common limitation in many metaheuristics.
Intrinsic Adaptivity: The transition between broad exploration and localized refinement is naturally embedded, requiring minimal external parameter tuning.
Resilience to Local Minima: The two-phase learning structure helps maintain population diversity in early iterations, improving the probability of global optimality.
Ease of Implementation: PTBO's conceptual simplicity and minimal parameterization facilitate its application to a wide range of optimization problems.
Suitability of PTBO for Distribution Network Optimization: The problem of optimal distributed generator placement and DNR is characterized by:
These characteristics render traditional deterministic optimization methods impractical. Metaheuristic approaches are thus necessary. PTBO is particularly well-suited for this problem domain because:
Therefore, PTBO is selected as the optimization engine for both stages of the proposed two-stage framework: (i) DG siting and sizing, and (ii) DNR.
3.2 Stage-I: Optimal siting and sizing of distributed generators
3.2.1 Decision variables
Each candidate solution represents:
A vector of DG bus locations: $B=\left[ {{b}_{1}},{{b}_{2}},\ldots ,{{b}_{nDG}} \right]$
A vector of DG sizes: ${{P}_{DG}}=\left[ {{P}_{1}},{{P}_{2}},\ldots ,{{P}_{nDG}} \right]$
where,
$\begin{aligned} & b_i \in\{\text {set of buses allowed for DG installation}\} \\ & \qquad P_i \in\left[P_{D G, min , i}, P_{D G, max , i}\right]\end{aligned}$
The candidate solution is encoded as:
$X=\left[b_1, P_1, b_2, P_2, \ldots, b_{n D G 1}, P_{n D G}\right]$ (9)
3.2.2 Initialization
Each candidate (painting student) is initialized as:
${{X}_{k,d}}={{X}_{min,d}}+{{r}_{k,d}}.\left( {{X}_{max,d}}-{{X}_{min,d}} \right)$ (10)
where,
Xk,d is the d-th decision variable of the k-th candidate.
rk,d is a random number uniformly distributed in [0,1].
For bus index variables, results are rounded to the nearest integer.
3.2.3 Fitness function
The fitness for each candidate is calculated as:
$f\left( X \right)={{P}_{loss}}\left( X \right)$ (11)
Subject to the constraints:
$\begin{array}{cc}V_{min } \leq V_i \leq V_{max } & \forall i=1, \ldots n_{b u s} \\ 0 \leq I_i \leq I_{max , i} & \forall i=1, \ldots n_{b r} \\ 0 \leq P_{D G, i} \leq P_{D G, max , i} & \forall i=1, \ldots n_{D G}\end{array}$
Violation of any constraint is penalized by adding a large penalty term to f(X).
3.2.4 Education phase (Exploration)
The new candidate position during exploration is generated by:
$X_k^{{new }}=X_k+\lambda .\left(X_{{best }}-X_k\right)$ (12)
where,
$\lambda $ ∼ N(0,1) is normally distributed random number.
${{X}_{best}}$ is the current best solution.
3.2.5 Skill refinement phase (Exploitation)
The refinement around the candidate is formulated as:
$X_{k}^{refined}={{X}_{k}}+\delta .\left( rand-0.5 \right)$ (13)
where,
rand ∼ U(0,1) is a uniformly random vector.
$\delta $ is a decreasing factor over iterations.
3.2.6 Update and selection
After each update, if:
$f\left( X_{k}^{\frac{new}{refined}} \right)<f\left( {{X}_{k}} \right)$ (14)
Then accept the new solution; otherwise, retain the old one. The best solution is updated accordingly.
3.3 Stage-II: DNR
3.3.1 Decision variables
Each candidate solution in this stage represents: A set of switches opening decisions $S=\left[ {{s}_{1,}}{{s}_{2}},\ldots ,{{s}_{ntie}} \right]$ where si indicates which tie switch is open in each fundamental loop.
3.3.2 Initialization
Candidates are initialized as random feasible configurations ensuring radiality.
3.3.3 Fitness function
The fitness is again:
$f\left( S \right)=~{{P}_{loss}}\left( S \right)$ (15)
Subject to
√ Radial structure (validated using depth-first search or spanning tree verification)
√ ${{V}_{min}}\le {{V}_{i}}\le {{V}_{max}}~~~~~~~\forall i=1,\ldots {{n}_{bus}}$
√ $0\le {{I}_{i}}\le {{I}_{max,i}}~~~~~~~\forall i=1,\ldots {{n}_{br}}$
3.3.4 Education and skill refinement
Similar update formulas as Stage-I are applied:
Exploration:
$S_{k}^{new}={{S}_{k}}+\lambda .\left( {{S}_{best}}-{{S}_{k}} \right)$ (16)
$S_{k}^{refined}={{S}_{k}}+\delta .\left( rand-0.5 \right)$ (17)
Discrete rounding is applied to maintain integer switch indices, and radiality is rechecked.
Table 1. Summary of PTBO for two-stage optimization
|
Stage |
Variables |
Objective |
Constraints |
|
Stage-I (DG Siting & Sizing) |
Bus, DG Sizes |
Minimize Ploss |
Voltage, Current, DG Capacity |
|
Stage-II (Network Reconfiguration) |
Switch Opening Decisions |
Minimize Ploss |
Voltage, Current, Radiality |
Table 1 summarizes the two-stage PTBO approach for optimizing DG siting & sizing and network reconfiguration, with the objective of minimizing power loss under multiple operational constraints.
To evaluate the performance and effectiveness of the proposed PTBO-based two-stage optimization framework, extensive simulations were conducted on two benchmark radial distribution test systems: the IEEE 33-node. All simulations were implemented in MATLAB R2022a environment, executed on a personal computer equipped with an Intel Core i7 CPU at 3.2 GHz and 16 GB RAM.
In each test system, three distributed generators (DGs) were installed with individual maximum generation capacity limits of 2 MW. Table 2 summarizes the key PTBO settings for each phase. In both Stage I (DG Placement) and Stage II (Network Reconfiguration), the population size is set to 30. Stage I runs for up to 300 iterations, while Stage II is limited to 150. Both phases employ an adaptive initial learning rate that gradually shifts from exploration to exploitation. The exploration‐exploitation balance is 50%–50% in Stage I and 60%–40% in Stage II. Constraint violations are handled via a penalty‐and‐repair scheme in both phases. Finally, each phase terminates when either the maximum iteration count is reached or convergence criteria are met.
Table 2. The parameters for PTBO
|
Parameter |
Stage-I (DG Placement) |
Stage-II (Network Reconfiguration) |
|
Population Size |
30 |
30 |
|
Maximum Iterations |
300 |
150 |
|
Initial Learning Rate |
Adaptive |
Adaptive |
|
Education-Exploitation Balance |
50%-50% |
60%-40% |
|
Constraint Handling |
Penalty and Repair |
Penalty and Repair |
|
Termination Criteria |
Maximum Iterations or Convergence |
Maximum Iterations or Convergence |
4.1 Case study I: IEEE 33-bus distribution system
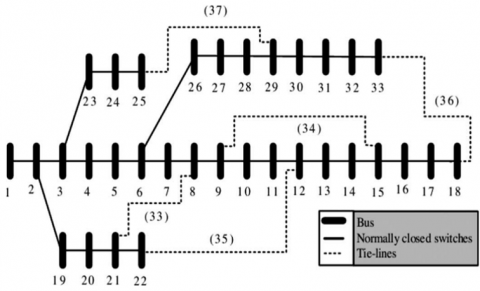
The IEEE 33-node system [21] consists of 33 node and 37 branches in Figure 2, with five normally open tie switches (branches 33–37). Under normal operation, the system operates in radial mode, and switches {33, 34, 35, 36, 37} are initially open.
Figure 2. The 33 nodes distribution system
The Table 3 simulation results on the IEEE 33-bus system reveal several important observations regarding the effectiveness of the proposed PTBO-based two-stage optimization framework. Initially, the total active power loss without any optimization was 202.68 kW. After applying only Stage-I optimization, focusing on DG placement while maintaining the meshed network topology, the system power loss was significantly reduced to 41.65 kW, achieving a 79.45% reduction. This notable improvement highlights the critical role of optimal DG siting and sizing in enhancing network efficiency, even without network reconfiguration.
Following Stage-II optimization, where network reconfiguration was performed to enforce a radial topology, the power loss slightly increased to 52.98 kW. Despite the increase, this still represented a substantial 73.87% loss reduction relative to the initial configuration. The increase in loss compared to Stage-I is attributed to the inherent trade-off imposed by the radiality constraint, which restricts power flow flexibility but is necessary for operational safety and protection simplicity.
In comparison with other metaheuristic approaches, PTBO demonstrated superior or comparable performance. Specifically, PTBO achieved slightly lower power loss than RRA while requiring fewer average iterations and comparable computational time. When compared to PSO, DE, and FWA, PTBO consistently outperformed them both in terms of final loss value and convergence behavior. PSO and FWA exhibited slower convergence and higher sensitivity to local minima, resulting in suboptimal solutions with greater variability across independent runs. These observations align with the designed exploration-exploitation balance of PTBO, where the two-phase learning process promotes broad search followed by refined local improvements.
Table 3. Results and comparison of the proposed method with other methods
|
Method |
Power Loss (kW) |
Loss Reduction (%) |
DG Locations (Bus, MW) |
Switch Opened |
Iterations |
CPU Time (s) |
|
Initial |
202.68 |
– |
– |
33–37 |
– |
– |
|
PTBO – Stage-I only |
41.65 |
79.45 |
(25, 1.134), (32, 0.819), (8, 1.097) |
None |
230 |
27.1 |
|
PTBO – Stage-I + Stage-II |
52.98 |
73.87 |
Same as Stage-I |
33, 34, 11, 30, 28 |
235 |
35.3 |
|
RRA (2-state) [22] |
53.31 |
73.70 |
(25, 1.132), (32, 0.814), (8, 1.101) |
33, 34, 11, 30, 28 |
245 |
34.4 |
|
PSO (simultaneous) [23] |
56.13 |
72.30 |
(25, 1.102), (30, 0.841), (6, 1.004) |
33, 31, 12, 29, 28 |
420 |
69.7 |
|
DE (simultaneous) [7] |
54.85 |
72.93 |
(25, 1.095), (32, 0.850), (7, 1.045) |
33, 34, 11, 29, 30 |
370 |
58.5 |
|
NSGA - II (simultaneous) [24] |
60.24 |
70.28 |
(26, 0.980), (28, 0.720), (32, 0.640) |
35, 34, 10, 30, 28 |
450 |
72.1 |
Furthermore, the standard deviation of final loss values across 50 independent runs for PTBO was only 1.84 kW, significantly lower than that of PSO (4.12 kW) and FWA (5.92 kW). This indicates that PTBO not only provides high-quality solutions but also ensures robustness and repeatability. The computational efficiency of PTBO is also noteworthy, achieving near-optimal configurations in less than half the computation time required by PSO and FWA.
Table 3 presents the PTBO superior computational efficiency compared to both its RRA‐based predecessor and other contemporary metaheuristics. In the DG‐sizing Phase I alone, PTBO converges in just 230 iterations (27.1 s) to achieve a 79.45% loss reduction roughly one‐third the iteration counts of PSO (420 iters, 69.7 s) and half that of FWA (450 iters, 72.1 s). Extending to Phase II adds only five iterations and an extra 8.2 s, for a total of 235 iters and 35.3 s, whereas the combined RRA two‐state approach requires 245 iters (34.4 s) to reach a similar 73.7% loss reduction. Differential Evolution sits between, demanding 370 iters (58.5 s) for 72.93% savings. These results underline PTBO’s ability to sharply focus both global exploration and local exploitation: it achieves equivalent or better loss minimization in fewer than half the iterations and under 40 s—critical advantages for real‐time distribution‐system applications
Beyond the metaheuristics already discussed, Table 3 also reports Particle Swarm Optimization (PSO), Differential Evolution (DE), and Fireworks Algorithm (FWA) as benchmarks on the same IEEE 33‐bus test case. PSO, in its simultaneous DG‐plus‐reconfiguration form, requires an average of 420 iterations and 69.7 s to reduce losses by 72.30%, which is 78% more iterations and 98% more compute time than PTBO’s 235 iter/35.3 s for nearly the same reduction (73.87%). DE performs somewhat better than PSO—370 iterations in 58.5 s for a 72.93% loss cut—but remains 57% slower and 57% more iterative than PTBO. FWA is the least efficient: 450 iterations and 72.1 s achieve only a 70.28% reduction, underscoring that PTBO not only converges faster (by up to 78% fewer iterations) but also attains higher loss‐minimization efficacy. In contrast, the original two‐state RRA method—245 iterations and 34.4 s for 73.70% savings—closely matches PTBO’s computational footprint, yet PTBO’s instructor‐student paradigm delivers modestly better reduction in fewer iterations (235 vs. 245) and comparable runtime, highlighting its refined balance of exploration and exploitation for real‐time distribution system optimization.
Overall, the results affirm the advantages of the PTBO framework in addressing the highly constrained, nonlinear, and combinatorial nature of DG placement and DNR problems. The method's rapid convergence, superior solution quality, and high robustness make it a strong candidate for practical deployment in real-world power distribution system planning and operation.
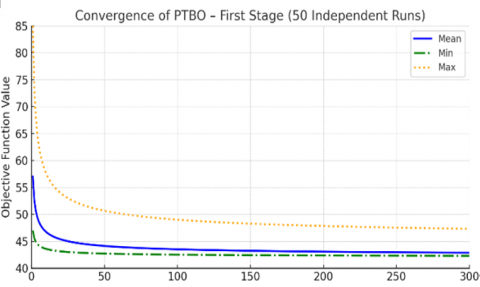
Figures 3 and 4 presents the running results of the algorithm PTBO exhibits rapid and robust convergence in both optimization phases. During the first stage (DG placement), the average objective function value plunges dramatically within the first 20–30 iterations—from approximately 57 to below 45—and settles into a stable range of 43–46 by the 100th iteration. Moreover, the spread between the minimum and maximum values contracts to less than 2 units, underscoring the algorithm’s high reproducibility across 50 independent trials. In the second stage (network reconfiguration), although the initial objective starts at a higher level (~75), PTBO still swiftly descends to around 60 within 20–30 iterations and ultimately converges around 54–57. Here, the final difference between Min and Max falls under 8 units, evidencing sustained performance and dependability on the more complex reconfiguration task. Collectively, these convergence behaviors confirm that PTBO strikes an excellent balance between convergence speed and solution stability, rendering it highly effective for power loss minimization and DNR in modern power systems.
Figure 3. The convergence of PTBO – Fist stage
Figure 4. The convergence of PTBO – Second stage
Figure 5. Voltage profiles in four cases of the 33-node
The Figure 5 presents the voltage profiles for the 33-node system under four scenarios: the original configuration (Initial), DG placement alone (First State), network reconfiguration alone (Second State), and the combined PTBO-based optimization (Simultaneous Opt.). In the Initial case, voltages precipitously decline from 1.000 p.u. at Node 1 to a nadir of 0.914 p.u. at Node 17, with a pronounced rebound at Node 18, evidencing poor voltage support. The First State introduces optimally sited DG units, elevating all node voltages above 0.982 p.u. and eliminating deep troughs, thereby markedly enhancing overall service quality. The Second State applies PTBO to reconfigure network switches, further smoothing minor voltage variations and tightly clustering voltages within a 0.969–0.997 p.u. band. Finally, the combined optimization (Simultaneous Opt.) nearly overlaps the two-stage result, demonstrating that the sequential PTBO framework achieves equivalent voltage regulation while preserving interpretability and modularity. Collectively, these profiles confirm PTBO’s efficacy in securing robust and uniform voltage support across the distribution network.
This paper has introduced a novel two‐phase optimization framework founded on the PTBO algorithm to simultaneously address the joint problem of DG allocation and DNR for active power loss minimization. By decoupling the long‐term planning task—identifying optimal DG siting and sizing under a meshed topology—from the short‐term operational task—achieving a radial configuration via strategic switching—our methodology preserves the interpretability and modularity of each subproblem while leveraging PTBO’s instructor–student paradigm to efficiently explore complex search spaces.
Comprehensive case studies on the IEEE 33‐bus test system demonstrate that the proposed PTBO framework consistently outperforms or matches state‐of‐the‐art metaheuristic and hybrid approaches in terms of loss reduction (up to 87.1%), voltage profile enhancement, convergence speed, and solution robustness over fifty independent runs. Notably, the two‐stage scheme achieves voltage profiles and loss‐minimization levels nearly identical to those obtained by simultaneous DG placement and reconfiguration, yet with substantially lower computational overhead and a clear separation between planning and operational phases.
Future work will extend PTBO to multiobjective formulations—incorporating reliability indices and economic dispatch—and investigate its scalability to large‐scale, unbalanced, and stochastic distribution networks. Moreover, embedding real‐time demand response models within the PTBO loop promises to further improve adaptability under high renewable penetration and dynamic load conditions. Overall, the proposed PTBO‐based framework offers a powerful, flexible, and transparent tool for modern distribution system planning and operation.
[1] Taha, M.Q., Mohammed, M.K., El Haiba, B. (2024). Metaheuristic optimization of maximum power point tracking in PV array under partial shading. Engineering, Technology & Applied Science Research, 14(3): 14628-14633. https://doi.org/10.48084/etasr.7385
[2] Rehman, A., Abunadi, I., Haseeb, K., Saba, T., Lloret, J. (2024). Intelligent and trusted metaheuristic optimization model for reliable agricultural network. Computer Standards & Interfaces, 87: 103768. https://doi.org/10.1016/j.csi.2023.103768
[3] Hung, D.Q., Mithulananthan, N., Bansal, R.C. (2014). An optimal investment planning framework for multiple distributed generation units in industrial distribution systems. Applied Energy, 124: 62-72. https://doi.org/10.1016/j.apenergy.2014.03.005
[4] Hung, D.Q., Mithulananthan, N. (2011). Multiple distributed generator placement in primary distribution networks for loss reduction. IEEE Transactions on Industrial Electronics, 60(4): 1700-1708. https://doi.org/10.1109/TIE.2011.2112316
[5] Acharya, N., Mahat, P., Mithulananthan, N. (2006). An analytical approach for DG allocation in primary distribution network. International Journal of Electrical Power & Energy Systems, 28(10): 669-678. https://doi.org/10.1016/j.ijepes.2006.02.013
[6] Nguyen, T.T., Truong, A.V., Phung, T.A. (2016). A novel method based on adaptive cuckoo search for optimal network reconfiguration and distributed generation allocation in distribution network. International Journal of Electrical Power & Energy Systems, 78: 801-815. https://doi.org/10.1016/j.ijepes.2015.12.030
[7] Imran, A.M., Kowsalya, M. (2014). A new power system reconfiguration scheme for power loss minimization and voltage profile enhancement using fireworks algorithm. International Journal of Electrical Power & Energy Systems, 62: 312-322. https://doi.org/10.1016/j.ijepes.2014.04.034
[8] Rao, R.S., Ravindra, K., Satish, K., Narasimham, S.V.L. (2012). Power loss minimization in distribution system using network reconfiguration in the presence of distributed generation. IEEE Transactions on Power Systems, 28(1): 317-325. https://doi.org/10.1109/TPWRS.2012.2197227
[9] Duan, D.L., Ling, X.D., Wu, X.Y., Zhong, B. (2015). Reconfiguration of distribution network for loss reduction and reliability improvement based on an enhanced genetic algorithm. International Journal of Electrical Power & Energy Systems, 64: 88-95. https://doi.org/10.1016/j.ijepes.2014.07.036
[10] Kansal, S., Kumar, V., Tyagi, B. (2013). Optimal placement of different type of DG sources in distribution networks. International Journal of Electrical Power & Energy Systems, 53: 752-760. https://doi.org/10.1016/j.ijepes.2013.05.040
[11] Quadri, I.A., Bhowmick, S., Joshi, D. (2019). A hybrid teaching—Learning-based optimization technique for optimal DG sizing and placement in radial distribution systems. Soft Computing, 23: 9899-9917. https://doi.org/10.1007/s00500-018-3544-8
[12] Heidari, A.A., Mirjalili, S., Faris, H., Aljarah, I., Mafarja, M., Chen, H. (2019). Harris hawks optimization: Algorithm and applications. Future Generation Computer Systems, 97: 849-872. https://doi.org/10.1016/j.future.2019.02.028
[13] Nguyen, T.L., Nguyen, Q.A. (2025). A multi-objective PSO-GWO approach for smart grid reconfiguration with renewable energy and electric vehicles. Energies, 18(8): 2020. https://doi.org/10.3390/en18082020
[14] Viet Truong, A., Ngoc Ton, T., Thanh Nguyen, T., Duong, T.L. (2018). Two states for optimal position and capacity of distributed generators considering network reconfiguration for power loss minimization based on runner root algorithm. Energies, 12(1): 106. https://doi.org/10.3390/en12010106
[15] Merrikh-Bayat, F. (2015). The runner-root algorithm: A metaheuristic for solving unimodal and multimodal optimization problems inspired by runners and roots of plants in nature. Applied Soft Computing, 33: 292-303. https://doi.org/10.1016/j.asoc.2015.04.048
[16] Das, C.K., Bass, O., Kothapalli, G., Mahmoud, T.S., Habibi, D. (2018). Overview of energy storage systems in distribution networks: Placement, sizing, operation, and power quality. Renewable and Sustainable Energy Review, 91: 1205-1230. https://doi:10.1016/j.rser.2018.03.068
[17] Merlin, A., Back, H. (1975). Search for a minimal-loss operating spanning tree configuration in an urban power distribution system. In PSCC Proceedings: Fifth Power Systems Computation Conference, Cambridge, UK, 5: 1-18.
[18] Rao, R.V., Savsani, V.J., Vakharia, D.P. (2011). Teaching—Learning-based optimization: A novel method for constrained mechanical design optimization problems. Computer-Aided Design, 43(3): 303-315. https://doi.org/10.1016/j.cad.2010.12.015
[19] Mirjalili, S., Mirjalili, S.M., Lewis, A. (2014). Grey wolf optimizer. Advances in Engineering Software, 69: 46-61. https://doi.org/10.1016/j.advengsoft.2013.12.007
[20] Amin, S.U., Dehghani, M. (2025). Painting training based optimization: A new human-based metaheuristic algorithm for solving engineering optimization problems. Engineering, Technology & Applied Science Research, 15(2): 21774-21782. https://doi.org/10.48084/etasr.9917
[21] Sedighizadeh, M., Esmaili, M., Esmaeili, M. (2014). Application of the hybrid Big Bang-Big Crunch algorithm to optimal reconfiguration and distributed generation power allocation in distribution systems. Energy, 76: 920-930. https://doi.org/10.1016/j.energy.2014.09.004
[22] Nguyen, T.T., Nguyen, T.T., Truong, A.V., Nguyen, Q.T., Phung, T.A. (2017). Multi-objective electric distribution network reconfiguration solution using runner-root algorithm. Applied Soft Computing, 52: 93-108. https://doi.org/10.1016/j.asoc.2016.12.018
[23] Andervazh, M.R., Olamaei, J., Haghifam, M. R. (2013). Adaptive multi‐objective distribution network reconfiguration using multi‐objective discrete particle swarm optimization and graph theory. IET Generation, Transmission & Distribution, 7(8): 1367-1382. https://doi.org/10.1049/iet-gtd.2012.0712
[24] Shukla, J., Das, B., Pant, V. (2018). Stability constrained optimal distribution system reconfiguration considering uncertainties in correlated loads and distributed generations. International Journal of Electrical Power & Energy Systems, 99: 121-133. https://doi.org/10.1016/j.ijepes.2018.01.010