Evaristus Didik Madyatmadja*![]() | Hubert Candra
| Hubert Candra![]() | Jovan Nathaniel
| Jovan Nathaniel![]() | Miguel Roland Jonathan
| Miguel Roland Jonathan![]() | Rudy
| Rudy![]()
© 2024 The authors. This article is published by IIETA and is licensed under the CC BY 4.0 license (http://creativecommons.org/licenses/by/4.0/).
OPEN ACCESS
The primary goal of this study is to compare the analysis results of sentiment analysis using three different machine learning models: Naïve Bayes, Support Vector Machine (SVM), and Random Forest. The raw dataset used for this study is sourced from the Google Play Scraper API, which is then preprocessed to ensure quality and accuracy of feature extraction. Once preprocessed, the machine divides the dataset for training and testing using the 80:20 rule. The results of this comparison provide insights into the strengths and weaknesses of each algorithm in the context of sentiment analysis of user reviews. This study aims to inform practitioners about the most effective techniques for extracting actionable insights from user-generated content on digital platforms. The evaluation shows that the Naïve Bayes model achieved the highest accuracy of 81%, followed by the SVM model with 80%, and the Random Forest model with 76%. These findings highlight the Naïve Bayes model as the most accurate for sentiment analysis in this context, with all models demonstrating robust performance.
user review, machine learning, naive bayes, SVM, random forest, preprocessing, sentiment analysis
1.1 Research background
Threads is a new application built by Instagram team that allows users to share their thoughts and discuss topics with others through text messages [1]. According to reports from Statista, Threads generated over 73 million application downloads in their first month of release, initially launched in 100 countries [2]. Over the course of December 2023, Threads have gained 141 million users, with over 73 million monthly active users worldwide [3].
The data shown is certainly compelling, knowing that Threads as a new social media application gained so many numbers of users in such a short time. Even so, when compared to its old competitor X, Threads users are arguably less than half of X's 500 million users by September 2023 [4].
Threads, a social media application presented by Meta, experience a significant surge in popularity upon its launch in Indonesia in August 2023. Threads reached a peak of nearly 49 million daily active users (DAUs) in early July 2023, rivaling Twitter's DAU at the time [CNBC Indonesia]. However, user engagement dropped significantly by mid-July [5].
In the dynamic landscape of social media platforms like Threads, understanding user engagement and feedback is crucial for application developers and businesses. Just as users share their experiences on Threads, they also leave application reviews on platforms like the Google Play Store, which can significantly impact other users' decisions to download or refrain from downloading the application. These reviews not only influence other users' decisions but also provide valuable insights for developers, helping them improve their applications and stay competitive in the rapidly evolving mobile application industry [6].
The rapid proliferation of social media platforms like Threads underscores the importance of understanding user sentiment through robust sentiment analysis techniques. As a new entrant developed by Instagram, Threads has quickly gained traction in Indonesia, making it imperative to gauge user feedback effectively. This study focuses on comparing the effectiveness of three prominent machine learning models—Naïve Bayes, Support Vector Machine (SVM), and Random Forest—in analyzing sentiment from user reviews on Threads retrieved from the Google Play Store.
Previous research has shown that sentiment analysis can be a powerful tool for extracting valuable insights from user-generated content. For instance, researchers in 2022 highlighted the effectiveness of machine learning models such as Naïve Bayes, Support Vector Machine (SVM), and Random Forest in sentiment classification tasks, with reported accuracies of 92.7%, 94.2%, and 93.7%, respectively. This study builds on these findings by applying these models to analyze user reviews of the Threads application.
This research paper focuses on sentiment analysis of user reviews on Threads, aiming to analyze accuracy of sentiment analysis classification models based on comments retrieved from the Google Play Store. The significance of this analysis becomes apparent in the context of Threads' continuous adaptation to ever-changing user expectations, technological advancements, and competitive dynamics in the social media platform industry [7]. By evaluating these models' performance, this research aims to fill a critical gap in understanding which algorithm best captures user sentiment nuances in Indonesian digital contexts. The chosen models are widely recognized for their efficiency and accuracy in sentiment analysis, making them ideal candidates for this study.
The classification models used in this study will be based on research by Madyatmadja et al [8], which had analyzed the accuracy of three classification models: Naïve Bayes (92.7%), Random Forest (93.7%), and Support Vector Machine (94.2%). In the following sections, this paper will define key terminology related to sentiment analysis, outline the classification models used, and discuss the methodology applied to analyze user sentiments on Threads. Figures and data generated for this research will be presented and analyzed to provide a comprehensive understanding of the sentiments expressed by Threads users. The conclusion will summarize the findings, and future research directions and implications will be presented, contributing to the ongoing conversation about social media sentiment analysis.
1.2 Problem identification
The primary problems will be addressed in this research. Firstly, this study aims to understand the majority opinions of Threads users. This became important knowing that Threads are the newcomer to the text based social media application, although they have quite a few users now, maintaining them is a different matter. In addition, the dynamics of social media are always changing. During the sentiment analysis process the data will be gathered through web scrapping using google play scrapper library with over 2,583 data [9]. Through a few processes, the algorithm will be able to determine whether Threads receives more positive or negative feedback.
Secondly, this research aims to compare three classification models, namely Random Forest, Naïve Bayes, and Support Vector Machine to determine which one achieves the highest accuracy in sentiment analysis on user review Threads. By using Sastrawi library this research will be bringing the output for analysis using Indonesia language [10].
1.3 Purpose of the research
This research will generate high-scale data that will be interesting and important to investigate. Moreover, the Indonesia is one of the most social media-intensive countries with 167 million users [11]. Other than that, this research will also help to understand users’ opinions while using the application. It is also important to forecast and analyze the future outcome of trends in applications, and one of the ways to achieve this goal is through sentiment analysis. Furthermore, this paper adds a contribution to the gap in the research that investigates Threads reviews while perusing the Naïve Bayes classification.
1.4 Research questions
The following are some of the research questions in this study: Can the Naïve Bayes Classifier algorithm, Support Vector Machine and Random Forest be used to classify sentiment from text-based dataset? Which is the better algorithm between Naïve Bayes Classifier, Support Vector Machine, and Random Forest for sentiment analysis?
1.5 Research benefits
This research offers several benefits, which are discussed in this paper. It provides a detailed understanding of how Indonesian users perceive the Threads application and its features. By analysing user review from Indonesian users about their opinions on Threads application, this study will generate valuable insights that can be applied in various contexts, including market forecasting and trend analysis [12]. Additionally, this research evaluates the performance of the Threads application in the Indonesian market, providing crucial insights into its reception and global popularity.
1.6 Problem scope
The scope of this analysis remains only within the users’ reviews provided by Indonesia users for Thread application that is collected on the Google Play Store. The method used for pre-processing data is web scrapping using Python as a programming language. The sample data consists of reviews from the past five months, reflecting the early stage of the application and its low review volume. Additionally, limitations on scraping reviews from Google Play have posed a challenge for comprehensive analysis. This focused approach aims to provide pertinent insights, as data older than a year may lack relevance to the current version of the application.
Various scholarly investigations have been conducted to explore sentiment analysis within social media contexts, predominantly employing methodologies such as Naïve Bayes and Support Vector Machines (SVM). These studies commonly report a prevalence of positive sentiment compared to negative sentiment. For instance, Majid et al. conducted a study focusing on sentiment analysis within the Threads platform, utilizing a Natural Language Processing (NLP) approach. While they did not specify the classification model used, they achieved an average accuracy of 76.92% based on analysis of 1,000 reviews, with precision and recall rates of 80% and 74%, respectively [13].
Similarly, Siswanto et al. employed a lexicon-based theoretical framework to analyse 1,313 data reviews, achieving an accuracy of 85% using Naïve Bayes analysis, along with precision and recall rates of 91% [14]. In another study by Silitonga et al., both Naïve Bayes and SVM algorithms were employed across various sample sizes. Notably, the final test on 1,925 reviews yielded 89.35% accuracy for Naïve Bayes and 94.08% for SVM [15].
Aji et al. concentrated on Indonesian reviews from Google Play related to Threads, reporting accuracies of 83.3% for Naïve Bayes and 73.4% for SVM [16]. Additionally, other researchers have investigated alternative models such as Random Forest, often combined with techniques like Word2Vec for data representation. These studies reported varying levels of accuracy, with one study achieving an overall accuracy of 78.33%. Notably, Random Forest models applied to YouTube comments exhibited accuracies between 88-90%.
Moreover, some research has pointed to a higher occurrence of negative sentiment in particular contexts. For example, Malik and Sibaroni observed that sentiment analysis of reviews aimed at business contexts frequently skews towards negativity [17]. Similarly, Chen et al. Zhang emphasized concerns from users in rural areas regarding the negative impact of excessive application use on local infrastructure, which often goes unaddressed [18].
In addition, Cheng and Li [19] speculated that negative sentiments might drive higher levels of engagement and, consequently, could be more financially beneficial. However, this hypothesis has not been thoroughly explored in existing research and merits further study in the future.
In the process of sentiment analysis to determine whether negative or positive reviews are posted by users. As shown in Figure 1, his requires several steps which will be explained in the following section.
Figure 1. Research methodology
3.1 Collecting dataset
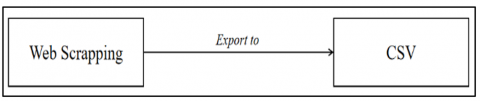
In Figure 2, the data collection method employed for this research involved web scraping using the Google Play Scraper library in Python [9]. Following a successful extraction procedure, 2,583 entries of data were gathered and saved in CSV format.
Figure 2. Collecting dataset
3.2 Text preprocessing
Text preprocessing is the initial stage in the data preparation process, aimed at organizing textual data to enhance ease and efficiency during subsequent processing [20]. This phase utilizing python language with Visual Studio Code and Jupyter Notebook IDE. Based on Figure 3 there were seven stages carried out in text preprocessing, namely:
A. Review Selection
The results of web scrapping will then be manually selected to filter out unwanted variables, such as emojis and referral codes, etc. Specifically, the data for analysis spans the past five months, starting from 20 March 2024 to 20 September 2023.
B. Manual Labeling
The chosen ratings will be manually converted into positive and negative categories. Ratings 1, 2, and 3 will be classified as negative, while ratings 4 and 5 will be categorized as positive [21].
C. Normalization
This normalization process utilizes Google Translate auto-correction, which has been trained for over 18 years with abundance data from Google Inc. The review is converted into English words, then reverted to the original languages. This method can remove common slang words that is commonly used in Indonesians’ typing, so that the features extraction process can have a consistent result.
D. Tokenization
This process is done by splitting the reviews sentence into individual words. This process allows the program to analyze the review by observing the words that occur in the review [22].
E. Case Folding
In this stage, the Python NLTK library is utilized to convert all words to lowercase, ensuring that the program recognizes words consistently regardless of their original casing.
F. Stemming
Stemming is particularly important for Bahasa, as the language uses unique prefixes and suffixes for words, such as me–, meng–, ke–, –in, and –kan. This process eliminates the different forms that a singular word may have, reducing unnecessary variations and enhancing the accuracy of feature extraction [23].
G. Stopword Removal
In this stopword removal process, the goal is to fully eliminate stopwords from the document. Oftentimes, users type stopwords in a slang or abbreviated form. For instance, a user might type "dri" instead of "dari". These terms need to be autocorrected to their proper form, such as changing "dri" to "dari," before they can be identified and removed as stopwords.
Figure 3. Text preprocessing
3.3 Features extraction
This research primarily uses TF-IDF approach for converting text data into numerical vectors, based on their frequency of occurrence in a document and across the entire dataset [24]. TF-IDF approach used on the research considers both unigram and bigram using n-grams, which creates a single or pair of successive words as features to maintain word sequence within the text for understanding its wider context [25]. These techniques allow text to be converted into numerical formats suitable for various analyses or machine learning models before classification, with an aim to improve analysis overall accuracy.
3.4 Sentiment analysis classification
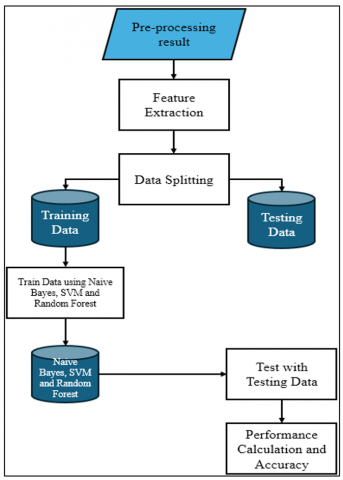
The illustration of performing sentiment analysis is presented in Figure 4. During the classification phase, a dataset consisting of 2,583 entries is divided into Training Data and Testing Data using an 80:20 ratio [26]. This 80:20 split is a widely accepted practice in machine learning, providing a robust framework for model evaluation. The 80% allocated for training ensures that the model has enough data to learn from and generalize patterns effectively, while the remaining 20% serves as an independent test set to validate the model's performance and ensure it generalizes well to unseen data. This study utilizes Naïve Bayes, Support Vector Machine, and Random Forest as the sentiment analysis classification techniques to categorize the data into distinct predefined groups for further analysis [27].
Figure 4. Sentiment analysis classification
3.5 Evaluation and comparison
The study utilizes the Confusion Matrix method to comprehensively evaluate the performance of each classification technique by accurately measuring their ability to correctly identify instances belonging to different categories [28]. These categories are identified as True Positive (TP), True Negative (TN), False Positive (FP), and False Negative (FN). Furthermore, other important performance measures such as Precision, Recall, F1 score, and overall accuracy are examined to establish a scientifically informed comprehension of the effectiveness of each classification approach [29]. The following equation represents the measurement for each instrument utilized in this study.
$Precision =\frac{T P}{T P+F P}$
$Recall =\frac{T P}{T P+F N}$
$F1 \ Score =2 \times \frac{(Precision \times Recall)}{(Precision + Recall )}$
The result of this calculation will prove the focus of each technique, in which specializes on the most important factor – relevant to the needs of analysis.
3.6 Visualization
When conducting the comparison using sentiment analysis, matplotlib, a Python library, is used to display the results in a clustered bar chart. Additionally, visualizations like word clouds and histograms are utilized to depict the top ten words linked with both positive and negative labels. The frequency of occurrence for keywords is also indicated on the words.
This paper analyzes 2,583 user reviews obtained through the Google Play Scraper Python library, covering the period from July 2023 to March 2024. After text preprocessing cleans up the raw data, the feature extraction phase will follow. In this stage, the data is divided into 80% training data and 20% testing data, resulting in 2,066 training instances and 517 testing instances, as shown in Table 1. The amount of positive and negative data in testing instances is 258 and 259 respectively.
Table 1. Numbers of data split for each label
|
Label |
Data Numbers |
|
Training |
2,066 |
|
Testing |
517 |
|
Total |
2,583 |
For classification models, techniques such as Naïve Bayes, SVM, and Random Forest will be used to assess the accuracy of the model on the dataset. This evaluation is performed using Scikit-learn, a Python library specialized in machine learning and accuracy evaluation. Below are the results of the classification models:
4.1 Comparison between modules
4.1.1 Naïve bayes
The classification result on Naïve Bayes using confusion metrics technique shows data consisted of 220 TP, 38 FP, 200 TN, and 59 FN, as indicated in Table 2. Using equations on 3.4 as the calculation method on the classification report, showing metrics such as 81% on precision recall, 81% on f1-score, 81% support score and the average accuracy is 81%. The calculation of the metrics result can be seen in Table 2.
Table 2. Classification report of Naïve Bayes Model
|
Category |
Precision |
Recall |
F1-Score |
|
Negative |
0.84 |
0.77 |
0.80 |
|
Positive |
0.79 |
0.85 |
0.82 |
|
Accuracy |
|
|
0.81 |
4.1.2 Support machine vector
Machine classification model using Support Vector Machine (SVM), needs to create Support Vector Classifier (SVC) with a linear kernel from the Python scikit-learn module [30]. Once the classifier was created, prediction was performed on Testing data. The result of the SVM Technique using the confusion matrix produces 218 TP, 40 FP, 195 TN, and 64 FN. The SVM model demonstrated inferior performance compared to the Naïve Bayes model, with the SVM achieving an average accuracy of 80%. The calculation of the metrics result can be seen in Table 3.
Table 3. Classification report of SVM model
|
Category |
Precision |
Recall |
F1-Score |
|
Negative |
0.83 |
0.75 |
0.79 |
|
Positive |
0.77 |
0.84 |
0.81 |
|
Accuracy |
|
|
0.80 |
4.1.3 Random forest
The Random Forest (RF) classification technique builds decision trees using randomly selected data samples. In RF classification, each tree in the forest contributes to the final classification decision by voting on the class. The evaluation of the Random Forest method, as shown by the confusion matrix, produced the following results: 202 true positives (TP), 56 false positives (FP), 190 true negatives (TN), and 69 false negatives (FN). In this study, Random Forest achieved an accuracy of 76%. The calculation of the evaluation results can be found in Table 4.
Table 4. Classification report of random forest model
|
Category |
Precision |
Recall |
F1-Score |
|
Negative |
0.77 |
0.73 |
0.75 |
|
Positive |
0.75 |
0.78 |
0.76 |
|
Accuracy |
|
|
0.76 |
4.2 Sentiment analysis classification comparison
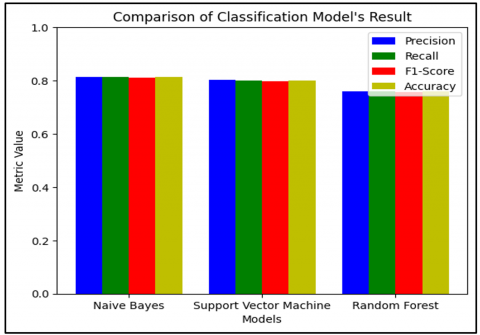
After evaluating the performance scores of each classification model based on precision, recall, F1-score, and accuracy, it was observed that the Naïve Bayes model achieved the highest performance scores. The SVM model followed, while the Random Forest model had the lowest scores. Notably, the differences in performance scores among the three models were not significant. To visually compare the performance of these models, a clustered bar chart was created using Matplotlib. Figure 5 illustrates this comparison, showing that the bar representing the Naïve Bayes model is slightly higher than those representing the other models, indicating its superior performance.
Figure 5. Classification model performance comparison
4.3 Sentiment analysis result
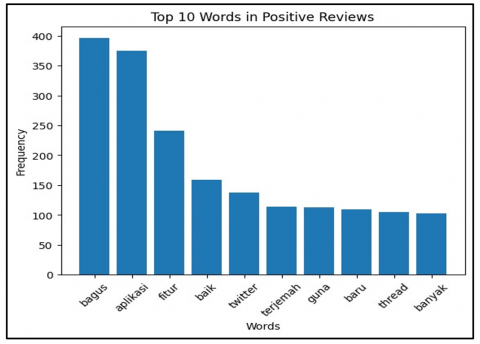
By analysing and visualizing the Threads user review dataset sourced from Google Play Store reviews, this study identifies the key topics discussed by users regarding their positive or negative sentiments about using Threads. After cleaning the dataset to retain only relevant words for analysis and visualization, a bar chart created using Matplotlib illustrates the frequency of each word. The chart highlights the top ten words most used in either positive or negative reviews.
Figure 6 shows the ten most frequently mentioned words in positive reviews. These words are 'bagus', 'aplikasi', 'fitur', 'baik', 'twitter', 'terjemah', 'guna', 'baru', 'thread', and 'banyak'. 'bagus', appears most frequently, with over 396 occurrences, indicating that many users provided positive feedback by complimenting the application. We can also see that Threads has a lot of features to be offered, with the most prominent one is the translation feature.
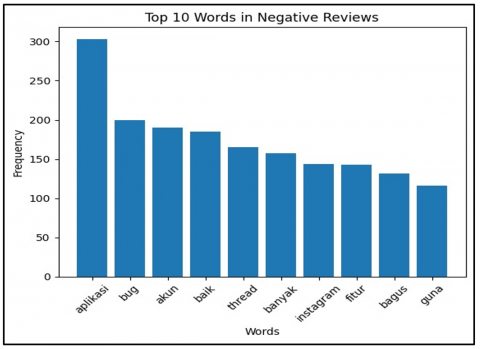
In contrast, Figure 7 presents the ten most frequently used words in negative reviews. These include 'aplikasi', 'bug', 'akun', 'baik', 'thread', 'banyak', 'instagram', 'fitur', 'bagus', and 'guna'. The word 'aplikasi' is often mentioned in negative reviews, suggesting that users tend to mention the application directly when expressing complaints.
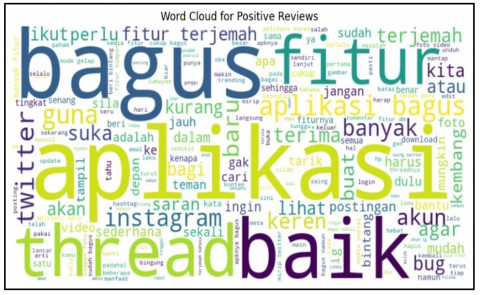
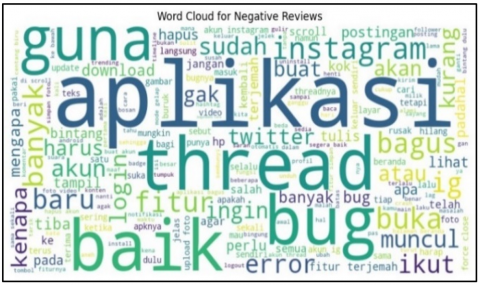
The positive and negative sentiment words from Threads user reviews are also visualized in word clouds in Figure 8 and 9. Words with higher frequencies are displayed in larger fonts, providing an additional layer of visualization. Figure 8 depicts the word cloud for positive sentiments, while Figure 9 illustrates the word cloud for negative sentiments, showcasing words not displayed in the bar charts.
Figure 6. Top 10 words in positive reviews graph
Figure 7. Top 10 words in negative reviews graph
Figure 8. Word cloud for positive reviews
Figure 9. Word cloud for negative reviews
Threads is a popular social media platform developed by the Instagram team, enabling users to share their thoughts and discuss various topics through text messages. In Indonesia, Threads has amassed a significant user base. This paper conducted a sentiment analysis of user reviews on Threads, focusing on Indonesian users. By collecting user review data from the Google Play Store, the research analysed the data using Naïve Bayes, SVM, and Random Forest classification models.
From this research, all three algorithm is capable of classifying sentiment from text-based dataset. With a sample size of 2,583 user-generated reviews, all models are able to get more than 70% accuracy, making them as a reliable source of classifying sentiment. Naïve Bayes model achieved the highest accuracy at 81%, followed by the SVM model at 80%, and the Random Forest model at 76%. We can conclude that the best algorithm for this methodology of sentiment analysis is Naïve Bayes. It is recommended to focus on sentiment analysis for Threads, especially considering its rising popularity, using the Naïve Bayes model due to its demonstrated high accuracy.
The accuracy of each model can be improved in the future research by utilizing a more advanced preprocessing methodology, using product or model that is specialized or more suitable with Bahasa language. Another way that may improve the accuracy of each model is by dedicating a lot more data samples for the training and testing process, as the current way of collecting data samples using google play scrapper collides with the new policy of Google Play Store, making it unsuitable for more in-depth research.
[1] Instagram. (2023). Introducing threads: A new way to share with text. https://about.instagram.com/blog/announcements/threads-instagram-text-feature.
[2] Statista. (2024). Number of threads app downloads worldwide from July 2023 to March 2024. https://www.statista.com/statistics/1434323/threads-app-downloads-worldwide/#:~:text=In%20July%202023%2C%20Meta%20Platforms,finally%20launched%20in%20the%20EU.
[3] Jay, G. (2023). Threads (By Instagram) usage statistics for 2024. https://famewall.io/statistics/threads-stats/.
[4] Drapkin, A. (2023). As advertisers flee X, threads quietly makes a comeback. https://tech.co/news/x-threads-makes-comeback#:~:text=Threads%20Makes%20a%20Comeback&text=Although%20this%20is%20down%20on,has%20just%20under%20100%20million.
[5] Vanian, J. (2023). Meta’s threads struggles to grow amid rivalry with Elon Musk’s X, ranking ahead of only Tumblr. https://www.cnbc.com/2023/09/26/metas-twitter-like-threads-tries-to-grow-amid-rivalry-with-elon-musks-x.html#:~:text=When%20Threads%20debuted%2C%20it%20rapidly%20gained%20millions,is%20losing%20users%20amid%20Elon%20Musk's%20ownership.
[6] Khalid, M., Asif, M., Shehzaib, U. (2015). Towards improving the quality of mobile app reviews. International Journal of Information Technology and Computer Science, 7(10): 35. http://doi.org/10.5815/ijitcs.2015.10.05
[7] Rupasingha, R.A.H.M. (2024). Sentiment analysis on google play store app users’ reviews based on deep learning approach. https://www.researchgate.net/publication/379954915_Sentiment_analysis_on_google_play_store_app_users'_reviews_based_on_deep_learning_approach.
[8] Madyatmadja, E.D., Shinta, Susanti, D., Anggreani, F., Sembiring, D.J.M. (2022). Sentiment analysis on user reviews of mutual fund applications. Journal of Computer Science, 18(10): 885-895.
[9] Oxylabs. (n.d.). How to scrape Google Play data. https://oxylabs.io/products/scraper-api/serp/google/play
[10] Yusliani, N., Primartha, R. (2019). Multiprocessing stemming: A case study of Indonesian stemming. International Journal of Computer Applications, 182(40): 15-19.
[11] Statista. (2024). Social media in Indonesia - statistics & facts. http://www.statista.com/topics/8306/social-media-in-indonesia/.
[12] Saskia, C., Pertiwi, W.K. (2024). Pengguna Threads Kini Tembus 130 Juta, Sempat Ditinggal dan Merosot. https://tekno.kompas.com/read/2024/02/13/09000077/pengguna-threads-kini-tembus-130-juta-sempat-ditinggal-dan-merosot?page=all#google_vignette.
[13] Majid, A., Nugraha, D., Adhinata, F.D. (2023). Sentiment analysis on Tiktok application reviews using natural language processing approach. Journal of Embedded Systems, Security and Intelligent Systems, 04(1): 32-38. http://doi.org/10.26858/jessi.v4i1.41897
[14] Siswanto, S., Mar’ah, Z., Sabir, A., Hidayat, T., Adhel, F., Amni, W. (2022). The sentiment analysis using Naïve Bayes with lexicon-based feature on TikTok application. Jurnal Varian, 6(1): 89-96. https://doi.org/10.30812/varian.v6i1.2205
[15] Silitonga, P.D.P., Hasibuan, M., Situmorang, Z., Purba, D. (2023). Comparison of TikTok user sentiment analysis accuracy with Naïve Bayes and support vector machine. International Journal of Advanced Trends in Computer Science and Engineering, 12(1): 11-15. https://doi.org/10.30534/ijatcse/2023/031212023
[16] Aji, S., Sundari, J., Yunita, Y., Imron, I., Pratama, O. (2023). The algorithm comparison of support vector machine and Naive Bayes in sentiment analyzing the Tiktok application. In AIP Conference Proceedings, 2714(1): 020015. https://doi.org/10.1063/5.0129009
[17] Malik, R.A.A., Sibaroni, Y. (2022). Multi-aspect Sentiment analysis of Tiktok application usage using FasText feature expansion and CNN method. Journal of Computer System and Informatics, 3(4): 277-285. https://doi.org/10.47065/josyc.v3i4.2033
[18] Chen, H., Wang, M., Zhang, Z. (2022). Research on rural landscape preference based on TikTok short video content and user comments. International Journal of Environmental Research and Public Health, 19: 1-13. https://doi.org/10.3390/ijerph191610115
[19] Cheng, Z., Li, Y. (2023). Like, comment, and share on TikTok: Exploring the effect of sentiment and second-person view on the user engagement with TikTok news videos. Social Science Computer Review, 42(1): 201-223. https://doi.org/10.1177/08944393231178603
[20] Kadhim, A. (2018). An evaluation of preprocessing techniques for text classification. https://www.researchgate.net/publication/329339664_An_Evaluation_of_Preprocessing_Techniques_for_Text_Classification.
[21] Briciu, A., Călin, A., Miholca, D., Moroz-Dubenco, C., Petrașcu, V., Dascălu, G. (2024). Machine-learning-based approaches for multi-level sentiment analysis of Romanian reviews. Mathematics, 12(3): 456. https://www.mdpi.com/2227-7390/12/3/456
[22] Lubis, A.R., Nasution, M.K.M. (2023). Twitter data analysis and text normalization in collecting standard word. Journal of Applied Engineering and Technological Science, 4(2): 855-863.
[23] Liu, C., Sheng, Y., Wei, Z., Yang, Y. (2018). Research of text classification based on improved TF-IDF Algorithm. https://www.researchgate.net/publication/328371180_Research_of_Text_Classification_Based_on_Improved_TF-IDF_Algorithm.
[24] Giwa, O., Davel, M. (2013). N-gram based language identification of individual words. https://www.researchgate.net/publication/282875645_N-gram_based_Language_Identification_of_Individual_Words.
[25] Gurung, R. (2018). Application of machine learning methods for the design of crystallisation processes. Strathclyde Institute of Pharmacy and Biomedical Sciences. https://stax.strath.ac.uk/downloads/37720d045.
[26] Guia, M., Silva, R., Bernardino, J. (2019). Comparison of Naïve Bayes, support vector machine, decision trees and random forest on sentiment analysis. https://www.researchgate.net/publication/336225950_Comparison_of_Naïve_Bayes_Support_Vector_Machine_Decision_Trees_and_Random_Forest_onSentiment_Analysis.
[27] Ruuska, S., Hämäläinen, W., Kajava, S., Mughal, M. (2018). Evaluation of the confusion matrix method in the validation of an automated system for measuring feeding behaviour of cattle. https://www.researchgate.net/publication/322351693_Evaluation_of_the_confusion_matrix_method_in_the_validation_of_an_automated_system_for_measuring_feeding_behaviour_of_cattle.
[28] Powers, D.M.W. (2011). Evaluation: From precision, recall and F-measure to ROC, informedness, markedness & correlation. https://www.researchgate.net/publication/276412348_Evaluation_From_precision_recall_and_F-measure_to_ROC_informedness_markedness_correlation.
[29] Scikit. (n.d.). Supervised Learning, Support Vector Machines. https://scikit-learn.org/stable/modules/svm.html.
[30] Rodriguez-Galiano, V. F., Ghimire, B., Rogan, B., Chica, M. (2012). An assessment of the effectiveness of a random forest classifier for land-cover classification. https://www.researchgate.net/publication/232608547_An_assessment_of_the_effectiveness_of_a_random_forest_classifier_for_land-cover_classification.