Wibawa Endra Juwana![]() | Noval Fattah Alfaiz
| Noval Fattah Alfaiz![]() | Singgih Dwi Prasetyo
| Singgih Dwi Prasetyo![]() | Rendy Adhi Rachmanto
| Rendy Adhi Rachmanto![]() | Watuhumalang Bhre Bangun
| Watuhumalang Bhre Bangun![]() | Zainal Arifin*
| Zainal Arifin*![]()
© 2024 The authors. This article is published by IIETA and is licensed under the CC BY 4.0 license (http://creativecommons.org/licenses/by/4.0/).
OPEN ACCESS
This research aims to optimize a system for producing renewable energy using wind and solar power. On the island of Java, some rail stations will have Electric Vehicle Charging Stations with this technology as the primary energy source. The hybrid electric power network for electric vehicle charging is being utilized to address the demand for a more environmentally friendly and sustainable transformation of land transportation in Indonesia. Feasibility or techno-economic analysis is used to look into the possibilities of solar and wind energy while considering investment expenses and monitoring the quantity of power produced. The resources are analyzed using the Hybrid Optimization Model for Electric Renewable (HOMER) program, which considers the suggested hybrid power system's economic viability. Many analyses include those of Net Present Cost (NPC), Cost of Energy (CoE), Energy Expenditure Ratio, Energy Output, Use, and Excess Energy that each of the system's constituent parts produces. After installing this hybrid system, which optimizes monthly output and has minimal maintenance costs with a prospective investment, somewhat satisfying results were reached. This hybrid system may lower the value of electrical energy generated from renewable sources to IDR 2,109.88/kWh.
HOMER-Grid, PV-wind turbine hybrid system, EV-charging, train station
Electrical energy is a basic need in today's society. The use of electrical energy in urban and rural areas has increased rapidly [1]. This phenomenon results from the growing population and need for electrical energy, making its availability crucial for everybody. However, using fossil fuels to generate electricity has drawn criticism due to the production of greenhouse gases, particularly carbon dioxide, which is a significant contributor to global warming. As a result, some nations have experienced drastic shifts in their climate. Therefore, switching to renewable energy from fossil fuels is vital to generate power and slow global warming [2]. Many developed countries have used renewable energy, which developing countries can follow. However, renewable energy is uncertain, often leading to system designs that are too large, resulting in higher costs [3]. A hybrid renewable energy system (HRES), which combines multiple renewable energy sources with batteries or generators for storage, can be put into place to prepare for this. In addition to saving money, this technology may deliver power to remote locations with spotty or nonexistent access to it [4]. The hybrid systems applied usually rely on the potential of each different region, thus having their unique characteristics [5].
Solar and wind energy are increasingly gaining popularity due to their enhanced economic viability, which positions them as competitive alternatives to traditional power generation methods [6]. Both are abundant natural energy sources and do not produce CO2 emissions, so they do not hurt the environment. Indonesia is located in the equatorial region, so it can utilize solar energy optimally because it gets sunlight every year [7]. This country is also famous for its islands with two seasons. The changing seasons in Indonesia are influenced by changes in the wind, giving this country the potential to utilize wind energy [8]. With solar energy predominating during the dry season and wind energy predominating more during the rainy season, solar and wind power promise to complement energy sources [9]. In some parts of Indonesia, hybrid energy is more efficient than solar energy alone. In Indonesia, the potential daily consumption of solar radiation is around 4.8 kWh/m2 [10-12]. Aside from that, Indonesia may also employ wind energy as an alternate energy source. The typical wind speed in Indonesia is between 2 to 7 m/s. Therefore, small and medium-sized wind power facilities can be used in Indonesia [13].
The potential for utilizing renewable energy in Indonesia is enormous, so it needs to be maximized in every sector. One of its uses is in the transportation sector, especially land transportation [14]. Nearly all of the transportation systems used in Indonesia still use conventional fuel, so transformation needs to be carried out in stages. The transformation of fossil fuel vehicles into electric vehicles in Indonesia is a crucial step in efforts to overcome the environmental, economic, and social challenges faced in Indonesia [15-17]. As an archipelagic country with a large population and rapid economic growth, Indonesia faces significant pressures related to air pollution, dependence on imported fossil fuels, and global warming. By adopting electric vehicles, Indonesia can reduce greenhouse gas emissions and air pollution from the transportation sector, significantly contributing to pollution in many large cities [18]. Additionally, efforts to utilize EVs in land transportation need government support to achieve pollution-free roads and a healthy environment [19]. With the government's firm commitment, private sector support, and active community participation, transforming fossil vehicles to electric will be an important milestone in realizing sustainable mobility and strengthening Indonesia's energy sovereignty [20].
The most massive land transportation used in Indonesia is private vehicles in the form of cars and motorbikes. Apart from that, there is also public transportation in the form of buses and trains [21]. Based on these problems, this study will analyze investment and opportunities for utilizing hybrid PV-Wind technology to charge electric vehicles at train stations. The efficiency of grid-connected PV systems is assessed using sophisticated optimization algorithms HOMER and numerical techniques, which makes it easier to assess project cost-effectiveness, including NPC and LCOE [22-25]. The viability of a grid-connected solar system for EV charging station power consumption will be covered in this study. Essential aspects of sustainable investment, including load needs, possibilities for renewable energy, and system composition, are highlighted in the debate. Utilization costs and the investment payback period are combined in technical-economic research to determine the payback period. A thorough technical-economic study was conducted to guarantee the most economical design, evaluating variables like total power generation, energy consumption, NPC, IIR, ROI, and simple payback.
2.1 Regional selection
The plan is for Public Electric Vehicle Charging Stations to use renewable energy, which will be placed at several train stations on the island of Java. Modeling was carried out at the train station because it is the island's leading mobility center for land transportation. The selected train stations include Tawang Station in the City of Semarang (Central Java Province), Kota Baru Station in the City of Malang (East Java Province), and Tanah Abang Station in Central Jakarta (DKI Jakarta Province). These three locations have distinct geographical and demographic characteristics: Tanah Abang Station is a metropolitan area with a high population density, and Tawang Station is in the lowlands near the harbor area. In contrast, Kota Baru Station is an administrative region with highland topography. These stations represent various regional conditions in different parts of Java Island, reflecting the island's diversity of ecosystems, administrative divisions, and transportation infrastructure.
The Global Energy Resources Prediction (POWER) tool from the National Aeronautics and Space Administration (NASA) was combined with HOMER software to identify potential locations for Public Electric Vehicle Charging Stations. This HOMER function allows for identifying and selecting ideal project locations based on geographic and environmental parameters. Table 1 details the geographic circumstances of the sites chosen to install this hybrid system.
Table 1. Geographic conditions of the station location
|
Area |
Coordinate |
Average Annual Wind Speed (m/s) |
Average Annual Temperature (℃) |
|
Tawang Station |
6°57, 8'S, 110°25, 8'E |
3.38 |
26.80 |
|
Kota Baru Station |
7°58, 7'S, 112°38, 3'E |
3.86 |
25.71 |
|
Tanah Abang Station |
6°11, 1'S, 106°11, 7'E |
3.52 |
25.93 |
2.2 Model description
The suggested system's Lowest Cost of Energy (LCOE) value may be found by running simulations with the HOMER-Grid program to assess the PV-Wind hybrid power plant's potential. Numerous characteristics are considered in this process, such as solar and wind energy availability, load profile, technical and economic aspects, and location-related considerations [26]. The HOMER simulation process's framework is shown in Figure 1.
Figure 1. The simulation framework HOMER [27]
This simulation aims to identify regions needing further technical and financial evaluation. The study focuses on three selected sites in Java. As depicted in Figure 2, the load profiles used in this analysis are tailored for office-scale energy consumption. These profiles are based on default parameters provided by the HOMER software, which serves as a widely recognized tool for energy modelling and optimization. The study does not designate a specific peak demand month, allowing for a more generalized analysis of energy use patterns across the selected sites. This approach ensures a comprehensive evaluation of potential opportunities.
Next, as indicated in Table 2, components appropriate for the hybrid system and information on cost, replacement, service life, and after-sale maintenance are chosen. The primary goal of this research is to evaluate the advantages of an EV-charging hybrid wind-solar system, such as the one shown in Figure 3. Wind turbines and solar panels serve as electrical energy sources to meet power requirements. This system is linked to the On-Grid General Energy System in the event of an excess or deficiency of energy supply. To utilize AC/DC inverters for household appliances, DC voltage must first be converted to AC. The HOMER program models the complete system and assesses related expenses. These kinds of off-grid systems rely on modest energy systems, such as solar panels, wind turbines, and other energy storage devices; therefore, evaluating prices has to be done differently. Life Cycling Cycle (LCC) analysis is considered a suitable technique for assessing the expenses of these systems [28].
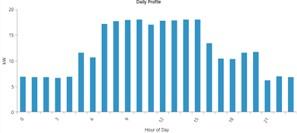
Figure 2. Electrical load in charging station
HOMER software automatically verifies the amount of power used for modest office requirements at train stops. This electrical load profile estimates the authorized consumption for office spaces in the HOMER Grid. It is assumed that the daily power usage of all the cities on the Java island under study is the same or around 231.45 kWh. About 21.89 kW is the most significant amount of power that is utilized. Monthly computations of electricity use are performed, as Figure 3 illustrates. Several components are needed for the wind turbine-solar panel hybrid system to function correctly, impacting the cost analysis. Table 2 enumerates the types and specifications of components required for this system.
Figure 3. PV-Turbine hybrid system con figuration scheme
Table 2. System components projection
|
Parameter |
PV |
Wind Turbines |
Inverters |
|
Name |
SG370-M |
Bergey Excel 6-R |
Dyn-500 |
|
Rate Capacity |
12 kW |
6 kW |
6 kW |
|
Capital (IDR) |
IDR 30,250,000.00 |
IDR 38,500,000.00 |
IDR 5,100,000.00/kW |
|
Replacements (IDR) |
IDR 30,250,000.00 |
IDR 38,500,000.00 |
IDR 7,200,000.00/kW |
|
O&M (IDR/year) |
IDR 1,500,000.00/year |
IDR 3,550,00.00/year |
IDR 550,000.00/year |
|
Lifetime |
25 years |
20 years |
10 years |
2.3 Component specification
Solar panel modules function by directly converting sunlight into electrical energy through the semiconductor material's photovoltaic effect [29]. In this instance, the Peimar SG370-M solar panels are utilized in the PLTS system. Table 3 provides a detailed breakdown of this solar cell's specs.
Table 3. Solar panel specifications
|
Specifications |
Value |
|
Maximum Power (Pmax) |
370 Wp |
|
Maximum Voltage (Vmax) |
40.1 V |
|
Maximum Current (Imax) |
9.23 A |
|
Open Circuit Voltage (Imp) |
48.93 A |
|
Short Circuit Current (Isc) |
9.81 A |
|
Module Efficiency |
19.07% |
|
Derating Factor |
80% |
When designing the overall capacity needed for solar panels to power electric vehicle (EV) charging stations, it is essential to take into account system losses, the total energy generated by the PV module, and the PV module's capacity, which is determined by the module's nominal power of 370 Wp as per specifications. Table 4 displays specifics on the system's losses.
Table 4. System failures
|
Types of Loss |
Percentage |
|
PV Modules |
11.5% |
|
Network Inverters |
3% |
|
Battery Inverters |
6% |
|
Wiring |
2% |
|
Batteries |
15% |
|
Total Loss at Night |
37.5% |
|
Total Loss per Day |
22.5% |
A wind turbine is an apparatus that uses mechanical turbine action to convert wind energy into electrical energy [30]. We used a 6 kW XLR 6-type wind turbine for this project. To start this project, we estimate capital costs of around IDR 38,500,000.00. In addition, an additional fee of the same amount is required to replace the wind turbine if necessary. We also project annual operation and maintenance costs of IDR 3550,000.00. This wind turbine is projected to be operational for 20 years. Detailed wind turbine specifications in the system can be seen in Table 5.
Table 5. Specifications for wind turbines
|
Specifications |
Value |
|
Output Power |
5.5 kW |
|
Maximum Voltage (Vmax) |
230 V |
|
Furling Wind Speed |
14-20m/s |
|
Cut-in Wind Speed |
2.5m/s |
|
Number of Blades |
3 |
|
Rotor Speed (RPM) |
0-400 RPM |
An inverter is a helpful tool for converting solar panels' direct electric current (DC) into alternating electric current (AC), which is usable by most domestic appliances [31]. The magnitude of the load connected to the inverter has no bearing on its output power. Still, the electricity is about the same as what the solar panels were producing at the time. The system needs a total of 21.89 kW of electrical loads. An inverter of the Dynapower IPS-500 type is used in this simulation. Table 6 displays the specs of this inverter.
Table 6. Inverter specifications
|
Specifications |
Value |
|
Output Power |
500 kW |
|
Maximum Power |
500 kW |
|
Output Frequency |
50/60 Hz |
|
Input DC Voltage |
100-1500 V |
|
Efficiency |
98.2% |
2.4 Environmental parameters
Numerous geographic and environmental factors are taken into account. Air temperature, wind speed, and solar radiation are determined using a database incorporating NASA's Global Energy Resources Prediction (POWER) into the HOMER program. In this regard, the research will center on several sites on Java Island. Environmental parameters like air temperature, wind speed, and solar radiation intensity may be found by modeling and analyzing NASA POWER data in HOMER. These statistics offer crucial planning information for constructing sustainable and effective regional power plants.
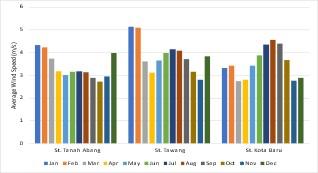
The average monthly temperature at several rail stops on Java Island is shown in Figure 4. With an average temperature of 25.71℃, Kota Baru station had the lowest average temperature, as seen in this image. The monthly average wind speed is seen in Figure 5. The most excellent average wind speed of 5.13 m/s was recorded in January at Tawang Station. Meanwhile, Figure 6 shows the monthly average solar radiation intensity. In St Tawang, particularly from August to October, the average solar radiation intensity is maximum, measuring 5.32 kWh/m2. This data dramatically aids the design of EV charging stations at various stations around the island of Java.
HOMER collects environmental data such as solar radiation intensity, wind speed, and temperature, which are crucial in simulating and optimizing renewable energy systems. Solar radiation intensity, or Global Horizontal Irradiance (GHI), is used to calculate the electricity generation potential from photovoltaic (PV) panels, considering daily and seasonal variations to determine the optimal size and configuration of the panels. Wind speed is used to simulate energy production from wind turbines by modeling the wind speed distribution to evaluate the feasibility and energy potential of the location. Environmental temperature affects the efficiency of PV panels and battery performance, as higher temperatures can decrease panel efficiency and accelerate battery degradation. HOMER uses this data to ensure that energy supply from renewable sources can meet energy demand throughout the year, optimize system configuration, and reduce costs and environmental impact, enabling more efficient energy system design.
Figure 4. Average ambient temperature for a month
Figure 5. Average wind speed in a month
Figure 6. Average intensity of solar radiation in a month
2.5 Economic analysis
The HOMER simulation findings include an economic evaluation comprising output power and cost analysis. The output power analysis captures the energy provided by wind turbines and solar panels [32]. The PV module's output power is determined using Eq. (1).
$P_{P V}=Y_{P V} \times f_{P V} \times\left(\frac{G_T}{G_{T, S T C}}\right) \times\left[1+\alpha_P\left(T_c-T_{c, S T C}\right)\right]$ (1)
where, $Y_{P V}$ denotes the PV module's nominal capacity, $f_{P V}$ is its reduction factor, $G_T$ represents the solar radiation it has received thus far, $G_{T, S T C}$ is its radiation received under standard test conditions, $\alpha_P$ is its temperature coefficient of power, $T_c$ represents its temperature as of right now, and $T_{c, S T C}$ is its temperature under standard test conditions [25]. To find a wind turbine's output power, use Eq. (2) below.
$P_{W T G}=P_{W T G, S T P} \times\left(\frac{\rho}{\rho_0}\right)$ (2)
where, $\rho$ is the actual air density and $\rho_0$ is the air density under standard circumstances, $P_{W T G, S T P}$ is the power generated by the wind turbine under standard conditions, and $P_{W T G}$ is the wind turbine generate power [33].
Cost analysis in HOMER is defined by two critical economic metrics commonly used for techno-economic analysis: the Net Present Cost (NPC) and the Levelized Cost of Energy (LCOE). Here’s how these are calculated and what assumptions are typically made:
NPC is a fundamental economic metric used in the HOMER software to evaluate the total cost of an energy system over its entire operational lifespan. NPC aggregates all costs—capital expenditures, operation and maintenance (O&M) expenses, fuel costs, component replacement costs, and other relevant financial outlays—into a single, present-day value. This allows for a comprehensive assessment of the economic burden of a system. In the HOMER simulation process, where the operating process searches for the system configuration with the lowest Net Present Cost (NPC), consideration of economic value is crucial. HOMER uses the following formula to determine NPC [34]:
$N P C(R p)=\frac{c_{\text {ann }, \text { tot }}}{C R F . i . \text { Rproj }}$ (3)
where,
Cann,tot : total annual costs ($/year)
CRF: capital recovery factor
i: interest rate
Rproj: age/use period (years)
LCOE is another critical metric used in HOMER to quantify the average cost of generating one unit of electricity over the system's operational lifespan. It provides a normalized comparison across different energy technologies, considering all costs incurred over the project's life. The following formula is used to determine COE [35]:
$C O E=\frac{c_{\text {ann }, \text { tot }}}{L_{\text {prim }, A C}+L_{\text {prim }, D C}}$ (4)
Lprim,AC and Lprim,DC are the AC and DC loads on the system. The lifetime of this technology is estimated to be 25 years, with an estimated decline in value, as shown in Figure 7.
A comprehensive understanding of Net Present Cost (NPC) and Levelized Cost of Energy (LCoE) is essential for performing rigorous techno-economic analysis, as these metrics offer an integrative assessment of energy systems' financial viability and cost-effectiveness. NPC and LCoE provide quantitative benchmarks that facilitate the comparative evaluation of diverse energy technologies and system configurations. Systems with lower NPC and LCoE values indicate higher economic efficiency, making these metrics critical for identifying optimal solutions. The capability of HOMER to simulate and analyze these metrics across a range of scenarios enhances the precision of hybrid energy system design, ensuring that both technical performance and economic outcomes are effectively harmonized with the project's strategic objectives.
Figure 7. Project assumptions
3.1 Results of the HOMER simulation
Finding the most effective system configuration is the simulation process's primary objective, and it is done using HOMER's optimization features. The procedure entails modeling and developing a particular system configuration and then using optimization tools to determine which configuration is optimal. This layout may satisfy electrical load requirements for electric vehicle (EV) charging stations. This system's benefit is its ability to generate more electrical energy than is needed for consumption, which presents a chance to profit financially from the sale of extra power. A comparison of the total energy generated by the three EV-charging stations is shown in Table 7.
Table 7. Total annual energy production
|
Stations |
PV-System |
Wind-Turbine |
Grid Purchases |
Total (kWh/year) |
|
Tanah Abang |
15,563 |
11,471 |
123,342 |
150,486 |
|
Tawang |
15,807 |
14,667 |
120,387 |
150,860 |
|
Kota Baru |
16,255 |
10,272 |
123,825 |
150,322 |
The most significant annual electrical energy production is produced at Tawang Station, which creates 150,860 kWh/year. There are several differences between the three stations regarding renewable energy production. St. Tawang can make the most significant amount of electricity from wind power, costing 14,667 kWh/year. At the same time, the largest solar energy source is produced at St. Kota Baru, with a value reaching 16,255 kWh/year. The fraction of renewable energy use has different proportions in each region, as shown in Table 8.
Table 8. Renewable energy fraction
|
Stations |
Renewable Fraction (%) |
|
Tanah Abang |
16.9 |
|
Tawang |
19.4 |
|
Kota Baru |
17.2 |
The environmental parameters of solar irradiance and wind speed strongly correlate with the renewable fraction observed at each site. Elevated levels of solar irradiance, characterized by increased sunlight intensity and prolonged duration, significantly enhance the performance of photovoltaic systems, thereby increasing the renewable fraction. Similarly, higher mean wind speeds and reduced turbulence intensity contribute to greater energy yields from wind turbines, further elevating the renewable fraction. Otherwise, in regions where these environmental conditions are suboptimal, the renewable fraction typically diminishes, necessitating the implementation of more advanced system designs. Such designs may include augmented energy storage capacities or hybrid system configurations to ensure a continuous and reliable energy supply. The observed variability in renewable fractions across different locations is a direct consequence of these environmental disparities, highlighting the critical importance of conducting site-specific assessments when designing and optimizing hybrid renewable energy systems.
The variation in the amount of renewable energy produced across different locations highlights the significant impact of environmental factors in designing a hybrid energy system. By comparing the renewable fractions at the three sites, we gain important insights into each location's solar and wind potential. Tawang Station has the highest solar and wind energy potential, making it the most promising candidate for further investment in renewable energy infrastructure. On the other hand, Tanah Abang Station, with its lower renewable fraction, may need more innovative solutions or the integration of alternative renewable sources to enhance its sustainability. The energy produced is used for system operational purposes and EV charging services and is resold if there is an excess. The system's energy usage for a year is shown in the following Table 9.
Table 9. Energy sales
|
Stations |
Grid Sales (kWh/Year) |
|
Tanah Abang |
662 |
|
Tawang |
1000 |
|
Kota Baru |
799 |
Excess electricity is created when the amount of power generated at a given moment exceeds the demands or consumption of an electrical system or network. A significant difficulty in electrical systems is maintaining the proper balance between electrical overload and underload, mainly because these systems usually have limited capacity for long-term energy storage. It will take workable solutions to deal with this issue. This involves employing clever automation systems, transferring extra energy to other networks in need, or finding ways to store energy. These systems optimize energy utilization during surplus generation by dynamically allocating extra electricity to alternate purposes, including heating or charging batteries.
3.2 Cost analysis
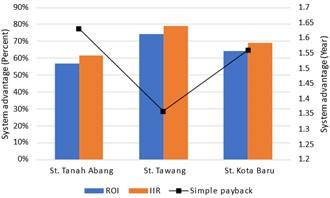
The analysis determines the optimum size variable for each principal component installed when operating alone. Values such as Operation & Maintenance, Capital Investment, and Annual Profit are considered as measuring parameters. HOMER compares the results of the same configuration at several different charging stations, as shown in Figure 8.
Comparative statistics on potential annual cost returns are displayed in Figure 9. The earnings are increased due to the high percentage of return on capital. When selecting the most strategic site, this profit % is the primary consideration, considering environmental characteristics that fluctuate throughout the year. Greater investment profits are indicated by more significant return on investment (ROI) and internal rate return (IIR) values, whereas payback reflects the more desirable return on capital ratio.
Figure 8. Comparison of system fees
Figure 9. Comparing system advantages
Figures 8 and 9 indicate that Semarang has the most potential for economic growth in St. Tawang. Compared to other cities, this one has the most changeable wind speed, contributing to its highly favorable environmental circumstances. With the help of average monthly solar radiation high enough to generate solar energy, it may generate the highest value of renewable energy production.
The total cost of electrical energy per kilowatt-hour, or CoE, as commonly known, can vary depending on the power generated. The magnitude of the NPC, which determines the overall cost of the system over a specific period, is the primary tool used to evaluate the effectiveness of system design. Because of this, the HOMER program prioritizes optimization solutions by assessing the NPC values in descending order of value. This method guarantees that the most economical system design may be found. The NPCs produced on St. Tawang by this hybrid system configuration are shown graphically in Figure 10.
Figure 10. Total NPCs on St. Tawang
3.3 Electric production monthly
A solar module's monthly electricity production is the total power it can produce monthly. Understanding system performance throughout the year depends on this statistic. The HOMER system simulation results for monthly power output are shown in Figure 11. According to the calculation, the system would produce its most power in January, at a peak output of about 14 megawatts. The most significant wind speed beam in January, around 5.13 m/s, corresponds with this production peak. Tawang Station has a higher wind intensity than the other two stations due to its lowland location and proximity to Java's northern shore, making wind speed a more relevant factor.
Figure 11. Monthly production
According to average monthly data on power output, EV-charging stations may primarily rely on the grid to satisfy their energy demands. This occurs due to the system's continued incapacity to supply renewable energy. Wind turbines generate different amounts of power depending on local conditions and wind speed. However, the use of solar panels is thought to be preferable since it can generate steady and reliable energy production all year long, is not entirely reliant on outside variables like wind speed, and can be a more practical way to increase the production of electricity in locations that receive enough sunlight.
This research investigates the efficiency and economic aspects of using wind turbine-solar panel hybrid microgrids to provide electricity supply for Electrical Support Facilities for Public Services implemented at several train stations on the island of Java. The data used in this research was collected from the HOMER-Grid application and other supporting information obtained through the Indonesian Central Statistics Agency (BPS). Although the load required by each station is similar, the hybrid microgrid configuration applied at each station location can vary, influenced by unique geographic conditions in each area. Through simulation results, Tawang Station, located in Semarang, is proven to have the most optimal microgrid system with lower investment costs and significant electricity production.
Energy consumption at EV charging stations is still dominated by conventional electricity due to the low production of renewable energy fractions. This study used the same configuration at several locations, indicating that further development of optimized system configurations is still needed to increase energy production. Therefore, this research encourages further studies to identify and develop a hybrid microgrid system with solar panels that can maximize the potential of renewable energy in each region at an affordable cost while increasing the electricity supply capacity for EV charging stations. This research is likely to positively contribute to optimizing the use of solar energy as an alternative energy source that can address the electricity access challenges still faced by several EV charging stations on the island of Java.
This research was fully supported by the PNBP grant from the Universitas Sebelas Maret, Indonesia, with contract No.: 194.2/UN27.22/PT.01.03/2024 of the Hibah Riset Grup Penelitian scheme.
[1] Lange, S., Pohl, J., Santarius, T. (2020). Digitalization and energy consumption. Does ICT reduce energy demand? Ecological Economics, 176: 106760. https://doi.org/10.1016/j.ecolecon.2020.106760
[2] Riayatsyah, T.M.I., Geumpana, T.A., Fattah, I.R., Mahlia, T.I. (2022). Techno-economic analysis of hybrid diesel generators and renewable energy for a remote island in the Indian ocean using HOMER Pro. Sustainability, 14(16): 9846. https://doi.org/10.3390/su14169846
[3] Riayatsyah, T.M.I., Geumpana, T.A., Fattah, I.R., Rizal, S., Mahlia, T.I. (2022). Techno-economic analysis and optimisation of campus grid-connected hybrid renewable energy system using HOMER grid. Sustainability, 14(13): 7735. https://doi.org/10.3390/su14137735
[4] Arifin, Z., Tjahjana, D.P., Danardono, D., Muqoffa, M., Prasetyo, S.D., Alfaiz, N.F., Sanusi, A. (2022). Gridconnected hybrid PV-wind system simulation in urban Java. Journal Européen des Systèmes Automatisés, 55(4): 477-483. https://doi.org/10.18280/jesa.550406
[5] Mauludin, M.S., Prasetyo, S.D., Alfaiz, N.F., Arifin, Z. (2024). Techno-economic modeling of hybrid pv-hydroelectric generator systems in Semarang. Mathematical Modelling of Engineering Problems, 11(3): 783-791. https://doi.org/10.18280/mmep.110323
[6] Wadie, F. (2023). Analysis of the integrated effect of temporary overvoltages, PV transformer connection and overcurrent protection in hybrid PV-wind energy system. Electric Power Systems Research, 216: 109084. https://doi.org/10.1016/j.epsr.2022.109084
[7] Paradongan, H.T., Hakam, D.F., Wiryono, S.K., Prahastono, I., Aditya, I.A., Banjarnahor, K.M., Asekomeh, A. (2024). Techno-economic feasibility study of solar photovoltaic power plant using RETScreen to achieve Indonesia energy transition. Heliyon, 10(7): e27680. https://doi.org/10.1016/j.heliyon.2024.e27680
[8] Langer, J., Zaaijer, M., Quist, J., Blok, K. (2023). Introducing site selection flexibility to technical and economic onshore wind potential assessments: New method with application to Indonesia. Renewable Energy, 202: 320-335. https://doi.org/10.1016/j.renene.2022.11.084
[9] Pambudi, N.A., Nanda, I.R., Alfina, F.T., Syahrial, A.Z. (2024). Renewable energy education and awareness among Indonesian students: Exploring challenges and opportunities for a sustainable future. Sustainable Energy Technologies and Assessments, 63: 103631. https://doi.org/10.1016/j.seta.2024.103631
[10] Hardianto, H. (2019). Utilization of solar power plant in Indonesia: A review. International Journal of Environment, Engineering and Education, 1(3): 1-8. https://doi.org/10.55151/ijeedu.v1i3.21
[11] Prasetyo, S.D., Prabowo, A.R., Arifin, Z. (2023). The use of a hybrid photovoltaic/thermal (PV/T) collector system as a sustainable energy-harvest instrument in urban technology. Heliyon, 9(2): e13390. https://doi.org/10.1016/j.heliyon.2023.e13390
[12] Prasetyo, S.D., Budiana, E.P., Prabowo, A.R., Arifin, Z. (2023). Modeling finned thermal collector construction nanofluid-based Al2O3 to enhance photovoltaic performance. Civil Engineering Journal, 9(12): 2989-3007. https://doi.org/10.28991/CEJ-2023-09-12-03
[13] Satwika, N.A., Hantoro, R., Septyaningrum, E., Mahmashani, A.W. (2019). Analysis of wind energy potential and wind energy development to evaluate performance of wind turbine installation in Bali, Indonesia. Journal of Mechanical Engineering and Sciences, 13(1): 4461-4476. https://doi.org/10.15282/jmes.13.1.2019.09.0379
[14] Widyaparaga, A., Sopha, B.M., Budiman, A., Muthohar, I., Setiawan, I.C., Lindasista, A., Oka, K. (2017). Scenarios analysis of energy mix for road transportation sector in Indonesia. Renewable and Sustainable Energy Reviews, 70: 13-23. https://doi.org/10.1016/j.rser.2016.11.206
[15] Widyanti, A., Erlangga, R., Sutarto, A.P., Trapsilawati, F., Ansori, N., Woodman, R., Rifai, A.P. (2024). Driving forward together: The common intention of Indonesians in different residential areas to use autonomous vehicles. Transportation Research Interdisciplinary Perspectives, 24: 101049. https://doi.org/10.1016/j.trip.2024.101049
[16] Prasetyo, S.D., Arifin, Z., Prabowo, A.R., Budiana, E.P. (2024). Investigation of the addition of fins in the collector of water/Al2O3-based PV/T system: Validation of 3D CFD with experimental study. Case Studies in Thermal Engineering, 60: 104682. https://doi.org/10.1016/j.csite.2024.104682
[17] Prasetyo, S.D., Arifin, Z., Prabowo, A.R., Budiana, E.P. (2024). Examining various finned collector geometries in the Water/ Al2O3 based PV/T system: An analysis using computational fluid dynamics simulation. International Journal of Heat & Technology, 42(3): 851-64. https://doi.org/10.18280/ijht.420314
[18] Wiloso, E.I., Wiloso, A.R., Setiawan, A.A.R., Jupesta, J., Fang, K., Heijungs, R., Faturay, F. (2024). Indonesia's contribution to global carbon flows: Which sectors are most responsible for the emissions embodied in trade?. Sustainable Production and Consumption, 48: 157-168. https://doi.org/10.1016/j.spc.2024.05.005
[19] Ubaidillah, Arifin, Z., Regannanta, F.J., Rachmanto, R.A., Widhiyanuriyawan, D., Yohana, E., Mauludin, M.S., Prasetyo, S.D. (2024). An examination of hybrid PV-Biogas power plants for electric vehicle charging station development in Indonesia. International Journal of Design & Nature and Ecodynamics, 19(1): 201-209. https://doi.org/10.18280/ijdne.190122
[20] Setiawan, A.D., Zahari, T.N., Purba, F.J., Moeis, A.O., Hidayatno, A. (2022). Investigating policies on increasing the adoption of electric vehicles in Indonesia. Journal of Cleaner Production, 380: 135097. https://doi.org/10.1016/j.jclepro.2022.135097
[21] Sunitiyoso, Y., Belgiawan, P.F., Rizki, M. (2022). Public acceptance and the environmental impact of electric bus services. Transportation Research Part D: Transport and Environment, 109: 103358. https://doi.org/10.1016/j.trd.2022.103358
[22] Kanakadhurga, D., Prabaharan, N. (2024). Smart home energy management using demand response with uncertainty analysis of electric vehicle in the presence of renewable energy sources. Applied Energy, 364: 123062. https://doi.org/10.1016/j.apenergy.2024.123062
[23] Sarkar, R., Saha, P.K., Mondal, S., Mondal, A. (2024). MAGE: Microgrids with advanced grid efficiency through battery-aware EV management. Sustainable Cities and Society, 107: 105399. https://doi.org/10.1016/j.scs.2024.105399
[24] Khalid, M., Thakur, J., Bhagavathy, S.M., Topel, M. (2024). Impact of public and residential smart EV charging on distribution power grid equipped with storage. Sustainable Cities and Society, 104: 105272. https://doi.org/10.1016/j.scs.2024.105272
[25] Rachmanto, R.A., Regannanta, F.J., Ubaidillah, Arifin, Z., Widhiyanuriyawan, D., Yohana, E., Prasetyo, S.D. (2023). Analysis development of public electric vehicle charging stations using on-grid solar power plants in Indonesia. International Journal of Transport Development and Integration, 7(3): 215-222. https://doi.org/10.18280/ijtdi.070305
[26] Candan, A.K., Boynuegri, A.R., Onat, N. (2023). Home energy management system for enhancing grid resiliency in post-disaster recovery period using Electric Vehicle. Sustainable Energy, Grids and Networks, 34: 101015. https://doi.org/10.1016/j.segan.2023.101015
[27] Tjahjana, D.D.D.P., Suyitno, Rachmanto, R.A., Juwana, W.E., Prasojo, Y.J., Prasetyo, S.D., Arifin, Z. (2023). Economic feasibility of a PV-wind hybrid microgrid system for off-grid electrification in Papua, Indonesia. International Journal of Design & Nature and Ecodynamics, 18(4): 811-818. https://doi.org/10.18280/ijdne.180407
[28] Elomari, Y., Mateu, C., Marín-Genescà, M., Boer, D. (2024). A data-driven framework for designing a renewable energy community based on the integration of machine learning model with life cycle assessment and life cycle cost parameters. Applied Energy, 358: 122619. . https://doi.org/10.1016/j.apenergy.2024.122619
[29] Gilbile, P., Pisal, R., Dagade, T., Digole, S. (2023). Numerical investigation of heat transfer characteristics of spiral, helical, and conical tubes. Materials Today: Proceedings, 72: 1556-1560. https://doi.org/10.1016/j.matpr.2022.09.386
[30] Porté-Agel, F., Bastankhah, M. and Shamsoddin, S. (2020). Wind-turbine and wind-farm flows: A review. Boundary-Layer Meteorology, 174(1): 1-59. https://doi.org/10.1007/s10546-019-00473-0
[31] Ceylan, C., Devrim, Y. (2023). Green hydrogen based off-grid and on-grid hybrid energy systems. International Journal of Hydrogen Energy, 48(99): 39084-39096. https://doi.org/10.1016/j.ijhydene.2023.02.031
[32] Sadat, S.A., Faraji, J., Babaei, M., Ketabi, A. (2020). Techno-economic comparative study of hybrid microgrids in eight climate zones of Iran. Energy Science & Engineering, 8(9): 3004-3026. https://doi.org/10.1002/ese3.720
[33] Megaptche, C.A.M., Musau, P.M., Tjahè, A.V., Kim, H., Waita, S., Aduda, B.O. (2023). Demand response-fuzzy inference system controller in the multi-objective optimization design of a photovoltaic/wind turbine/battery/supercapacitor and diesel system: Case of healthcare facility. Energy Conversion and Management, 291: 117245. https://doi.org/https://doi.org/10.1016/j.enconman.2023.117245
[34] Hasan, S., Zeyad, M., Ahmed, S.M., Anubhove, M.S.T. (2023). Optimization and planning of renewable energy sources based microgrid for a residential complex. Environmental Progress & Sustainable Energy, 42(5): e14124. https://doi.org/10.1002/ep.14124
[35] Prasetyo, S.D., Regannanta, F.J., Birawa, A.R., Alfaridzi, M.S. (2023). Techno-economic evaluation of hybrid photovoltaic-wind energy systems for Indonesian government buildings. Journal of Sustainability for Energy, 2(3): 132-144. https://doi.org/10.56578/jse020303