Samir Ali Amin*![]() | Ahmed Hashim Kareem
| Ahmed Hashim Kareem![]() | Ismail Ibrahim Marhoon
| Ismail Ibrahim Marhoon![]() | Diana Abd Alkareem Noori Kattab
| Diana Abd Alkareem Noori Kattab![]() | Hasan Shakir Majdi
| Hasan Shakir Majdi![]()
© 2024 The authors. This article is published by IIETA and is licensed under the CC BY 4.0 license (http://creativecommons.org/licenses/by/4.0/).
OPEN ACCESS
The correlation of welding input heat and microstructure and its impacts on multi-pass mechanical properties in storage tanks alloy steel plate of thickness 6mm using multiple passes SMAW was investigated experimentally and using SOLIDWORKS and ANSYS thermal and Mechanical Simulator. The heat-affected zone (HAZ) dimension was calculated, and the deformation in each pass was also calculated. Optical microscopy was used to characterize the weld metal microstructure effects on joint mechanical properties, the effects of the three pass sequences in deformation, and the resulting alterations in weld metal microstructure. In addition, the impact of this alteration in corrosion resistance characteristics was investigated, and steel samples were simulated. The investigation results illustrated increasing the weldment deformation with increasing heat inputs in the three-pass sequence. The welding joint microstructure shows a big difference in M-A (martensite-austenite) phase formation between the first, second, and third pass microstructure. In addition, the microstructure examinations showed the formation of AF (acicular ferrite) in the third pass, with a higher percentage in the second and first pass. This research demonstrated scientific information about the expected deformation of each pass from the three welding joints, the alteration in microstructures, and the corrosion resistance of the weldment according to the alteration with welding heat input.
M-A phase, AF formation, ANSYS, SOLIDWORKS design, corrosion resistance
Alloy steels for storage tanks were primarily developed as replacements for low-carbon steels in applications such as oil equipment, storage tanks, and heavy industries. The objective was to improve the ratio of strength to weight and meet the demand for construction-grade materials with increased strength [1]. Welding alloy steel causes uneven temperature changes, resulting in a more pronounced heat-affected zone (HAZ), heightened vulnerability to cold cracking, and residual stress in the welded components. Alloy steels have unique properties such as high strength, excellent ductility, and favorable ability to be welded. In addition, they exhibit exceptional resilience to low-temperature impact, exceeding that of high-yield strength (HY) steels [2]. The heat input determines the chemical composition of the filler material, which undergoes a phase shift in the weld metal. Meanwhile, the deposition mechanisms used govern the distribution of heat. Two other crucial elements in welding setups include the structural configuration of the joint (geometry) and the welding technique employed [3].
The heat input is a critical factor as it directly impacts the highest temperature at various locations within the heat-affected zone and the rate at which it subsequently decreases. Residual stress is caused by the differences in contraction levels in different parts of a weld and is strongly linked to the thermal history [4]. Filler chemistry has a significant effect on the initial stage of phase transition and the resulting thermal strain, which is counteracted by volume expansion. This information is documented in a review study conducted by Withers and Bhadeshia [5].
Shielded metal arc welding (SMAW) techniques are frequently employed in the fabrication of alloy steel welded structures, such as oil pipeline networks, storage tanks, buildings, and pressure vessels. The SMAW process has several advantages, such as decreased equipment costs, equipment portability, and the capability to weld in various orientations and confined spaces. By utilizing cellulosic consumables, it is feasible to achieve increased welding speed and welds that have greater penetration. Nevertheless, it is crucial to acknowledge the potential issue of hydrogen dissolution [6, 7].
The use of high heat input welding is becoming widespread for alloy steel due to the adoption of increasingly sophisticated and complex facilities and equipment [8]. Nevertheless, the utilization of this welding technique is limited in actual scenarios since the coarse-grained heat-affected zone (CGHAZ) is well recognized as the weakest part of welds. The disintegration of large previous austenite grains results in the formation of a brittle and coarse microstructure, including ferrite side plate, Widmanstatten ferrite, and upper bainite. This microstructure is easily formed and contributes to weak toughness [9].
However, intragranular ferrite (IGF), particularly acicular ferrite (IAF), can effectively hinder the propagation of cracks by generating a significant misalignment at a high angle between the interlocked ferrite plates and the neighboring microconstituents [10]. Moreover, the growth of IGF is intricately connected to the dimensions of the preceding austenite grains (PAGS) and the locations where nucleation occurs. The primary determinant of the Post-Austenite Grain Size (PAGS) is the heat input during welding. A larger austenite grain size leads to a higher internal area available for the development of Intergranular Ferrite (IGF) [11].
The formation of a localized region of brittleness, known as a local brittle zone (LBZ), is a critical factor that influences the strength and resilience of the welded metal. The fragility in this area shows differences based on the chemical composition of the material and the conditions of welding [12]. Reports indicate that the presence of the needle ferrite phase reduces the hardness of steel by more than 77% [13]. Furthermore, the grains located close to the fusing line act as nucleation sources. Crystals occur on the grains of the substrate because the weld pool has a high wetting ability. Epitaxial nucleation and growth take place without altering the crystallographic orientations. During the process of solidification, grains frequently form in a columnar pattern that is perpendicular to the boundary of the pool. The reason for this is that the region experiences the most significant temperature gradient [14].
The thermal fluctuations experienced during the welding process can disturb the balance between high strength and exceptional toughness in HSLA steels, leading to reduced toughness in the heat-affected zone (HAZ) [15]. The correlation between PAGS (Prior Austenite Grain Size) and phase transition during the breakdown of austenite in steels is widely acknowledged. According to research, the coarse-grained heat-affected zone (CGHAZ) is expected to have the least amount of hardness [16]. The CGHAZ, or Coarse-Grained Heat-Affected Zone, is a component of the HAZ, or Heat-Affected Zone, immediately adjacent to it. This is in contrast to the inter-critical HAZ and fine-grained HAZ. It is situated adjacent to the weld fusion line. The CGHAZ experiences substantial austenitic grain coarsening as a result of the elevated peak temperature. As a result, the development of ferrite is impeded during the cooling process, leading to a higher occurrence of brittle ferrite side plates and upper bainite. As a result, a fragile area called the LBZ is formed. Increasing the formation of intragranular ferrite nuclei is the most efficient method because it reduces the nucleation that occurs at the borders between austenite grains. This reduction is induced by an increase in the size of the prior austenite grains (PAGS) [17].
The storage tank is made of alloy steel ASTM A516. The investigation selected a curved plate made of steel with a thickness of 6mm. The welding specimens were fabricated with dimensions of 75mmx100mm. This steel plate is mainly used to manufacture storage tanks for the oil industry. Every welding sample consists of two curved plates fixed vertically on a metallic base representing the storage tank base. All experimental weld metals analyzed in this study were produced using the SMAW process.
The welding procedure used the same heat input value of 31.5kJ/inch for the three passes provided in Table 1. chemical composition and mechanical characteristics of steel are provided in Table 2. The projected joint design and heat input quantity is computed according to the 13th edition of the (LINCOLN ARC WELDING PROCEDURE HANDBOOK) [18], as illustrated in Figure 1. The welding procedures were conducted using a three-pass technique. After welding, nine samples were extracted from the welded specimens to conduct microstructural analysis and the microhardness in the heat-affected zone (HAZ) and the weld metal.
The specimens underwent grinding, polishing, and etching with 1 to 5ml HNO3 in 99ml ethanol (95%) or methanol (99%). The microstructure was analyzed using the Meiji MT 8100 optical microscope (OM). Concurrently, the microstructure picture was examined to get grain size and area measurements. Indentations were created in the welding and heat-affected zones (HAZ) using a weight of 1 kilogram to measure microhardness. The examination was conducted following the ASTM E384 standard.
Table 1. Welding prosses parameters
|
Parameters |
Welding Passes |
||
|
1 st pass |
2 nd pass |
3 rd pass |
|
|
Electrode Dia. |
3/8 inch |
3/8 inch |
3/8 inch |
|
Voltage (volt) |
35 |
35 |
35 |
|
Current (Amp) |
150 |
120 |
120 |
|
Speed (inch/mm) |
10 |
8 |
8 |
Table 2. ASTM A516 Grade 65 chemical composition
|
C |
Mn |
P |
S |
Si |
Fe |
|
0.24 |
1.1 |
0.033 |
0.034 |
0.34 |
balance |
Figure 1. Welding joint design according to (Lincoln arc welding procedure handbook)
The first stage of welding simulation involves the creation of a weldment and the determination of joint geometry. The welding joint design was executed using SOLIDWORKS software. The research had a vertical joint between two curved plates. One side featured a V joint with a 1.6mm root gap and a 1.6mm root face. The other side had 60-degree angle joints with a thickness of 6 mm, a height of 70mm, and a length of 50mm on either side of the joints with 100mm total. These details may be seen in Figure 2. The selection of this joint design was based on the suggested joint design for SMAW welding with a thickness of 6mm for vertical butt welding, as specified in welding standards [18].
Figure 2. Solidworks welding joint design model
Three models representing the joint three passes designed by SOLIDWORKS were imported into ANSYS to analyze each welding pass heat profile, deformation, and residual stress during welding. SOLIDWORKS offers an intuitive interface that is easier to apply, making it available to novice and skilled customers. Its parametric modeling abilities allow for green layout modifications. Users can effortlessly switch CAD design to simulation studies without exporting to outside software. This integration streamlines the workflow and decreases errors. ANSYS is a powerful finite element evaluation (FEA) software application. It makes a specialty of complicated simulations, which incorporates structural, thermal, and Multiphysics analyses.
Many engineering tasks have advantages from the use of SOLIDWORKS and ANSYS. Designers create the geometry in SOLIDWORKS, and then engineers perform unique simulations in ANSYS. The transition is smooth because of interoperability. The fusion welding joint design study is conducted in two distinct processes, treating it as an independent issue. An analysis of the thermal properties of a welding joint was conducted to forecast the distribution of welding temperatures inside the welded structure based on the design of the junction. Subsequently, a mechanical study was performed to determine the thermal loads associated with welding. This investigation aimed to determine and assess the distribution of residual stress and deformation.
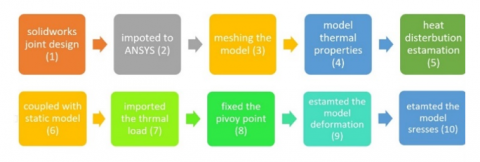
The flow chart illustrating the analytical technique may be seen in Figure 3. The welding joint temperature was applied to the simulation model by selecting the joint zone and then entering the welding temperature into it as a boundary condition to determine the maximum heat distribution and deformation. Throughout this simulation, it was assumed that any modifications in temperature and mechanical conditions would govern the corresponding changes in mechanical characteristics. The mechanical and chemical characteristics of the welding material's plate closely resemble those of the tank being welded. The boundary conditions are the same. The plates are secured at the periphery, while the temperature of the weld metal reaches 1700℃.
Figure 3. Coupled simulation procedure
Once the simulation starts and the solution is achieved, one may examine the resulting temperatures and distortion patterns. The model's mesh has been constructed using finite elements, as seen in Figure 4. The parent material's initial temperature before welding was documented at 22℃. According to Teng et al. [19], turbulence occurs on the molten surface during TIG welding when the welding current surpasses 225 A. Using a volume heat generation model for replicating the heat source is recommended. Assuming a smooth and liquid surface is advisable if the current is 200 A or below. Using a surface heat flow model as the primary heat source is advised in such cases. J. Goldak's study highlights the viability of using the welding heat source in the double ellipsoid form for two- and three-dimensional volume flux [20]. Examining the welding process heavily relies on investigating elements used to replicate the heat source produced by the electric arc. Exploring the fusion zone (FZ), heat-affected zone (HAZ), heat input distribution, and the cooling rate and thermal gradients as the primary parameters for analysis is essential. The mathematical calculation used to calculate the heat input or electrical power of a welding arc is as follows.
$Q=U I / V 0.06$ (1)
The variable V represents the speed at which welding is performed, U represents the voltage of the arc, and I represents the current used for welding. According to the AWS D1.1 standard, the welding current used in this investigation was 400A, while the voltage used was 35 volts. The welding travel speed in Eq. (6) is computed based on the minimal critical cooling rate required for alloy steel, ensuring that martensite does not develop in the microstructure of the welding zone.
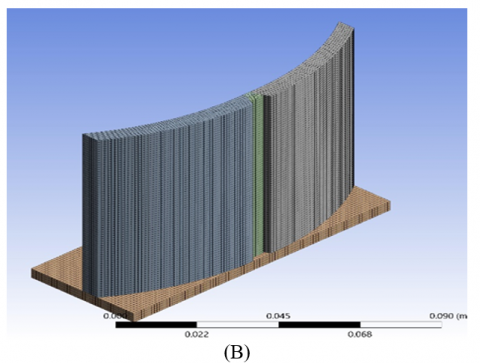
Figure 4. ANSYS models mesh processes (A) first pass model (B) second pass model (C) third pass model
Meshing is an essential component of the engineering simulation process. To ensure the accuracy of the simulation, it is necessary to meticulously create a high-quality mesh since this is of utmost importance. Producing an ideal mesh is critical in engineering simulations since it directly affects the simulation's accuracy, convergence, and efficiency. Computers cannot conduct simulations on the actual geometric form of a CAD model due to the inability to apply governing equations to an ill-defined geometry. Mesh elements enable the resolution of governing equations on volumes with known geometries and are mathematically defined. Typically, the equations solved on these meshes are partial differential equations. Due to the iterative nature of these calculations, it is impractical to solve these equations by hand. Hence, computer methodologies such as Finite Element Analysis (FEA) are used.
An ANSYS 2022 R1 mesh configuration was used for the meshing process to ensure the best distribution of mesh elements for the welding joint geometry approach. The initial thickness is fixed at 6 mm for the joint metal. The size of the elements was (1) mm for the V joint with a root gap joint simulated with 310987 nodes and 67030 elements for the first pass model, 317635 nodes and 68220 elements for the second pass model, and 326405 nodes with 69830 elements for the third pass model, all the models meshed with multizone methods as shown in Figure 4. The present work has modeled three welding passes of a single V joint design geometrically assembled in a vertical joint and defined using Solidworks dimensions. Three experimental samples were prepared and welded to compare the ANSYS model deformation results and the actual condition deformation for more reality and validation of the simulation model results.
Energy conservation is essential when analyzing the transfer of heat in welding. This approach is used to resolve a solid's fundamental heat conduction equation. To conduct heat analysis, ANSYS employs a suitable mesh optimization approach to create a finely detailed mesh for the three specified joint passes' base metal and welding joints. The heat conduction equation controls the thermal field, expressed as:
$\begin{aligned} \partial / \partial x(K(T) \partial T / \partial x) & +\partial / \partial y(K(T) \partial T / \partial y) \\ & +\partial / \partial z(K(T) \partial T / \partial z)+Q_{-} v \\ & =\rho(T) C_{-} p(T) \partial T / \partial t\end{aligned}$ (2)
The variables in the equation are T for temperature, k(T) for thermal conductivity, ρ(T) for specific mass, Cp(T) for specific heat, and QV for volumetric heat flow. The thermodynamic boundary conditions on the exterior surfaces of a solid include heat transport by convection and radiation. Newton's heat transfer law determines the heat flow density for convection (qc) in a gas or liquid environment
$q_c=\rho(T) h_c\left(T-T_0\right)$ (3)
T represents the temperature of the external surface, T0 represents the temperature of the gas or liquid, and hc represents the convective heat transfer coefficient. This coefficient is influenced by the convection conditions at the solid surface, the qualities of the surface, and the surrounding environment.
Mathematical models and numerical analysis are essential for predicting heat distribution and the thermal, elastic, plastic, and residual stresses in welding joints. Phase transformation takes place at a comparatively low temperature, allowing for the anticipation of changes in microstructure, volume, and phase transformation inside welding joints and the heat-affected zone (HAZ) using welding heat distribution models. This may aid in predicting the resultant mechanical characteristics. The temperature distribution is computed and stored for every joint configuration in the welding thermal analysis. This distribution is then used as thermal loading to generate the thermal stress field in the mechanical analysis. This enables the computation of thermal strains and stresses over the whole design. The thermal elastoplastic material model utilizes the Von Mises yield criteria and isotropic strain hardening rule to establish stress-strain relations, which may be mathematically stated as:
$\varepsilon_{\text {total }}=\varepsilon_e+\varepsilon_p+\varepsilon_t$ (4)
To comprehend the equation, we may articulate the constitutive equation in the following manner:
$\sigma=D=D\left(\varepsilon_{ {total }}-\varepsilon_p-\varepsilon_t\right)$ (5)
where, D, representing material stiffness, was used to simulate elastic-plastic behavior with linear kinematic hardening. For most alloy steels, the yield stress experiences a substantial drop as the temperature increases, ultimately vanishing at the melting point. The thermal load generated by applying the melting temperature of the alloy steel, 1500℃, to the welding zone was used to simulate real-life conditions for the joint three passes with fixed upper and lower sides of the weldment. ANSYS determined the Von-Mises stresses and deformation resulting from this thermal load.
The following sections outline the outcomes and analysis of temperature forecasting, deformations, and fixture effects.
7.1 Weld joint temperature field numerical analysis
Figures 5 (A) to (C) show the results of temperature distribution comparisons for the three welding passes. The ANSYS simulation of the three passes yields accurate estimations of the temperature distribution, precisely revealing the height of the heat-affected zone (HAZ) and the size of the fusion zone. The HAZ determined the spatial extent to which the temperature remains below 723℃, beyond which the metal microstructure would remain unchanged. The results indicated that the Heat Affected Zone (HAZ) had a length of 25.13mm from the centerline of the welding, with a fusion boundary of 1.7mm. Additionally, the size of the AC3 zone for the first pass was around 17.6mm. The second examination revealed a heat-affected zone (HAZ) of 29.4mm, a fusion zone of 2.6mm, and an AC3 size of 22.4mm. The third pass showed that the Heat Affected Zone (HAZ) measured 30.2mm, the fusion zone measured 3.8mm, and the AC3 zone was 25mm. The heat input and chemical composition substantially influence the changes in the microstructure and mechanical characteristics of the welded metal. Optimal welding parameters must be selected to meet the quality standards. To prevent fragility, it is essential to maintain the increased resilience of welded steel for operations at low temperatures [21, 22]. The widths of the three welds throughout the Heat Affected Zones (HAZs), as shown in Figure 5, display almost similar dimensions for the three samples when exposed to the same heat input during welding. However, the fusion zone widths in the third specimen of the weld pass exceed those of the samples from the first and second passes. Reports indicate that the heat capacity (C) for the same welding configuration is the decisive element for the breadth of the Heat heat-affected zone (HAZ) [23]. The heat-affected zones (HAZs) in all specimens had almost identical sizes due to the same heat input and capacity values. On the other hand, the width of the fusion zone is dictated by the thermal diffusivity, the amount of heat input, and, hence, the thermal conductivity (K) [24]. The third pass specimen has a more expansive fusion zone due to its higher cumulative heat input.
During the heating process, a noticeable alteration in the microstructure of the weldment occurs at the lower critical temperature (A1), which has been determined to be 740℃. Further heating of the sample leads to further transformation in the microstructure, reaching the upper critical temperature (A3) of 936℃. The thermal expansion causes an increase in the length of the sample when it is heated, as seen. The decrease in temperature below the critical point is ascribed to transforming the body-centered cubic (BCC) α-iron in the steel into a tightly packed structure known as austenite. The change in gradient at the higher critical temperature is once again ascribed to the complete conversion of the steel into packed γ (austenite) from the (α+γ) region. Higher temperatures lead to the sample's expansion due to thermal expansion.
Figure 5. HAZ and fusion zone dimension to (A) the first pass, (B) the second pass, and (C) the third pass
7.2 Weld joint deformation numerical analysis
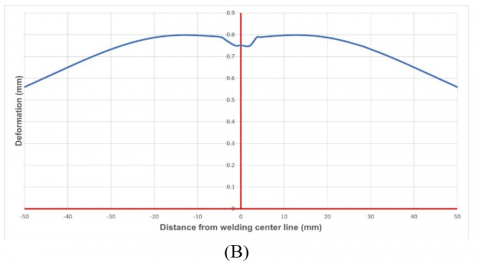
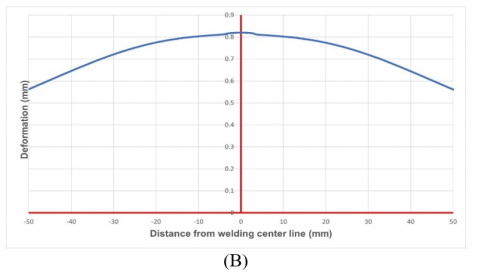
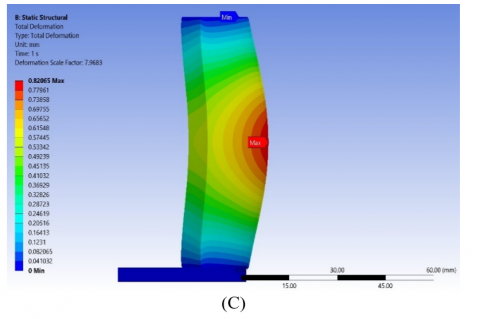
The temperature fluctuations determined by numerical analysis for each weld pass were used in the mechanical analysis to calculate the distortions of each pass. Three scenarios for each welding pass were analyzed to comprehend the heat distribution impacts of multipass weld joints. The ANSYS model depicting the vertical distortion of the plate, as derived from finite element analysis models, is shown in Figures 6, 7, and 8 correspondingly. The numerical analysis revealed that the angular distortion in the first pass resulted in a maximum deformation of 0.69 mm at the center of both joint plates. Figure 6 demonstrates that the angular distortion progressively rises as one moves farther away from the fixtures at the joint's top and bottom. Figures 6 (A) and (B) illustrate the distribution of distortion along the X-axis of the two vertical joints. Figure 6 (C) shows the orientation of angular deformation about the welding face. Figures 7 (A) and (B) depict the second pass deformation, where a maximum deformation of 0.79mm was observed precisely at the position of the weldment, with the weldment center line aligned along the X axis. Figure 7 (C) illustrates that the angular deformation direction aligned with the first pass deformation direction and the direction of the weld face.
Figure 6. First pass deformation (A) maximum deformation location, (B) deformation distribution, and (C) deformation direction
Figure 7. Second pass deformation (A) maximum deformation location, (B) deformation distribution, and (C) deformation direction
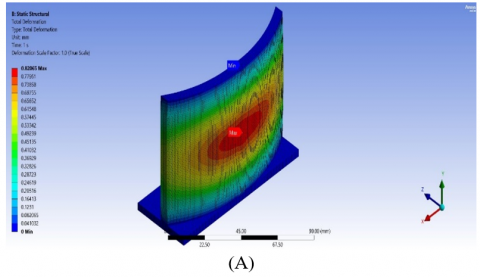
Figure 8 (A) displays the location and maximum value of the deformation during the third pass. The ANSYS simulation recorded a maximum deformation of 0.82 mm during the third pass. Figures 8 (B) and (C) illustrate the location and direction of the third pass, which aligns with the direction of the first and second passes. The key elements that influence the extent of angular distortion in welding are the characteristics of the materials being welded, the shape of the weld groove, the kind of connection, the level of constraint, and the specific welding process used [25]. The distortion is directly influenced by the heat input during welding [26]. Reduced heat during welding results in decreased distortion. The possible cause of this issue might be attributed to the combination of a narrow bead width and a low D/T ratio. The D/T ratio refers to the ratio of the weld depth (D) to the plate thickness (T), and it defines the extent of angular distortion caused by the low current and heat input [27]. The level of distortion increases proportionally with the rise in electric current. The heat input increase is attributable to the bead width and D/T ratio surge. An increase in the width of the bead leads to a corresponding increase in distortion caused by more significant shrinkage on the top side of the weld bead. Continued escalation of the current leads to an augmentation in the amount of heat being supplied and a reduction in both the breadth of the bead and the ratio of the diameter to the thickness. Raising the weld current in a standard electric arc welding process reduces the distortion angle and improves the penetration capacity. However, this also leads to the weld form needing to be narrower with only a little increase in depth. The weld bead shape leads to a higher angular distortion angle [28]. the fixture location had essential effects on the locations and amounts of the deformation in the welded structure, from the below figures the deformation becomes noticeable at the welding joint center because this region is free from any fixtures, and the same rule for the three welding pass, the first pass even welded with high welding current to ensure the root full penetration but it had the minimum deformation, due to the restricted of this pass by the adjacent base metal from both sides, while the maximum deformation recorded in the third pass due to the high amount of molten metal required to fill this pass and also the open surface from the above.
Figure 8. Third pass deformation (A) maximum deformation location, (B) deformation distribution, and (C) deformation direction
7.3 Microstructure alterations
The repeated exposure to heat cycles, ranging from 1500 to 100℃, forms a more robust but less resilient microstructure in the welding zone of the first pass. This is seen in Figure 9 (A). The microstructure exhibited ferrite laths with uninterrupted carbide stringers at the interfaces and a densely entangled high dislocation density. Following the cumulative thermal cycling in the second pass, as seen in Figure 9 (B), the dislocation structure transformed into stable arrays at sub-boundaries. At the same time, the carbide network exhibited a more haphazard orientation and clustering. The microstructure shown in Figure 9 (C) during the third pass consists of a bainitic structure that exhibits a sheaf-like morphology. A small M-A (martensite-austenite) phase is present, resulting from heating over 1250℃.
Figure 9. Weld joint microstructure (A) first pass microstructure (B) second pass microstructure (C) third pass microstructure
The microstructures in this context are categorized into three zones based on the heat inputs from the welding passes. The heated samples in these areas experienced high temperatures, likely leading to partial automation. This resulted in localized automation with carbon levels ranging from 0.5-0.8% [29] and sometimes exceeding 1% [30, 31]. Under certain circumstances, these regions enriched with carbon transform into martensite and retained austenite or M-A phases, which exhibit varying sizes and orientations [32]. Regrettably, the authors did not meticulously track the alterations in joints with the thermal cycles, leaving the specific peak temperature(s) responsible for the bulk of the modifications unclear. According to prior research [33], the most significant alterations in the tensile characteristics of a weld metal comparable to the one in this investigation were seen when the weld metal, in its original state, was subjected to temperature cycles reaching a maximum of 1900 F, followed by cycles going 1350 F. The formation of the M-A phase has been seen at many advantageous sites, including prior-austenite grain borders in the form of big, bulky particles. Additionally, some studies have found the presence of the M-A phase at the bainitic interfaces, exhibiting varied sizes and morphologies [34]. The occurrence of M-A phases in steels has been attributed to various variables by different researchers. Suzuki et al. [35] have determined that heat input is a critical factor in creating the M-A phase, and a higher amount of the M-A phase is expected to occur at five kJ/mm. Furthermore, they propose that the M-A phase disintegrates at more significant heat inputs up to 60kJ/mm. However, it should be noted that this range exceeds the typical parameters used for welding a regular girth pipe. The maximum formation of the M-A phase could also be related to the second and third pass peak temperature, which may be within a wide range of temperatures. Bonnevie et al. [36] The maximum formation of the M-A phase is related to a temperature range of 20℃ to 50℃ above the AC1 temperature.
7.4 Microstructure alterations effects on corrosion resistance
An increase in the amount of AF (acicular ferrite) in the weld may reduce the corrosion resistance of the weld metal. The formation of AF may be attributed to diffusion and shear processes, therefore establishing a correlation between these activities and the occurrence of AF [37]. Additional corrosion defects may lead to an elevated corrosion rate [38]. The AF transition causes the formation of a polygonal ferrite with a high density of dislocations. AF has the advantage of increasing the size of the crystal's grain boundary. This allows carbon to go to the border and boost its activity by creating a carbon-rich film [39]. The galvanic effect accelerates the electrochemical corrosion rate of the weld metal, whereas corrosion cells form upon the interaction of AF with other microstructures. Hence, alterations in the microstructure are linked to variations in the corrosion rate.
The microstructure shown in Figure 9 (A) displays a notable formation of primary ferrite (PF) because of the intense power intensity emitted by the heat source and the substantial heat input resulting from the low welding speed, therefore resulting in a rapid cooling rate. This structure exhibits the most minimal degree of corrosion resistance. Figure 9 (B) depicts a microstructure that exhibits about equal amounts of PF and AF structure, leading to a modest degree of corrosion resistance. The microstructure exhibiting the most excellent corrosion resistance identified in this investigation is shown in Figure 9 (C). A substantial quantity of alpha ferrite (AF) near the grain boundary is a defining characteristic of this phenomenon. This may be due to the low welding heat and high welding speed. The findings validated the precision of the modeling outcomes and distinctly showcased the influence of welding heat input and the multi-pass sequences of the welding joint on the corrosion.
7.5 Microhardness test results
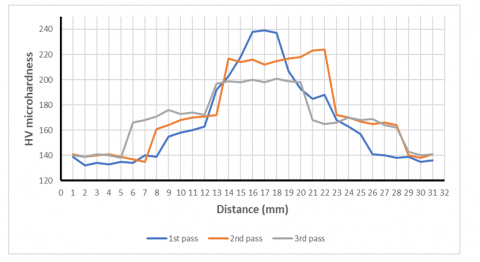
This study entailed doing a microhardness examination on the base metal, weld metal, and heat-affected zone (HAZ) regions at 1mm intervals. The relationship between the cooling rate and the microhardness of both the heat-affected zone (HAZ) and the weld metal is apparent. More precisely, a faster rate of cooling leads to an increased microhardness. The hardness range of the welded material was determined to be 204-226HVN, 207-216HVN, and 197-199HVN. Figure 10 illustrates the microhardness profile at different zones within the weld metal during the first, second, and third passes. As the indenter moves from the left side of the base metal towards the fusion boundary and weld metal, the microhardness of the first pass welding sample increases from 134 to 226 HVN. Similarly, the microhardness of the second pass increases from 135 to 216 HVN, and the microhardness of the third pass increases from 139 to 199 HVN. The study found that the weld metal had the maximum microhardness when compared to the heat-affected zone (HAZ) and the base metal.
Figure 10. Three welding joint passes the microhardness profile
The inadequate cooling rate in the heat-affected zone (HAZ) is a contributing factor to the decreased hardness in this area since it results in the retention of heat. The aforementioned event was explained in his book, as indicated in the study [39]. Typically, the phenomenon of grain nucleation and growth in austenite can lead to a reduction in dislocations and work hardening compared to its initial condition. Annealing the heat-affected zone (HAZ) can have a substantial effect on the composition and structure of the material. The total result reduces the frequency of dislocations and the degree of hardness. Despite the high temperatures to which the welded metal is exposed, the cooling process is quick, leading to the creation of extremely fine grains. Furthermore, fine grain forms exhibit a diminished proximity between neighboring grains. The stress necessary for dislocations to move across grains can be calculated by using Eq. (6).
$\tau_{\Omega}=G B / L$ (6)
The equation has three variables: G, which represents the shear Young modulus; B, which represents the dislocation Burger's vector; and L, which represents the length of the separated distance. The increased hardness found in the welded zone can be attributed to variables such as the reduced grain size, the presence of needle-shaped ferrite, or the existence of Widmanstatten structures inside the ferrite grains. Eq. (7) establishes a negative correlation between hardness and particle size [40].
$H=H_0+K \sqrt{d}$ (7)
The variables in question are labeled as follows: H denotes hardness, K is the proportionality constant, and d denotes particle size. Consequently, the decrease in hardness in the heat-affected zone (HAZ) can be ascribed to the formation of grains and the existence of the ferrite phase in this specific region, as evidenced by prior research [41, 42].
Under conditions of rapid cooling, the heat-affected zone (HAZ) exhibited a maximum hardness value of 197 HVN on the left side and 190 HVN on the right side of the welded metal. The site was located near the fusion barrier and was designated as the Heat Affected Zone (HAZ). A comparable location was found in the second and third welding passes under the medium and low cooling rates. The Heat Affected Zone (HAZ) exhibited the highest recorded hardness values of 174HVN on the left side and 173HVN on the right side during the second pass. On the third run, the hardness values reached a high of 168 HVN on both sides. The results suggest that every increase in the cooling rate has a corresponding effect on the hardness of the heat-affected zone (HAZ). The microhardness of the three welding passes is compared in Figure 10.
The results of the ANSYS models heat distribution and welding joint deformation for the three passes were compared with the experimental real welding results to evaluate the simulation results, three samples were welded for this evaluation, the first one welded with a single pass, the second with double pass, and finally the third with full three passes. the HAZ width for the three samples was 28mm for the first pass, 33mm for the second pass, and 34mm for the final pass, these results were different by about 10% from the simulation results. The deformation of the samples was measured by using a digital measuring tool and comparing them with the simulation results, the results were 0.73mm, 0.87mm, and 0.94mm respectively, these results are larger than the simulation results but it's very close. The authors explain this divergence due to the real welding condition control like the voltage, welding speed, and environment temperature.
Weld joint sequences for storage tank walls are experimentally and numerically investigated to study the influences of heat input from welding over distortion, microstructure, and corrosion resistance in passes. The results still provide important insights into the relationship between temperature mechanical properties and corrosion resistance in weldment.
The study found that the heat input for the three-pass sequence, rising toward greater minimizers, left the deformation of weldments. The maximum deformation occurred in the third pass, showing that since temperature input to the substrate increases cumulatively in multiple passes, more considerable distortion consequences from a single thermal input can be observed when added up during different passes. This observation emphasizes the necessity of careful controlling for heat entrance in measure welding to reduce deformation. The microstructural assessment demonstrated significant changes in weld metal microstructure throughout passes 1, 2, and 3. The second and the first passes formed the M-A phase (martensite - austinite) and AF (acicular ferrite), but with a more significant percentage of AFs than M-A in the 2nd and 1st passes, respectively. The production of AF with a low percentage causes corrosion resistance to fall, owing to the formation of corrosion cells and the galvanic effect. As a result, the microstructure with a more extensive AF% content demonstrated better corrosion resistance in this research.
Numerical simulations based on SOLIDWORKS and ANSYS software produced very close estimations regarding the welding junction's temperature distribution, deformation, and residual stress. Hence, they proved to be more effective than a standard method. The simulation results were verified by comparing them with experimental data about actual deformation observed in preform samples. Through the simulations, we could determine the heat and elastic behavior of welding seams with reasonable accuracy, which is very helpful in devising an efficient welding process.
This research contributes to the scientific knowledge of welding heat input and its impact on joint corrosion resistance, microstructure structures, and distortion in storage tank wall weld joint pass sequences. The implications of the findings show the crucial nature of controlling heat input in multi-pass welding to maintain distortion and microstructures and corrosion resistance for weldments. Numerical simulations prove to be a handy tool for predicting and optimizing the welding process, which thus significantly decreases the expenditure of resources spent on costly and lengthy experimentation. The explorative study indicated that future research would study the relationship between welding heat input, microstructure, and corrosion resistance in alloy steel and welding processes. Further, besides the more detailed advanced numerical models and simulation practices for optimally predicting weld joints' thermal and mechanical behavior, their quality needs to be improved. This method would lead to a practical design and performance of welded materials like manufacturing and pharmaceutical companies' storage tanks.
[1] Mohamed, M.S., Abtan, A.A., Moosa, A.U. (2023). Microstructure and mechanical properties assessments of 304 austenitic stainless steel and monel 400 dissimilar GTAW weldment. Journal of Composite & Advanced Materials/Revue des Composites et des Matériaux Avancés, 33(3): 135-144, https://doi.org/10.18280/rcma.330301
[2] Abdulameer, A.G., Mohammed, M.S., Abbas, A.S. (2022). Microstructure variation effects influence on characteristics and mechanical properties of Monel 400 and low alloy steel (ASTM 387-Gr.11) GTAW dissimilar joint. Eastern-European Journal of Enterprise Technologies, 5(12(119): 13-20. https://doi.org/10.15587/1729-4061.2022.266264
[3] Kumar, S., Shahi, A.S. (2011). Effect of heat input on the microstructure and mechanical properties of gas tungsten arc welded AISI 304 stainless steel joints. Materials & Design, 32(6): 3617-3623. https://doi.org/10.1016/j.matdes.2011.02.017
[4] Alipooramirabad, H., Ghomashchi, R., Paradowska, A., Reid, M. (2016). Residual stress-microstructure-mechanical property interrelationships in multipass HSLA steel welds. Journal of Materials Processing Technology, 231: 456-467. https://doi.org/10.1016/j.jmatprotec.2016.01.020
[5] Withers, P.J., Bhadeshia, H.K.D.H. (2001). Residual stress. Part 2-Nature and origins. Materials Science and Technology, 17(4): 366-375. https://doi.org/10.1179/026708301101510087
[6] Alipooramirabad, H., Kotousov, A., Ghomashchi, R. (2014). Numerical analysis of welding stresses in WIC weldability test. In 8th Australasian Congress on Applied Mechanics: ACAM, 8: 731-738.
[7] Kotousov, A., Borkowski, K., Fletcher, L., Ghomashchi, R. (2012). A model of hydrogen assisted cold cracking in weld metal. In International Pipeline Conference. American Society of Mechanical Engineers, 45141: 329-334. https://doi.org/10.1115/IPC2012-90385
[8] Di, X., Li, M., Yang, Z., Wang, B., Guo, X. (2016). Microstructural evolution, coarsening behavior of vanadium carbide and mechanical properties in the simulated heat-affected zone of modified medium manganese steel. Materials & Design, 96: 232-240. https://doi.org/10.1016/j.matdes.2016.02.038
[9] Yang, X., Di, X., Liu, X., Wang, D., Li, C. (2019). Effects of heat input on microstructure and fracture toughness of simulated coarse-grained heat affected zone for HSLA steels. Materials Characterization, 155: 109818. https://doi.org/10.1016/j.matchar.2019.109818
[10] Luo, X., Niu, Y., Chen, X., Tang, H., Wang, Z. (2017). High performance in base metal and CGHAZ for ferrite-pearlite steels. Journal of Materials Processing Technology, 242: 101-109. https://doi.org/10.1016/j.jmatprotec.2016.11.016
[11] Dey, I., Chandra, S., Saha, R., Ghosh, S.K. (2018). Effect of Nb micro-alloying on microstructure and properties of thermo-mechanically processed high carbon pearlitic steel. Materials Characterization, 140: 45-54. https://doi.org/10.1016/j.matchar.2018.03.038
[12] Million, K., Datta, R., Zimmermann, H. (2005). Effects of heat input on the microstructure and toughness of the 8 MnMoNi 5 5 shape-welded nuclear steel. Journal of Nuclear Materials, 340(1): 25-32. https://doi.org/10.1016/j.jnucmat.2004.10.093
[13] Bhole, S.D., Nemade, J.B., Collins, L., Liu, C. (2006). Effect of nickel and molybdenum additions on weld metal toughness in a submerged arc welded HSLA line-pipe steel. Journal of Materials Processing Technology, 173(1): 92-100. https://doi.org/10.1016/j.jmatprotec.2005.10.028
[14] Kolhe, K.P., Datta, C.K. (2008). Prediction of microstructure and mechanical properties of multipass SAW. Journal of Materials Processing Technology, 197(1-3): 241-249. https://doi.org/10.1016/j.jmatprotec.2007.06.066
[15] Haddad-Sabzevar, M., Haerian, A., Seied-Hossein-Zadeh, H. (2009). A stochastic model for austenite phase formation during arc welding of a low alloy steel. Journal of Materials Processing Technology, 209(8): 3798-3807. https://doi.org/10.1016/j.jmatprotec.2008.08.039
[16] Caballero, F.G., Roelofs, H., Hasler, S., Capdevila, C., Chao, J., Cornide, J., Garcia-Mateo, C. (2012). Influence of bainite morphology on impact toughness of continuously cooled cementite free bainitic steels. Materials Science and Technology. 28(1): 95-102. https://doi.org/10.1179/1743284710Y.0000000047
[17] Garcia, C., Cornide, J., Capdevila, C., Caballero, F.G., De Andrés, C.G. (2008). Influence of V precipitates on acicular ferrite transformation part 2: Transformation kinetics. ISIJ International, 48(9): 1276-1279. https://doi.org/10.2355/isijinternational.48.1276
[18] Dauod, D.S., Mohammed, M.S., Aziz, I.A., Abbas, A.S. (2023). Mechanical vibration influence in microstructural alterations and mechanical properties of 304 stainless steel weld joints. Journal of Engineering Science and Technology, 33-54.
[19] Teng, T.L., Chang, P.H., Tseng, W.C. (2003). Effect of welding sequences on residual stresses. Computers & Structures, 81(5): 273-286. https://doi.org/10.1016/S0045-7949(02)00447-9
[20] Teixeira, P.R.D.F., Araújo, D.B.D., Cunda, L.A.B.D. (2014). Study of the gaussian distribution heat source model applied to numerical thermal simulations of TIG welding processes. Repositório Institucional. Ciência & Engenharia (Science & Engineering Journal), 23 (1): 115-122. http://repositorio.furg.br/handle/1/5044
[21] Lee, C.H., Shin, H.S., Park, K.T. (2012). Evaluation of high strength TMCP steel weld for use in cold regions. Journal of Constructional Steel Research, 74: 134-139. https://doi.org/10.1016/j.jcsr.2012.02.012
[22] Kah, P., Layus, P., Ndiwe, B. (2021). Submerged arc welding process peculiarities in application for Arctic structures. AIMS Materials Science, 9(3): 498-511. https://doi.org/10.3934/matersci.2022029
[23] Chon, L.T., Chin, M.T. in: ASM Handbook. (1993). Welding, brazing, and soldering. (No Title), ASM International, 6(322): 12.
[24] Sharapov, Y.V. (1972). Width calculation for automatic submerged arc butt welds. Welding Prod., 3(1972): 45-47.
[25] Kumar, A. (2011). Effect of various parameters on angular distortion in welding. International Journal of Current Engineering and Technology, 35(08): 132-136.
[26] Venkatesan, M.V., Murugan, N., Prasad, B.M., Manickavasagam, A. (2013). Influence of FCA welding process parameters on distortion of 409M stainless steel for rail coach building. Journal of Iron and Steel Research, International, 20(1): 71-78. https://doi.org/10.1016/S1006-706X(13)60047-3
[27] Aggarwal, I., Faujdar, N., Das, A., Khanna, P. (2018). Mathematical modeling for predicting angular distortion in TIG welding of stainless steel 409L butt welds. International Journal of Research in Engineering and Technology, 7(06): 92-97. https://doi.org/10.15623/ijret.2018.0706013
[28] Tseng, K.H. (2013). Development and application of oxide-based flux powder for tungsten inert gas welding of austenitic stainless steels. Powder Technology, 233: 72-79. https://doi.org/10.1016/j.powtec.2012.08.038
[29] Ikawa, H., Oshige, H., Tanoue, T. (1980). Effect of martensite-austenite constituent on HAZ toughness of a high strength steel. Transactions of the Japan Welding society, American Technical Society, USA., 11(2): 87-96.
[30] Lambert, A., Lambert, A., Drillet, J., Gourgues, A.F., Sturel, T., Pineau, A. (2000). Microstructure of martensite-austenite constituents in heat affected zones of high strength low alloy steel welds in relation to toughness properties. Science and Technology of Welding and Joining, 5(3): 168-173. https://doi.org/10.1179/136217100101538164
[31] Siciliano, F., Stalheim, D.G., Gray, J.M. (2008). Modern high strength steels for oil and gas transmission pipelines. In International Pipeline Conference, 48593: 187-195. https://doi.org/10.1115/IPC2008-64292
[32] Li, C., Wang, Y., Han, T., Han, B., Li, L. (2011). Microstructure and toughness of coarse grain heat-affected zone of domestic X70 pipeline steel during in-service welding. Journal of Materials Science, 46: 727-733. https://doi.org/10.1007/s10853-010-4803-y
[33] Krantz, B.M. (1972). Factors affecting the strength of multipass low-alloy steel weld metal. In NASA. Langley Res. Center Proc. of the Symp. on Welding, Bonding, and Fastening. Ibid., Research Suppl., 50(6): 235-sto241-s.
[34] Taban, E. (2008). Toughness and microstructural analysis of superduplex stainless steel joined by plasma arc welding. Journal of Materials Science, 43(12): 4309-4315. https://doi.org/10.1007/s10853-008-2632-z
[35] Suzuki, S., Kamo, T., Komizo, Y. (2009). Influence of martensitic islands on fracture behaviour of high heat input weld HAZ. Welding International, 23(6): 397-402. https://doi.org/10.1080/09507110802542817
[36] Bonnevie, E., Ferriere, G., Ikhlef, A., Kaplan, D., Orain, J.M. (2004). Morphological aspects of martensite–austenite constituents in intercritical and coarse grain heat affected zones of structural steels. Materials Science and Engineering: A, 385(1-2): 352-358. https://doi.org/10.1016/j.msea.2004.06.033
[37] Eliyan, F.F., Mahdi, E.S., Alfantazi, A. (2013). Investigating the corrosion of API-X100 pipeline steel in aerated carbonate solutions by electrochemical methods. International Journal of Electrochemical Science, 8(1): 578-590. https://doi.org/10.1016/S1452-3981(23)14042-9
[38] Diaz, E.F., Gonzalez-Rodriguez, J.G., Sandoval-Jabalera, R., Serna, S., Campillo, B., Neri-Flores, M.A., GaonaTiburcio, C., Martinez-Villafañe, A. (2010). A study of the carboxyethylimidazoline as an H2S corrosion inhibitor of X-120 pipeline steel. International Journal of Electrochemical Science, 5(12): 1821-1836. https://doi.org/10.1016/S1452-3981(23)15387-9
[39] Ameer, M.A., Fekry, A.M., Shanab, S.M. (2011). Electrochemical behavior of titanium alloy in 3.5% NaCl containing natural product substances. International Journal of Electrochemical Science, 6(5): 1572-1585. https://doi.org/10.1016/S1452-3981(23)15094-2
[40] Gharibshahiyan, E., Raouf, A.H., Parvin, N., Rahimian, M. (2011). The effect of microstructure on hardness and toughness of low carbon welded steel using inert gas welding. Materials & Design, 32(4): 2042-2048. https://doi.org/10.1016/j.matdes.2010.11.056
[41] Loureiro Altino, J.R. (2002). Effect of heat input on plastic deformation of undermatched weld. Journal of Materials Processing Technology, 128(1): 240-249.
[42] Kaçar, R., Kökemli, K. (2005). Effect of controlled atmosphere on the mig-mag arc weldment properties. Materials & Design, 26(6): 508-516. https://doi.org/10.1016/j.matdes.2004.07.027