Abdulrahman N. Hammo*![]() | Salwan S. Sabry
| Salwan S. Sabry![]() | Basil M. Saied
| Basil M. Saied![]()
© 2024 The authors. This article is published by IIETA and is licensed under the CC BY 4.0 license (http://creativecommons.org/licenses/by/4.0/).
OPEN ACCESS
This research investigates the characteristics and performance of magnetic core materials, including Silicon Steel, Amorphous, Ferrite, and Nanocrystalline, that are suitable for use in a switched-mode power supply (SMPS). The study examines the magnetic capability of the system within a frequency range of 10–17 kHz in order to assess the effectiveness of galvanic isolation. The study presents a systematic approach and provides an illustrative example to elucidate the process of designing an effective galvanic isolation for power electronics converters. The American Wire Gauge (AWG) standard is used to determine the appropriate wire for the windings. The selection of ferrite materials N-97 and N-92 is based on their favorable characteristics, including high permeability, low losses, and a satisfactory working temperature. The paper presents three comprehensive designs utilizing Ferrite cores across several operating frequencies. In the first design, utilizing Ferrite N-97 at a frequency of 10 kHz, the combined losses from the core and winding amounted to 2.148 W. Conversely, the second design consumes 35.16 W. The galvanic losses for the third design amount to 11.58 W. Every design possesses a certain core and Bobbin form. All three magnetic designs undergo verification to ensure that they are not saturated. An in-depth analysis and simulation of a 1 kW full-bridge DC-DC converter have been validated using "Ansys Software." An investigation of magnetic performance was conducted to assess the various core materials.
performance and evaluation, magnetic core materials, switched mode power supply
The worldwide demand on the DC energy has been increased rapidly for many applications such as medical equipments, electrical vehicles power management/charging stations, renewable energies, telecommunication power supplies, and data centers. Figure 1 explains the DC energy demand (in USD million) for demonstrated countries [1]. The DC-DC converter divided into non-isolated and isolated converters. The utilization of power electronics converters has become indispensable in our everyday existence. However, it is imperative that these converters are designed in a manner that is both efficient and reliable [2]. The galvanic isolation is an essential feature for power supplies especially for applications that required safety and adorability aspects [3, 4]. DC-DC converters accumulats energy in the coil by occasionally switching element within the structure, and then transferring this energy to the output to provide the desired power and voltage level. They are widely used in a variety of applications, including vehicle, military, aerospace, energy, mechatronics and medical systems, which require continuous and multiple voltage levels with an effective and secure galvanic isolation [5]. The study shows multiple stages of energy transfer. One of the stages is a dual active bridge with resonant DC-DC converter using high frequency galvanic isolation. Moreover, the galvanic isolation is preventing from the ground loop, isolating the two electric sides for the circuit to offer extra protection for a fault [6, 7]. Additionally, the galvanic isolation directly affects the power supply performance [8]. In order to design an efficient isolated power supply, multiple considerations have to be taken [9]. One of the most substantial factors is the galvanic isolation. One of Practical Study of Mixed-Core High Frequency Power Transformer .The design of medium- to high-frequency power electronics transformer aims not only to minimize the power loss in the windings and the core, but its heat removal features should also allow optimal use of both core and copper. Heat removal feature (e.g., thermal conduction) of a transformer is complex because there exist multiple loss centers. The bulk of total power loss is concentrated around a small segment of the core assembly where windings are overlaid [10, 11]. Many researches proposed and design isolated power electronics converters topologies [12]. Most of them are focusing on the circuit topology analysis in term of choosing circuits parameters such as the switches, printed circuits board, and other stuff. However, they did not cover the magnetic performance. This research introduces design and analysis of the galvanic isolation for switch mode power supply. The study adopts a proposed design steps and complete design example using the geometry method to design a high frequency isolation. Multiply ferromagnetic core materials are explained in terms of their performance such as BH curve, core losses, winding losses, operating temperature. This paper determines the magnetic properties for 1kW isolated full bridge DC-DC converter working under different operation conditions. The results are discussed using PExpert software “product of Ansys electronics desktop 2021R1” to verify the proposed design. The design aspects in terms of core shape, windings style, magnetic properties are determined and discussed in detailed.
Figure 1. DC power supplies market, by region [1]
This study is offering some advantages as follow:
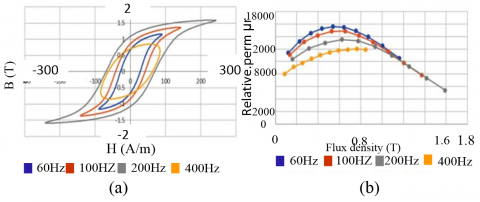
Ferromagnetic core materials play a substantial role for the galvanic isolation purpose and power electronics converters performance [13, 14]. When it comes to the proper magnetic design, multiple constrains have to be taken into account such as core’s losses, allowable temperature footprint, and cost. In this part of the study, different ferromagnetic materials for example Silicon Steel, Ferrite, Amorphous, and Nanocrystalline would be considered to explain their properties in terms of their BH curve characteristics, core losses. For the Silicon Steel 3% material, the BH curve is shown in Figure 2(a). This figure illustrates that the saturated flux density is about Bsat=1.6 Tesla happens at field intensity H=200 A/m at 60 Hz frequency [15]. Another consideration is the relative permeability µr. It is some sort of low as illustrated in Figure 2(b). For Silicon Steel core losses, the BH curve area represents the core losses for this material. Working at high frequencies would significantly increase that core losses, Due to that reason, Silicon Steel material is not recommended to work in switch mode power supply with the range of 10th kHz switching frequencies.
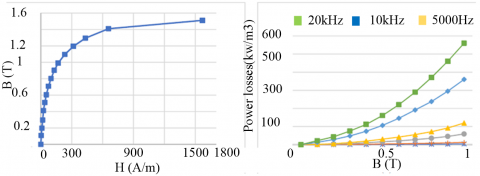
For the Amorphous material Figure 3(a) shows its BH cure [16]. It is noticeably that the saturation of the flux density Bsat = 1.5 Tessla occurred at field intensity H=1500 A/m. Obviously, the relative permeability for the Amorphous is larger than the Silicon Steel one. Figure 3(b) demonstrates the core losses for various range of frequencies. It is clearly that the Amorphous material would not work efficiently with the range of high frequencies due to its high core losses because that would leads to directly reduce the efficiency and rase the core temperature.
Figure 2. Silicon Steel (a) BH curve for different frequencies range, (b) relative permeability for different range of frequencies [15]
Figure 3. Amorphous core material (a) BH curve, (b) core losses for different range of frequencies [16]
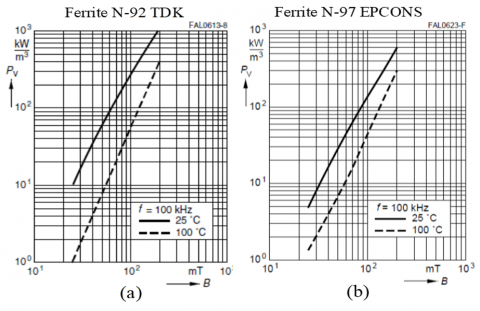
Figure 4 explains the different Ferrite core materials. Figure 4(a) shows the BH curve of the Ferrite N-92 from TDK while Figure 4(b) illustrates the Ferrite N-97 from EPCONS. It shows their performance in terms of their BH.Both materials have Bsal=510 mT occurred at H=1200 A/m [17].
Its clearly that the Ferrite materials have better relative permeability than the Amorphous and Silicon Steel one. For the core losses, Figure 5 illustrates their losses for these particular materials with different operating temperatures at 100 kHz for TOROIDS core. Figure 6 demonstrates various ferromagnetic core losses such as Amorphous, Ferrite, and Nanocrystalline with different operating frequencies. Certainly, the Nanocrystalline core has less losses. However, when it comes to a design the cost factor plays a crucial role. Since the Nanocrystalline material is the most expensive one, a trade off should be taken in to design consideration when another material such as Ferrite has an acceptable performance. Due to these reasons, this study would consider the design using the Ferrite material especially for range of frequencies between (10-20) kHz.
Figure 4. Ferrite BH curve (a) N-92 material, (b) N-97 material [17]
Figure 5. Ferrite core losses versus flux density on R34 TOROIDS for (a) TDK N-92 material, (b) EPCONS N-97 material [7, 17]
Figure 6. Various ferromagnetic core losses with different operating frequencies [16]
3.1 Proposed design steps
Multiple magnetic design methods for high frequency operating are used by researchers. However, this study focuses on the core geometry approach Kg. Various objective functions for the design could be considered such as allowable galvanic losses, temperature, and cost. The design steps for high frequency galvanic isolation are proposed in the following steps.
Step One: Specify input voltage = v1 output voltage = v2 input current = I1, output current= I2, switching frequency = fs, specific Max duty cycle = Dmax, turns ratio, ambient temperature, output power PO, η efficiency [18].
Step Two: Specify core material’s shape by calculate the Kg (core geometry constant) using Eq. (1)
$\mathrm{Kg}=\frac{\mathrm{p}_{\mathrm{t}}}{2 \mathrm{ke} \alpha}\left[\mathrm{cm}^5\right]$ (1)
where, ke (electrical constant) = 0.145 kf2 f2s (B)2 *10-4, Pt=total power $\alpha$ = Regulation %, B=flux density in Tesla, kf (form factor) = 4.0 for square wave, kf=4.44 for sin wave According to the calculated Kg value, core geometry (area, length, volume, window area= Wa, AC= effective area), and suitable bobbin size/shape can be determined.
Step Three: Specify (primary/secondary) windings, primary current, and the area of product= AP using Eqs. (2)-(4) [5, 19].
$\begin{array}{c} \mathrm{N}_{\mathrm{P}}=\frac{\mathrm{V} 1 ^* \text { ton }}{\Delta \mathrm{B} * \mathrm{~A}_{\mathrm{C}}}, \text { primary turns[Faradays law]} \\ \text { or } \mathrm{NP}=\frac{\mathrm{V} 1 ^* 10^{\wedge} 4}{\mathrm{k}_{\mathrm{f}} * \mathrm{Bm}_{\mathrm{m}} * f_{\mathrm{s}} * \mathrm{A}_{\mathrm{C}}} \\ \triangle \text {B is the variation of the flux density, ton= on time of the switches, and the } \mathrm{N}_{\mathrm{S}}= \text {secondary turns can be calculated from turn ratio}\\ \frac{\mathrm{Ns}}{\mathrm{Np}}=\frac{\mathrm{V} 2}{\mathrm{~V} 1} \end{array}$ (2)
$\mathrm{I}_1=\mathrm{Po} /(\mathrm{V} 1 ^* \eta),(\mathrm{Amp})$ (3)
$A_p=W_a \cdot A_C\left[\mathrm{cm}^4\right]$ (4)
Step Four: Identifying wire specification for the winding using Eqs. (5), (6) and AWG standard. Ku is utilization factor = 0.4 according to [20].
$\mathrm{J}=\frac{\mathrm{P}_{\mathrm{t}} ^* 10^{\wedge} 4}{\mathrm{kf} ^* \mathrm{ku} ^* \mathrm{Bm} ^* \mathrm{AP}}\left(\mathrm{A} / \mathrm{cm}^2\right)$, current density (5)
$\mathrm{A}_{\mathrm{w}}=\frac{\mathrm{I}_2 ^* \sqrt{\mathrm{Dmax}}}{\mathrm{J}}\left[\mathrm{cm}^2\right]$, wire area (6)
From Aw determined from the AWG (wire table), in order to reduce the skin effect of the wire it can be minimize when select wire that have the relationship (Rac /Rdc)=approach one:
Skin depth $\varepsilon=\frac{6.62}{\sqrt{ } f_s}$
Wire diameter $\mathrm{D}_{\mathrm{AWG}}=2 . \varepsilon$
$\mathrm{A}_{\mathrm{W}}($ wire area $)=\frac{\pi D^{\wedge} 2}{4}$
For the fill factor (winding to the whole window area of the core) should by <1 (recommend to be no greater than about 50% according to the PExpert tool.
Step Five: Estimate the copper loss, iron loss, and the transformer’s regulation in following Eq. (10), and the primary resistance& secondary illustrated in the following:
$\mathrm{R}_{\mathrm{p}}=\mathrm{MLT} \mathrm{N}_{\mathrm{P}}\left(\frac{\mu \Omega}{c m}\right) 10^{-6}$, primary resistance
$\mathrm{R}_{\mathrm{S}}=\mathrm{MLT} \mathrm{N}_{\mathrm{S}}\left(\frac{\mu \Omega}{\mathrm{cm}}\right) 10^{-6}$, secondary resistance
where, MLT = the mean length turns. It can be determined by manufacture data sheet. The term $\left(\frac{\mu \Omega}{\mathrm{cm}}\right)$ can be defined using the AWG standard table.
$\mathrm{P}_{\mathrm{cu} \text { Prim }}=\mathrm{I}_1{ }^2 \mathrm{R}_{\mathrm{p}}$ (7)
$\mathrm{P}_{\mathrm{cuSec}}=\mathrm{I}_2{ }^2 \mathrm{R}_{\mathrm{S}}$ (8)
$\mathrm{P}_{\mathrm{cu}}=$ total copper losses (pcu Prim &Pcu Sec)
The total loss =Ptotal loss (core losses &cu losses)
For the core losses Pcore=Ptotal loss- Pcu (watt)
In order to calculate the operating flux density, the ratio (mili Watt/gram) can be used the following Eq. (9), $\mathrm{W}_{\text {core}}$: core weight in gram.
$\frac{\mathrm{p}_{\text {core }}}{\mathrm{W}_{\text {core }}} 10^{-3}$ (9)
$\alpha=\mathrm{P}_{\mathrm{cu}} /\left(\mathrm{P}_{\mathrm{o}}+\mathrm{P}_{\mathrm{cu}}\right) 100 \quad \%$ (10)
Step Six: Specify core material’s type to be suitable for the application and operating frequency according to its BH curve and PB (core losses curve). This step is critical to find allowable flux density (Bo<Bsat), core losses, and curie temperature [21, 22]
To calculate temperature, rise of core using the following equation can be used (11) [23].
$\Delta \mathrm{T}=450\left(\frac{\text { Total losses }}{\text { surface area }=\mathrm{At}}\right)^{\wedge} 0.826$ (11)
Step Seven:
The final design should be check to evaluate its performance. Otherwise, another core material, core shape could be considered in order to achieve the required outcome.
To demonstrate the previous design steps, a full design example with its details is discussed in the following part of this paper.
3.2 Typical magnetic case study
Design a high frequency galvanic isolation with the following parameters
V1=250 V, V2=125 V, duty ratio=0.5, turn ratio=0.5, $f_S$=10 kHz, I2=8A, η=0.99,1KVA
Regulation α=1%, $\Delta B$=0.49Tesla, operate flux density in tesla B=0.245Tesla, core is ferrite material N97
Step one:
$$
\begin{gathered}
\text { Estimate } \mathrm{K}_{\mathrm{e}}=0.145 \mathrm{k}_{\mathrm{f}}{ }^2 \mathrm{f}_{\mathrm{s}}{ }^2 \mathrm{~B}_{\text {max }}{ }^2 10^{-4} \\
\mathrm{~K}_{\mathrm{e}}=0.145^* 4^{2*} 10000^{2*} 10.49^2 10^{-4}=5570 \\
\text { to find } \mathrm{k}_{\mathrm{g}}=\mathrm{VA} / \mathrm{K}_{\mathrm{e}} \\
1000 / 5570=0.179\left[\mathrm{~cm}^5\right]
\end{gathered}
$$
From table the manufacture data:
$$\begin{aligned}
& \mathrm{MLT}=15.8[\mathrm{cm}], \mathrm{w}_{\text {core }}=770 \text { [gram], MPL=14.6 [cm], } \\
& \mathrm{W}_{\mathrm{a}}=8.496\left[\mathrm{~cm}^2\right] \\
& \mathrm{A}_{\mathrm{C}}=9.1[\mathrm{cm}], \mathrm{w}_{\mathrm{tcu}}=475[\mathrm{gram}], \mathrm{A}_{\mathrm{P}}=77.314\left[\mathrm{cm}^4\right] \text {, } \\
& \mathrm{A}_{\mathrm{t}}=395\left[\mathrm{cm}^2\right] \\
&
\end{aligned}$$
Step two:
$\begin{array}{c} \text { Find } \mathrm{N}_{\mathrm{P}}=\frac{\mathrm{V} 1 * \text { ton }}{\Delta \mathrm{B} * \mathrm{Ac}}, \frac{2 \mathbf{2 5 0} * \mathbf{0}}{\mathbf{0 . 4 9 * 9 1 0}}=28 \text { turn, where, } \\ \text { ton }=\frac{1}{2 \mathrm{f}}=\frac{1}{2 * 10000}=50[\mu \mathrm{sec}] \\ \mathrm{N}_{\mathrm{sec}}=14 \text { turn from turn ratio }=0.5\end{array}$
Step three:
To find $\mathrm{AWG}$ from relation $\varepsilon=\frac{6.62}{\sqrt{f_s}} \mathrm{k}$
$\mathrm{k}=1$ for cupper, $\varepsilon=0.066[\mathrm{cm}]$
Wire diameter $\mathrm{D}_{\mathrm{AWG}}=2 ^* \mathcal{E}=2 ^* 0.066=0.1324[\mathrm{cm}]$
Bar wire area $=\mathrm{A}_{\mathrm{W}(\mathrm{B})}=\frac{\pi ^* D A W G^2}{4}=13.7[\mathrm{cm}]$
From wire table colum two AWG $=15$
Step four:
Calculate total copper losses
$\begin{gathered}\mathrm{R}_{\mathrm{p}}=15.8 ^* 28 ^* 104.3 ^* 10^{-6}=46[\mathrm{m} \Omega] \\ \mathrm{R}_{\mathrm{s}}=15.8 ^* 14 ^* 104.3 ^* 10^{-6}=23[\mathrm{m} \Omega] \\ \mathrm{I}_1=\frac{\mathrm{Po}}{\mathrm{Po}^* \mathrm{~V} 1}=\frac{1000}{0.99 ^* 250}=4.04[\mathrm{A}] \\ \frac{\mu \Omega}{\mathrm{cm}}=104.3 \text { from wire table } \\ \mathrm{P}_{\mathrm{cu}}=\mathrm{I}_1{ }^2 \mathrm{R}_{\mathrm{PRI}}+\mathrm{I}_2{ }^2 \mathrm{R}_{\mathrm{sec}}=2.2[\mathrm{watt}]\end{gathered}$
Step five:
Calculate core losses $\mathrm{p}_{\text {core }}$ from relation below:
$\left(\frac{\mathrm{mw}}{\mathrm{gram}}\right)=\mathrm{k}^* \mathrm{f}_{\mathrm{s}}{ }^{1.86} \mathrm{~B}^{2.47} / 1000$, where $\mathrm{k}=0.01$, for $\mathrm{N} 97$ stanmitzs coefficients $=0.01 ^* 10000^{1.86 *} 0.245^{2.47} / 1000=8.535$
$\mathrm{P}_{\text {core }}=8.535^* \mathrm{~W}_{\text {core }} 10^{-3}=8.535^*770^*10^{-3}=6.5[\mathrm{watt}]$
Total$=6.5+2.2=8.7[$watt$]$
$\Delta \mathrm{T}=450 ^*\left(\frac{8.7}{335}\right)^{0.826}=19.25^{\circ} \mathrm{C}$
$\eta=\frac{P o}{P \text { in }}=\frac{1000}{1000+8.7}=99 \%$
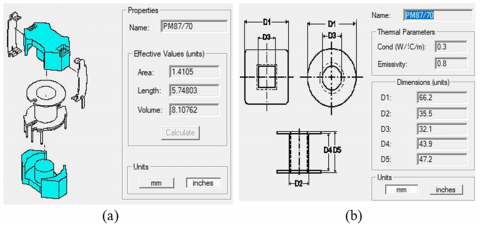
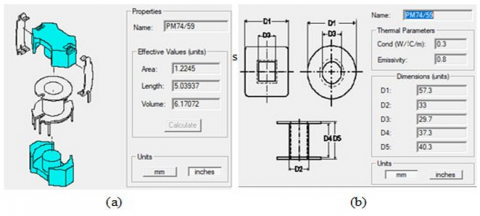
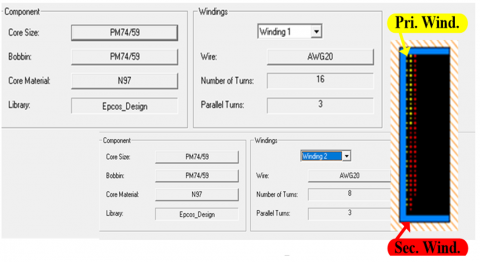
The circuit diagram for the isolated DC-DC converter is shown in Figure 7. It has been simulated using the PExpert software “product of Ansys electronics desktop 2021R1” .The circuit parameters are listed in sub section 3.2. The study adopts different ferromagnetic materials such as Ferrite N-97, and N-92 with various operating frequencies. This converter is selected to evaluate the magnetic performance in terms of core’s materials, dimension, shape, and wire specifications. This research conducts three complete magnetic design for this converter. For the first galvanic design, Ferrite N-97 core material is used at 10 kHz operating frequency. Figure 8 shows the first galvanic isolation design for the core, and Bobbin geometry dimensions in terms of area and width. For the primary/secondary windings aspect, Figure 9 demonstrates the wire specification. Both the primary and secondary windings use AWG15. The number of parallel wires is three for both sides, and the distributed wires are depicted for both sides.
Figure 7. Proposed isolated DC-DC full bridge converter for (1 kW) circuit diagram to design a proper galvanic isolation
Figure 8. First galvanic isolation design shape for Ferrite N-97 at 10 kHz (a) Core dimensions, (b) Bobbin dimensions
Figure 9. Winding aspect for the first galvanic isolation design for Ferrite N-97 at 10 kHz frequency
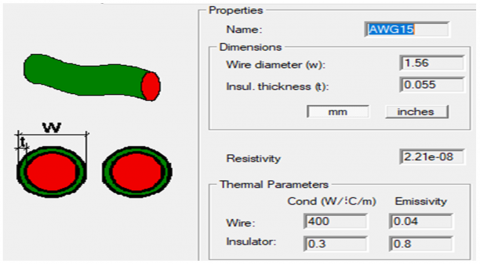
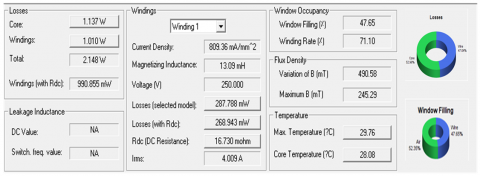
Additionally, the wire is detailed in terms of its diameter, insulation thickness, and thermal parameters as illustrated in Figure 10. Figure 11 shows the magnetic analysis results for Ferrite N-97 core. The results demonstrate the magnetic losses breakdown (core losses = 1.13 W, winding losses = 1.01 W). Moreover, additional information regarding the flux density, temperature, and window filling factor is determined for this operating condition.
Figure 10. Wire specification for the first design using N-97 Ferrite core at 10 kHz
Figure 11. Magnetic analysis results for the first design using N-97 Ferrite core at 10 kHz frequency
Figure 12 illustrates magnetic field intensity H, while Figure 13 shows the flux density B. Figure 14 shows the complete 3 D model for the first design using N-97 core material, 10 kHz operating, and PM 87/70 core shape. The second design utilizes the same core material, Ferrite N-97 at 17 kHz operating frequency. Figure 15 depicts Both core and Bobbin shape, dimensions. Figure 16 illustrate the winding aspect for the primary and secondary windings. Both the primary and secondary windings use AWG20. Each side features three parallel wires, and both sides display the distributed wires. Furthermore, Figure 17 provides a visual representation of the wire, including its diameter, insulation thickness, and thermal properties. Figure 18 displays the magnetic analysis findings for the Ferrite N-97 core. The results indicate the specific values of magnetic losses, with core losses amounting to 3.20 W and winding losses amounting to 31.96 W. Furthermore, more data pertaining to the flux density, temperature, and window filling factor are determined for this specific working situation.
Figure 12. Magnetic field intensity distributed H (A/m) for the Ferrite N-97 at 10 kHz frequency
Figure 13. Flux density (Tesla) distributed for the Ferrite N-97 at 10 kHz frequency
Figure 14. 3D model design for the Ferrite N-97 PM core shape 87/70
Figure 15. Second galvanic isolation design shape for Ferrite N-97 at 17 kHz (a) Core dimensions, (b) Bobbin dimensions
Figure 16. Winding aspect for the second galvanic isolation design for Ferrite N-97 at 17 kHz frequency
Figure 17. Wire specification for the second design using N-97 Ferrite core at 17 kHz
Figure 18. Magnetic analysis results for the second design using N-97 Ferrite core at 17 kHz frequency
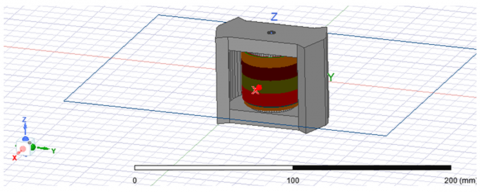
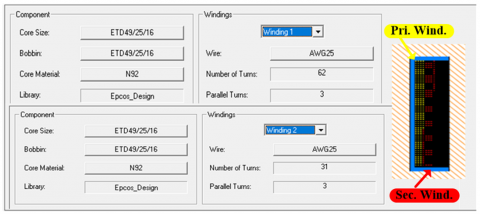
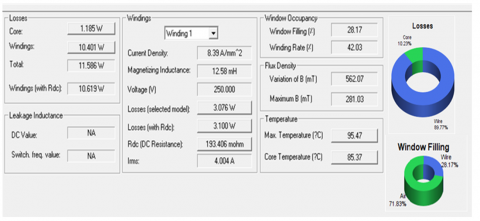
Figure 19 depicts the magnetic field intensity H. Figure 20 showcases the flux density B. The recent two figures provide evidence that the galvanic isolation for this design does not reach the saturation. For the 3D model of the second design, Figure 21 shows the complete shape. For the final design evaluation, Ferrite core N92 at 17 kHz frequency has been selected. Figure 22. illustrates the core, Bobbin shape, and size. The main and secondary windings wire specifications are shown in Figure 23. There are three parallel wires on each side, and the scattered wires are visible on both sides as well. In addition, the thermal characteristics, insulation thickness, and diameter of the wire are illustrated in Figure 24. The results of the magnetic investigation on the Ferrite N-92 core are shown in Figure 25. According to the findings, the magnetic losses were 1.18 W for the core and 10.40 W for the windings. In addition, for this particular working case, additional results about the flux density, temperature, and window filling factor are found. Figures 26 and 27 show the magnetic field intensity H, the flux density B respectively confirming the design does not saturate. The complete 3D design model is shown in Figure 28. Following the proposed of the three design models, the results for each model are summarized in Table 1. It is possible to determine the design's objective function by looking at its applications.
Figure 19. Magnetic field intensity distributed H (A/m) for the second design using Ferrite N-97 at 17 kHz frequency
Figure 20. Flux density (Tesla) distributed for the second design using Ferrite N-97 at 17 kHz frequency
Figure 21. 3D model design for the second design using Ferrite N-97 at 17 kHz
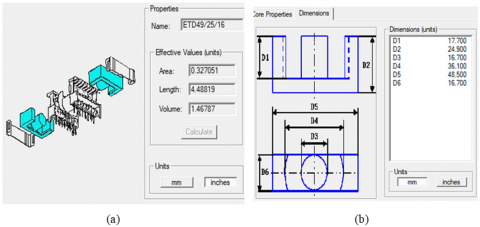
Figure 22. Third galvanic isolation design shape for Ferrite N-92 at 17 kHz (a) Core dimension, (b) Bobbin dimension
Figure 23. Winding aspect for the third galvanic isolation design for Ferrite N-92 at 17 kHz frequency
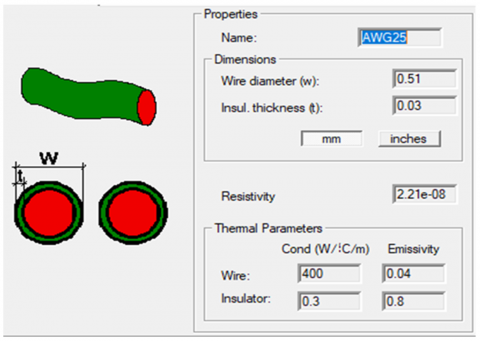
Figure 24. Wire specification for the third design using N-92 Ferrite core at 17 kHz
Figure 25. Magnetic analysis results for the third design using N-92 Ferrite core at 17 kHz frequency
Figure 26. Magnetic field intensity distributed H (A/m) for the third design using Ferrite N-92 at 17 kHz frequency
Figure 27. Flux density (Tesla) distributed for the third design using Ferrite N-92 at 17 kHz frequency
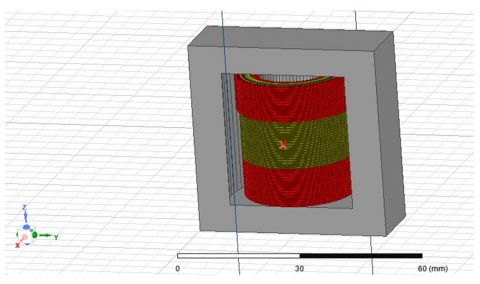
Figure 28. 3D model design for the third design using Ferrite N-92 at 17 kHz ETD49/25/16
Table 1. Galvanic isolation performance for the three proposed magnetic designed
|
Design Number |
Ferrite/Frequency |
Winding Losses (W) |
Core Losses (W) |
Total Losses (W) |
Foot Print (inch) |
Temp (°C) |
Primary (No. of Turn/AWG) |
Secondary (No. of Turn/AWG) |
|
1st Design |
N97at 10KHZ |
1.010 |
1.137 |
2.148 |
8.107 |
29.76 |
28/15 |
14/15 |
|
2nd Design |
N97at 17kHZ |
31.963 |
3.204 |
35.168 |
6.170 |
103.68 |
28/15 |
14/15 |
|
3rd Design |
N92 at 17kHZ |
10.401 |
1.185 |
11.586 |
1.476 |
95.47 |
62/25 |
31/25 |
Ultimately, this study elucidates the characteristics of ferromagnetic materials based on their field intensity, flux density, and losses across various operating frequencies. A comprehensive design case study is presented to develop an effective galvanic isolation solution for power electronics applications. This study thoroughly examines three designs that utilize distinct core materials and operate at various frequencies. In addition, a comprehensive analysis and demonstration of the performance outcomes are provided. The initial design technique utilizes N-97 ferromagnetic material operating at a frequency of 10 kHz. The findings demonstrate excellent performance with respect to winding losses of 1.01 W, core losses of 1.13 W, and a working temperature of just 29.76℃. The findings for the second strategy, which involves employing the same core material but at a higher operating frequency of 17 kHz, are as follows: The combined losses from the core and winding amount to 35.16 W, while the operating temperature is 103.68℃. Using N-92 Ferrite core material, the final method yielded the following results: the combined losses from the core and winding amount to 11.58 W, at a working temperature of 95.47℃. Each of the three techniques has a distinct footprint. The magnetic design should incorporate a trade-off particular to application based on the primary target function of the design.
The authors would like to express their thanks to the University of Mosul, Iraq, for the valuable help with this work.
[1] Markets and Markets. (2024). DC power supplies market. https://www.marketsandmarkets.com/Market-Reports/dc-power-supplies-market-8152817.html.
[2] Andersson, C. (2011). Design of a 2.5kW DC/DC fullbridge converter. Master of Science Thesis, Chalmers University of Technology, Göteborg, Sweden.
[3] Billings, K.H., Morey, T. (2011). Switchmode Power Supply Handbook. New York, NY: McGraw-Hill.
[4] Sabry, S., Enjeti, P. (2020). High frequency integrated solid state transformer (SST) for utility interface of solar pv/battery energy storage systems. In 2020 IEEE Applied Power Electronics Conference and Exposition (APEC), New Orleans, LA, USA, pp. 546-553. https://doi.org/10.1109/APEC39645.2020.9124199
[5] Janabi, A., Baranwal, R., Zhang, Z., Patil, D. R., Zhu, G., Sabry, S.S., Jones, M., Qian, L., Siavoshani, S.J., Ouwenga, D.R., McKay, B. (2024). Switchable bidirectional power converter with single power factor correction circuit and on board charger therewith. U.S. Patent No. 20240048058.
[6] Sabry, S.S., Alsammak, A.N.B. (2024). Power density enhancement of three-phase rectifier using higher frequency solid state transformer. Mathematical Modelling of Engineering Problems, 11(5): 1286-1292. https://doi.org/10.18280/mmep.110518
[7] Epcos, A. (2006). Ferrites and accessories-siferrit material N97. https://www.semic.cz/!MATERIALY/EPCOS/N97.pdf.
[8] Elektronic, W. (n.d.). For Do-It-Yourself Transformer Design. Wützh Electronics. https://www.scribd.com/document/262467777/Transformer-Design-by-Kanak.
[9] Sabry, S., Pool-Mazun, E.I., Enjeti, P. (2019). A medium voltage DC collection grid for large scale PV power plant with SCR converter and integrated solid-state transformer (SST). In 2019 IEEE Energy Conversion Congress and Exposition (ECCE), Baltimore, MD, USA, pp. 5824-5831. https://doi.org/10.1109/ECCE.2019.8913251
[10] Ameen, Y.M., Al-Badrani, H., Abdul Kadi, M.N. (2021). Design and simulation of a high-power double-output isolated Cuk converter. Eastern-European Journal of Enterprise Technologies, 5(5): 113. https://doi.org/10.15587/1729-4061.2021.238984
[11] Ortiz, G., Biela, J., Kolar, J.W. (2010). Optimized design of medium frequency transformers with high isolation requirements. In IECON 2010-36th Annual Conference on IEEE Industrial Electronics Society, Glendale, AZ, USA, pp. 631-638. https://doi.org/10.1109/IECON.2010.5675240
[12] Orenchak, G.G. (2004). Estimating temperature rise of transformers-by calculating core losses and winding losses, transformer temperature rise may be predicted. Power Electronics Technology, 30(7): 14-23.
[13] Reinert, J., Brockmeyer, A., De Doncker, R.W. (2001). Calculation of losses in ferro-and ferrimagnetic materials based on the modified Steinmetz equation. IEEE Transactions on Industry Applications, 37(4): 1055-1061. https://doi.org/10.1109/28.936396
[14] Montoya, R.J.G. (2015). High-frequency transformer design for solid-state transformers in electric power distribution systems. University of Arkansas.
[15] Das, D., Basu, K. (2020). Optimal design of a dual-active-bridge DC–DC converter. IEEE Transactions on Industrial Electronics, 68(12): 12034-12045. https://doi.org/10.1109/TIE.2020.3044781
[16] Zhang, S., Chen, D., Bai, B. (2022). Study of a high-power medium frequency transformer using amorphous magnetic material. Symmetry, 14(10): 2129. https://doi.org/10.3390/sym14102129
[17] Epcos. (2008). Ferrites and accessories ETD 59/31/22. June 2013.
[18] Müller, L., Kimball, J.W. (2016). High frequency core coefficient for transformer size selection. In 2016 IEEE Energy Conversion Congress and Exposition (ECCE), Milwaukee, WI, USA, pp. 1-6. IEEE. https://doi.org/10.1109/ECCE.2016.7855151
[19] McLyman, C.W.T. (2011). Transformer and Inductor Design Handbook. Boca Raton, FL: CRC Press.
[20] Rylko, M.S., Hartnett, K.J., Hayes, J.G., Egan, M.G. (2009). Magnetic material selection for high power high frequency inductors in DC-DC converters. In 2009 Twenty-Fourth Annual IEEE Applied Power Electronics Conference and Exposition, Washington, DC, USA, pp. 2043-2049. https://doi.org/10.1109/APEC.2009.4802955
[21] Sefa, İ., Balci, S., Bayram, M.B. (2014). A comparative study of nanocrystalline and SiFe core materials for medium-frequency transformers. In Proceedings of the 2014 6th International Conference on Electronics, Computers and Artificial Intelligence (ECAI), Bucharest, Romania, pp. 43-48. https://doi.org/10.1109/ECAI.2014.7090196
[22] Sivaprasad, A., Deepa, K., Mathew, K. (2012). Half bridge converter for battery charging application. International Journal of Engineering Science, 2(4): 994-999.
[23] Hart, D.W. (2011). Power Electronics (Vol. 166). New York: McGraw-Hill.