Yulinda Tarigan*![]() | Alrido Martha Devano
| Alrido Martha Devano![]() | Fandy Bestario Harlan
| Fandy Bestario Harlan![]() | Ameer Farhan Mohd Arzaman
| Ameer Farhan Mohd Arzaman![]() | Lutfiatun Nadia
| Lutfiatun Nadia![]() | Nurulizwa Rashid
| Nurulizwa Rashid![]()
© 2024 The authors. This article is published by IIETA and is licensed under the CC BY 4.0 license (http://creativecommons.org/licenses/by/4.0/).
OPEN ACCESS
The analysis of supplier selection aims to identify suppliers that best match an organization’s specific needs. In the past, an Indonesian manufacturing enterprise relied solely on price as a criterion for selecting suppliers, overlooking other important factors. This study employs a qualitative approach using the analytic hierarchy process (AHP) to select suppliers of sand raw materials. A geometric mean algorithm calculates eigenvalues and ranks the suppliers based on various criteria. The evaluation is based on the vendor performance indicator (VPI) criteria, which include quality, cost, lead time, flexibility, and responsiveness. The findings indicate the following global weightings for each supplier: Supplier U (0.224), Supplier V (0.327), Supplier W (0.197), Supplier X (0.123), Supplier Y (0.052), and Supplier Z (0.077). From this assessment, Supplier V is identified as the most suitable vendor for raw sand materials. Consequently, the enterprise should consider selecting Supplier V as its primary supplier.
analytic hierarchy process (AHP), supplier selection, vendor performance indicator (VPI)
The supplier selection process is a comprehensive decision-making technique considering several qualitative and quantitative aspects based on the manufacturer's specific requirements and the prevailing circumstances [1]. The object of this research is an enterprise specializing in producing brick replacement blocks, which are lightweight concrete materials designed to substitute traditional bricks. Brick replacement blocks are primarily manufactured using silica sand as the most often used raw material. To produce brick replacement blocks, it is vital to amass over twenty tons of sand and a diverse range of other components within 24 hours. The company sources its sand raw materials from six distinct suppliers: Supplier U, Supplier V, Supplier W, Supplier X, Supplier Y, and Supplier Z.
Due to the limited availability of raw sand materials, there is currently a shortage. The scarcity of sand raw materials leads to a decline in the quality of the raw materials these providers send. Delays then follow this in delivery, which leads to a decline in the quantity and quality of production. The company has been seeing a fluctuating decrease in the amount of production that it has been producing. It has been documented that the company has suffered a decrease to 8,000 pieces of brick replacement blocks, which is twice as much as what should be produced in a single day, which is 16,000 pieces of brick replacement blocks. More than 8,000 pieces were produced during a single shift with the production output. The production output can be lower than 7,500 pieces if it is discovered that the raw materials are of unacceptable quality. Following this constraint is a delivery schedule that is not always on time, as well as providers who are less flexible when handling customer demands.
The selection of suppliers is based on vendor performance indicators, as introduced by Adikoro and Wurjaningrum [2]. The criteria consist of (1) quality, including the quality of raw materials and warranty; (2) cost, including the price of raw materials and payment terms; (3) delivery, including accuracy of delivery time and speed; (4) flexibility, including changes in raw material quantity and delivery time; and (5) responsiveness, including the ability to respond to customer requests and provide solutions. A company has the ability to choose its suppliers of raw materials by evaluating specific criteria that are further divided into sub-criteria [3].
The manufacturing industry in Indonesia faces unique challenges in supplier selection due to geographical constraints, infrastructure limitations, and fluctuating market conditions. These challenges often exacerbate the issues highlighted in the introduction, such as raw material scarcity and delivery delays. Moreover, the diverse nature of the Indonesian manufacturing landscape, encompassing various sectors ranging from automotive to textiles, adds complexity to the supplier selection process. Therefore, understanding the specific contextual nuances of the Indonesian manufacturing sector is crucial for developing effective supplier selection strategies tailored to the local industry dynamics. By addressing these challenges, manufacturers can enhance their competitiveness and resilience in the ever-evolving marketplace.
Many studies have examined the manufacturing industry extensively, particularly emphasizing the complicated issue of selecting suppliers. Previous research has highlighted the crucial aspects of product quality, price/cost, and production capabilities [4]. The works that they have produced shed light on the complex web of issues that companies have to negotiate when selecting suppliers. The previous studies investigate the utilization of tools such as AHP and ANN and places a significant emphasis on analytical approaches as the primary focus of their investigations [5, 6]. In order to provide significant insights into the complexities of the supplier selection process, they investigate the various trade-offs between tangible and intangible elements and contribute to this discussion by highlighting the critical role that supplier selection plays in delivering high-quality products and ensuring that customers are satisfied [7, 8].
An evaluation model is needed, which includes a structured approach and a comprehensive examination of various supplier selection approaches [9]. In addition, the selection process requires a thorough review of potential suppliers. This research brings together perspectives from various researchers on this topic. It synthesizes and summarizes different techniques, providing a helpful resource for manufacturing companies navigating the complex supplier selection process [10]. In conclusion, these findings collectively demonstrate that selecting suppliers in manufacturing is a multifaceted and critical process.
Applying the AHP in supplier selection has garnered substantial support through diverse studies, affirming its efficacy in enhancing decision-making processes. AHP is a valuable tool for determining the most favorable suppliers by considering qualitative and quantitative parameters [11]. This methodology's potential was further harnessed and refined by integrating AHP with other decision-making frameworks like VIKOR [12] and PROMETHEE-2 [13]. This synergistic approach aimed to bolster the precision and robustness of the supplier selection process.
Real-world applicability has been a critical focus for researchers utilizing AHP. Previous research emphasized quality and technical aspects, underscoring their importance in supplier evaluation [14]. On the other hand, a sensitivity analysis was also conducted, offering insights into how different factors might influence supplier selection outcomes [15]. Both instances highlight the versatility of AHP in adapting to various scenarios and considerations within the supplier selection domain.
The holistic perspective of incorporating both qualitative and quantitative aspects in supplier selection has been reinforced by researchers who, recognizing the intricacies involved, proposed a model that integrates multi-analysis outcomes, providing a comprehensive framework to choose the most suitable supplier [16]. Others echoed this sentiment, emphasizing the imperative nature of considering qualitative and quantitative factors in supplier selection [17]. In essence, these studies collectively affirm that the analytic hierarchy process is a robust and versatile methodology capable of enhancing decision-making in supplier selection through its adaptability, integration with other frameworks, and consideration of a wide range of factors.
In the realm of supplier selection within the Indonesian manufacturing industry, integrating AHP for sand material procurement stands as a pivotal yet underexplored domain. A systematic literature review reveals a paucity of studies specifically addressing the application of AHP methodology for supplier selection of sand materials in this context. While existing research offers valuable insights into supplier selection processes and the application of AHP in various industries, there remains a notable gap concerning its implementation within the Indonesian manufacturing sector, particularly in procuring essential materials like sand. This underscores the significance of conducting a comprehensive review to elucidate existing methodologies and identify areas where AHP could be effectively leveraged to enhance supplier selection processes, ultimately addressing the unique needs and challenges within the Indonesian manufacturing landscape.
Furthermore, justifying the focus on this research endeavor is imperative to underscore its relevance and potential contributions. By elucidating the current gap in literature regarding the application of AHP in supplier selection for sand materials within the Indonesian manufacturing context, this study aims to bridge this void and provide actionable insights for industry practitioners and academic scholars alike. The integration of AHP methodology promises to offer a structured approach for evaluating supplier attributes and facilitating informed decision-making processes, thereby enhancing the efficiency and effectiveness of sand material procurement in Indonesian manufacturing operations. Through a meticulous synthesis of existing literature and a rigorous empirical investigation, this research endeavors to not only fill the identified gap but also advance theoretical understanding and practical applications in the domain of supplier selection analysis within the Indonesian manufacturing industry.
2.1 Block raw material stock inventory process
Brick rplacement blocks are made using silica sand, cement, lime, and a small amount of aluminium powder. The company will receive orders from customers and then make purchases by the purchasing department. Timeliness of delivery is required, as late deliveries of raw materials like silica sand can cause disruptions. As discussed in the study [18], timely delivery is a crucial supplier selection criterion, especially for JIT production systems. A shortage of stock will cause a bottleneck in one of the processes, hindering the overall production process. Conversely, stock deliveries ahead of schedule will cause a build-up of raw materials [19].
One of the most widely used raw materials is silica sand. The sand that has arrived will be tested in a laboratory. If it is too coarse, silica will be ground with a grinding machine until it reaches the required texture [20]. Silica content that is not up to specifications will cause the brick replacement block to be more brittle, heavier, and more textured. Thus, the company needs to re-treat the sand before production, emphasizing the importance of quality control in raw material acceptance [21]. Careful supplier selection and evaluation ensure that inbound materials meet specifications.
2.2 Supplier selection in supply chain management
The supplier selection process is the initial stage of the supply chain journey and has a pivotal impact on the overall success of the company's supply chain. Supplier selection is a crucial strategic choice that directly affects the supply chain’s performance [22]. The comprehensive evaluation and decision-making process in supplier selection significantly impacts the efficiency, dependability, and efficacy of the supply chain process. Selecting appropriate suppliers can greatly decrease procurement expenses and mitigate supply chain vulnerabilities [23].
The decisions made throughout the supplier selection process substantially impact subsequent stages. The process of choosing a supplier has a direct influence on supply chain collaboration activities such as order processing and delivery [24]. These decisions directly impact the company's ability to acquire and produce goods and decide its capability to meet market demands, adhere to timetables, and maintain a competitive advantage in the overall business climate [25]. Selecting a supplier is a critical step that defines how well a company's supply chain can adapt to market changes and operational challenges. The selection of a supplier has a significant influence on the ability of supply chains to effectively respond to external disruptions [26].
2.3 Vendor performance indicator (VPI)
The vendor performance indicator identifies five key criteria for supplier selection: quality, pricing, delivery, flexibility, and responsiveness [27]. Quality criteria assess the vendor's capacity to adhere to predefined standards of quality. Cost criteria pertain to the pricing of raw materials provided by suppliers. The delivery criterion evaluates the vendor's capacity to meet both the specified quantity and the designated delivery time. Flexibility requirements pertain to the supplier's capacity to meet demands for alterations in quantity and delivery time. The responsiveness criterion pertains to the supplier's capacity to promptly address customer concerns and accommodate fluctuations in demand and delivery timelines.
The evaluation and selection of suppliers based on performance indicators have been the focus of numerous studies, which have presented a range of methodologies. The Vendor Performance Index (VPI) was established in 1997. This index incorporates both quantitative and qualitative factors [28]. The importance of building collaborative ties for a prolonged duration in the selection process has been emphasized [29]. A decision-making framework known as VEPCE, which takes into account the prioritization of items and customer expectations, was developed [30]. Essential performance criteria for selecting vendors, including cost, quality, and delivery, were established during this process [30]. Principal component analysis was employed to evaluate the performance of suppliers in some studies [31]. The benefits and drawbacks of inventory management systems maintained by vendors were examined in others [32]. An analytical approach to assessing and choosing vendors, taking into account the costs associated with interactions and the performance attributes of the available options, was presented [33]. The research findings together illuminate the challenges associated with supplier selection and emphasize the importance of implementing a comprehensive approach that takes into account multiple factors.
2.4 Analytic hierarchy process (AHP)
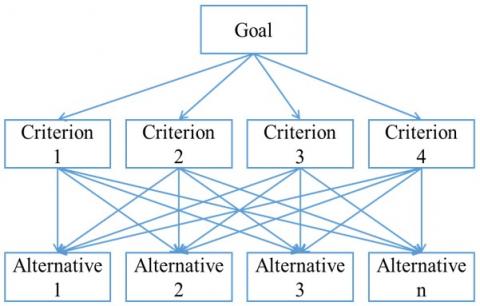
The analytic hierarchical method was established by Dr. Thomas L. Saaty at the Wharton School of Business in the 1970s. As to his statement, AHP is a decision-making technique that considers several criteria and alternatives and selects the best option by taking into account all the relevant criteria [34]. AHP is a systematic approach that utilizes a hierarchical framework to effectively address problems and facilitate decision-making. AHP employs pairwise comparisons that yield higher levels of accuracy compared to alternative assessment approaches. The AHP hierarchy allows for the decomposition of complex problems into groups, resulting in a more precise and systematic problem structure (refer to Figure 1). In implementing the AHP methodology, the first step involves creating a hierarchical structure of problems [35]. In AHP, the problem hierarchy consists of two levels: the top level, which is the objective, and the second level, which is the criteria. The current level is appropriate for evaluating options; the subsequent level is sub-criteria, and the last level is alternative solution [36].
Figure 1. AHP structure
AHP is a popular methodology used in research that focuses on selecting suppliers. Various studies have demonstrated that AHP enables the inclusion of both concrete and abstract aspects in the decision-making process. AHP is highly beneficial for small-scale manufacturing enterprises that want a method to assess and compare possible suppliers [37]. A consolidated model that merges AHP with gray relational analysis has been suggested to enhance the process of selecting suppliers [38]. Further instances illustrating the utilization of AHP in supplier selection have been presented in various studies [39, 40]. These studies focus on the application of AHP in procurement departments and university procurement, respectively. Therefore, AHP can be easily adjusted to different organizational settings while assessing suppliers.
The second step of AHP is to determine priorities. It begins by making a pairwise comparison of each criterion that is at the level above [41] (see Table 1). As stated by the pairwise comparison matrix is filled in using a Likert scale on judgment such as Table 2 [42].
Table 1. Pairwise comparison
|
.C |
.A1 |
.A2 |
.A3 |
…. |
.An |
|
.A1 |
.a11 |
.a12 |
.a13 |
.a1n |
|
|
.A2 |
.a21 |
.a22 |
.a23 |
.a2n |
|
|
.A3 |
.a31 |
.a32 |
.a33 |
.a3n |
|
|
.…. |
…. |
||||
|
.An |
.an1 |
.an2 |
.an3 |
…. |
.ann |
Table 2. Pairwise comparison rating scale
|
Scale of Importance |
Definition |
Description |
|
1 |
Equally important |
Both elements have the same influence |
|
3 |
A little more important |
Experience and judgement slightly favor one element over its partner |
|
5 |
More important |
Experience and judgement strongly favor one element over its partner |
|
7 |
Very important |
One element is highly favored and practically dominates over its mate |
|
9 |
Absolutely more important |
One element is shown to be absolutely favored over its counterpart, at the highest confidence level |
|
2,4,6,8 |
Centre value |
Given when there is judgement doubt between two adjacent judgements |
|
Opposite |
Aij = 1/Aij |
If activity gains a number when compared to activity j, then j has the opposite value compared to i |
If there are multiple informants, the geometric mean (GM) of all informant ratings is calculated to determine the entries in the comparison matrix, and the result is rounded up. The geometric mean is computed using the following formula:
$\left(\prod_{i=1}^n x_i\right)^{\frac{1}{n}}=\sqrt[n]{x_1 x_2 \ldots x_n}$ (1)
Description:
n = Number of values
xi = Values to average
According to the findings of the pairwise benchmarking, ensuring fairness in the implementation of local priorities is crucial [43]. The global priorities are obtained by executing the synthesis at each level using the pairwise comparison matrix [44]. Next, analyzing the consistency relationships involves multiplying the value in each column by the corresponding relative priority of each element [45]. The subsequent step involves summing the values in each row and then dividing the sum by the corresponding element's relative priority. Combining the quotient with the number of components results in a value referred to as λmax [45]. The formula for the Consistency Index (CI) is provided below [46].
$\mathrm{CI}=\frac{λ_{\max }-n}{n-1}$ (2)
where,
CI = Consistency Index
λmax = The largest eigenvalue of the matrix of order n
n = Number of criteria
Calculate the Consistency Ratio (CR) with the following formula:
$\mathrm{CR}=\frac{\mathrm{CI}}{\mathrm{RI}}$ (3)
Description:
CR = Consistency Ratio
CI = Consistency Index
RI = Random Index
To check the consistency of the hierarchy; the assessment data must be corrected if the value is more than 10%. The calculation results can be accepted or corrected if the consistency ratio (CI/CR) is less than or equal to 0.1 [47]. Table 3 lists the values of random consistency indices (IR).
Table 3. Random consistency index
|
n |
1 |
2 |
3 |
4 |
5 |
6 |
7 |
8 |
9 |
10 |
|
IR |
0 |
0 |
0.58 |
0.9 |
1.12 |
1.24 |
1.32 |
1.41 |
1.45 |
1.49 |
The weight or priority of each variable at level 2 (sub-criteria) for each criterion is determined by using the identical calculation. Next, the weight or priority of each variable at level 3 (alternatives) is determined by dividing the weight of each provider by each sub-criteria using the identical calculation. To select the best supplier, it can be done by calculating the global priority of each supplier by considering the weight of each sub-criteria and the weight of each supplier. The next step is determining the weight or priority of each variable at level 3 (alternative), specifically the weight of each provider in relation to each sub-criterion. Once the weights of each sub-criteria and each supplier are known, it is needed to identify the supplier that should be chosen. The overall value of each supplier is calculated by multiplying the supplier's weight by the weight of the sub-criteria and summing the results. The chosen provider possesses the utmost worth [48].
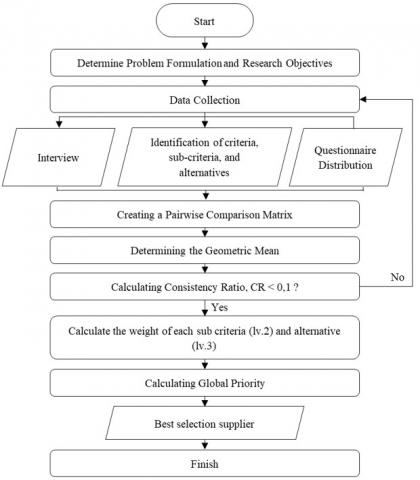
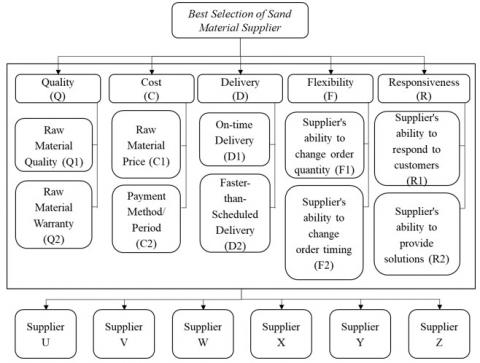
This research employs a descriptive method with a qualitative approach to comprehensively describe and discuss issues related to the analysis of supplier selection at a manufacturing enterprise. To address the research objectives, a case study is utilized to understand the problem, followed by a systematic process to derive a solution. The conceptual framework of this research is illustrated in Figure 2. In addition, since the calculation is based on the AHP, it is necessary to create a hierarchical structure that can be observed in Figure 3.
Qualitative research proves invaluable in supplier selection by offering insights beyond quantitative metrics such as pricing and delivery timelines. Open-ended interviews with supplier representatives enable procurement professionals to evaluate the supplier's culture, values, and problem-solving philosophies [49]. These techniques contribute to assessing whether a supplier will be an adaptable, communicative, and reliable long-term partner [19]. Qualitative data complements numerical data, offering the contextual background necessary for making informed judgments about which suppliers best align with an organization's needs and priorities beyond bottom-line cost savings [50]. In supplier selection research, the qualitative dimension enhances discernment, balancing the quantitative factors [51].
The researcher used eight informants selected based on the expertise of the sources in the related field. The selected speakers are managers and staff in the fields of purchasing, logistics, and production with experience working in companies. Researchers utilize primary data collected through interviews wherein questions are posed directly to the sources or via communication media [52]. The objective is to ascertain the criteria and sub-criteria employed by the company in selecting suppliers and to identify any existing problems. A questionnaire is subsequently employed, containing a series of questions with a pairwise comparison scale directed towards predefined sources as criteria for selecting suppliers. It aids in delving deeper into the investigated problem.
Figure 2. Conceptual framework
Figure 3. Hierarchical structure of the research
The data analysis technique employed in this research was descriptive qualitative, utilizing the AHP computational method [45]. Informants for the research were selected using the judgmental sampling method, specifically choosing eight individuals from departments that significantly contribute to supplier determination, including production, marketing, purchasing, and logistics [53]. For measuring alternative weights, Level 3 represents a breakdown of Level 2, consisting of sub-criteria that are then aggregated to obtain the global weight of the criteria [54]. At Level 4, the research alternatives are identified, serving as the output to determine the best supplier in this study [55, 56].
4.1 Pairwise comparison
Table 4 presents a comprehensive pairwise matrix table derived from the questionnaire distributed to informants. This table serves as a crucial tool in analyzing the relationships between various supplier selection criteria under consideration. To derive meaningful insights from this data, Excel and the Geomean formula are employed for processing. The Geomean formula, known for its effectiveness in calculating geometric means, proves instrumental in generating accurate and reliable results essential for making informed decisions regarding AHP priorities. By utilizing these computational tools, it can efficiently assess the relative importance and interdependencies among different criteria.
Table 4. Pairwise comparison of each criteria
|
Criteria |
Q |
C |
D |
F |
R |
|
Quality (Q) |
1,00 |
1,00 |
6,00 |
7,00 |
8,00 |
|
Cost (C) |
1,00 |
1,00 |
2,00 |
5,00 |
7,00 |
|
Delivery (D) |
0,17 |
0,50 |
1,00 |
2,00 |
1,00 |
|
Flexibility (F) |
0,14 |
0,20 |
0,50 |
1,00 |
1,00 |
|
Responsiveness (R) |
0,12 |
0,14 |
1,00 |
1,00 |
1,00 |
Pairwise comparisons of sub-criteria on each criterion were obtained from questionnaires distributed to informants. The data is processed with the Geomean formula to get the appropriate results, as shown in Table 5.
Table 5. Pairwise comparison of each sub-criteria
|
Quality (Q) |
Q1 |
Q2 |
|
Raw Material Quality (Q1) |
1,00 |
2,00 |
|
Raw Material Warranty (Q2) |
0,50 |
1,00 |
|
Cost (C) |
C1 |
C2 |
|
Raw Material Price (C1) |
1,00 |
5,00 |
|
Payment Method/Period (C2) |
0,20 |
1,00 |
|
Delivery (D) |
D1 |
D2 |
|
On-time Delivery (D1) |
1,00 |
3,00 |
|
Faster-than-Scheduled Delivery (D2) |
0,33 |
1,00 |
|
Flexibility (F) |
F1 |
F2 |
|
Supplier's ability to change order quantity (F1) |
1,00 |
1,00 |
|
Supplier's ability to change order timing (F2) |
1,00 |
1,00 |
|
Responsiveness (R) |
R1 |
R2 |
|
Supplier's ability to respond to customers (R1) |
1,00 |
2,00 |
|
Supplier's ability to provide solutions (R2) |
0,50 |
1,00 |
4.2 Testing the consistency ratio
This test is performed to determine whether the data is consistent. A pairwise comparison matrix is called consistent if its value is below 0.1 (CR ≤ 0.1 = consistent). The CI/RI formula is used to determine the consistency ratio value. From Table 6, the consistency ratio value of the criteria (Level 1) is 0.036, which means that the judgment data is consistent or acceptable. Moreover, it is known that the consistency ratio value of each sub-criteria is 0. Therefore, the pairwise comparison data is consistent or acceptable.
Table 6. Consistency ratio of criteria/sub-criteria
|
Criteria/Sub-Criteria |
CR |
CR ≤ 0.1 |
|
Criteria Level 1 |
3.6% |
Consistent |
|
Raw Material Quality (Q1) |
0.0% |
Consistent |
|
Raw Material Warranty (Q2) |
0.0% |
Consistent |
|
Raw Material Price (C1) |
0.0% |
Consistent |
|
Payment Method/Period (C2) |
0.0% |
Consistent |
|
On-time Delivery (D1) |
0.0% |
Consistent |
|
Faster-than-Scheduled Delivery (D2) |
0.0% |
Consistent |
|
Supplier's ability to change order quantity (F1) |
0.0% |
Consistent |
|
Supplier's ability to change order timing (F2) |
0.0% |
Consistent |
|
Supplier's ability to respond to customers (R1) |
0.0% |
Consistent |
|
Supplier's ability to provide solutions (R2) |
0.0% |
Consistent |
4.3 The weighting of each criteria
In the final results of supplier selection data processing, priority weights are obtained for each criterion. The priority results can be seen in the following Table 7.
Table 7. Resulting weights for the criteria
|
Criteria |
Priority |
Rank |
|
Quality |
0.445 |
1 |
|
Cost |
0.332 |
2 |
|
Delivery |
0.101 |
3 |
|
Flexibility |
0.059 |
5 |
|
Responsiveness |
0.063 |
4 |
Based on Table 7, it can be inferred that quality is the primary criterion, with a weight of 0.445. It is followed by cost with a weight of 0.332, delivery with a weight of 0.101, flexibility with a weight of 0.059, and responsibility with a weight of 0.063, which is the lowest. Hence, the emphasis is placed on prioritizing quality standards rather than focusing on cost, delivery, flexibility, and responsiveness.
4.4 The weighting of each sub-criteria
In Table 8, the assigned weights to each criterion and sub-criterion provide valuable insights into the company's priorities in the supplier selection process. Let us delve deeper into the interpretation and implications of these weights:
The substantial weight (0.296) assigned to raw material quality indicates its critical importance in ensuring high-quality production of brick replacement blocks. This suggests that the company prioritizes suppliers offering superior quality raw materials, recognizing the direct impact of inputs on the final product's quality. Conversely, the relatively lower weight (0.148) assigned to raw material warranty suggests that while warranties are considered, they are not as crucial as the actual quality of the raw materials. This indicates a proactive approach to prevent quality issues rather than relying solely on warranties for resolution.
With a weight of 0.276, the cost of primary resources is deemed significant, reflecting the company's cost-conscious approach. This implies a preference for suppliers offering competitive pricing for their raw materials. Additionally, the weight of 0.055 assigned to payment terms emphasizes the importance of favorable payment conditions. This indicates the company's focus on optimizing financial resources and managing cash flow effectively.
The weight of 0.075 for on-time delivery underscores the critical importance of timely deliveries in maintaining production efficiency and meeting customer demands. Late deliveries can disrupt production schedules and lead to inventory shortages. Moreover, the weight of 0.025 for delivering ahead of schedule suggests recognition for suppliers who exceed expectations by providing early deliveries, contributing to enhanced operational flexibility.
Both the supplier's capacity to modify order quantity and order time carry equal weights of 0.029. This indicates the company's emphasis on suppliers who can adapt to changes in demand or production schedules promptly. This flexibility is essential for responding to market fluctuations and optimizing inventory management effectively.
The weight of 0.042 for supplier responsiveness to customer requirements highlights the importance of collaborative and responsive supplier relationships. Suppliers who can address customer needs promptly contribute to enhanced supply chain agility and customer satisfaction. The lower weight of 0.021 for the supplier's capability to offer solutions suggests that while valued, innovative solutions are less critical than responsiveness. This indicates a focus on timely communication and problem-solving abilities in supplier partnerships.
Table 8. Resulting weights for the sub-criteria
|
Criteria |
Weight (Lv. 1) |
Sub-Criteria |
Weight (Lv. 2) |
Weight (Lv. 1 x 2) |
Rank |
|
Quality |
44.50% |
Raw material quality |
66.70% |
29.68% |
1 |
|
Raw material warranty |
33.30% |
14.82% |
3 |
||
|
Cost |
33.20% |
Raw material price |
83.30% |
27.66% |
2 |
|
Payment method/period |
16.70% |
5.54% |
5 |
||
|
Delivery |
10.10% |
On-time delivery |
75.00% |
7.58% |
4 |
|
Faster-than-scheduled delivery |
25.00% |
2.53% |
9 |
||
|
Flexibility |
5.90% |
Supplier's ability to change order quantity |
50.00% |
2.95% |
7 |
|
Supplier's ability to change order timing |
50.00% |
2.95% |
7 |
||
|
Responsiveness |
6.30% |
Supplier's ability to respond to customers |
66.70% |
4.20% |
6 |
|
Supplier's ability to provide solutions |
33.30% |
2.10% |
10 |
Table 9. Resulting global weight of each supplier
|
Indicator |
Supplier U |
Supplier V |
Supplier W |
Supplier X |
Supplier Y |
Supplier Z |
|
Raw Material Quality (Q1) |
0.066 |
0.097 |
0.058 |
0.037 |
0.015 |
0.023 |
|
Raw Material Warranty (Q2) |
0.033 |
0.048 |
0.029 |
0.018 |
0.008 |
0.011 |
|
Raw Material Price (C1) |
0.062 |
0.090 |
0.054 |
0.034 |
0.014 |
0.021 |
|
Payment Method/Period (C2) |
0.012 |
0.018 |
0.011 |
0.007 |
0.003 |
0.004 |
|
On-time Delivery (D1) |
0.017 |
0.025 |
0.015 |
0.009 |
0.004 |
0.006 |
|
Faster-than-Scheduled Delivery (D2) |
0.006 |
0.008 |
0.005 |
0.003 |
0.001 |
0.002 |
|
Supplier's ability to change order quantity (F1) |
0.007 |
0.010 |
0.006 |
0.004 |
0.002 |
0.002 |
|
Supplier's ability to change order timing (F2) |
0.007 |
0.010 |
0.006 |
0.004 |
0.002 |
0.002 |
|
Supplier's ability to respond to customers (R1) |
0.009 |
0.014 |
0.008 |
0.005 |
0.002 |
0.003 |
|
Supplier's ability to provide solutions (R2) |
0.005 |
0.007 |
0.004 |
0.003 |
0.001 |
0.002 |
|
Subtotal |
0.224 |
0.327 |
0.197 |
0.123 |
0.052 |
0.077 |
|
Rank |
2 |
1 |
3 |
4 |
6 |
5 |
4.5 The global weight of each supplier
In Table 9, the global weight of each supplier per criterion is obtained. The order of suppliers from the best choice according to AHP priority is V-U-W-X-Z-Y. The global weight of each supplier per criterion is obtained. Supplier U has an alternative global weight of 0.224, Supplier V has an alternative global weight of 0.327, Supplier W has an alternative global weight of 0.197, Supplier X has an alternative global weight of 0.123, Supplier Y has an alternative global weight of 0.052, Supplier Z has an alternative global weight of 0.077. From this weighting, it can be concluded that the best supplier of sand raw material at for the enterprise is Supplier U.
Based on the research results and data processing conducted by the researchers, several key findings regarding supplier selection criteria at a manufacturing enterprise have emerged. Quality is the most significant criterion with a weight of 0.33, further divided into sub-criteria such as raw material quality (0.293) and raw material guarantee (0.041). The cost criterion is weighted at 0.24, including raw material price (0.2) and raw material payment method/time (0.039). Delivery holds a weight of 0.188, encompassing on-time delivery (0.158) and early delivery (0.030). Flexibility is weighted at 0.141, with sub-criteria including the supplier's ability to meet requests for changes in order quantity (0.12) and order time (0.21). Responsiveness, with a weight of 0.099, includes the supplier's ability to respond to customer requests (0.85) and offer solutions to customer problems (0.13).
Using the AHP method, pairwise comparison formulas, the geometric mean, and the eigenvector method, the researchers calculated these weights. The alternative local weights of the suppliers were determined as follows: supplier U (0.0368), supplier V (0.249), supplier W (0.0159), supplier X (0.114), supplier Y (0.0067), and supplier Z (0.0043). The global weights were supplier U (0.028), supplier V (0.020), supplier W (0.013), supplier X (0.011), supplier Y (0.007), and supplier Z (0.004).
From these findings, it is recommended that the enterprise closely monitors the performance and development of each supplier, particularly in light of the unpredictable availability of sand raw materials. If the primary supplier faces challenges in delivering raw materials on time, evaluating alternative suppliers becomes crucial.
For future research, it is suggested to expand the criteria set to include additional factors such as environmental impact, sustainability practices, and technological capabilities, which would provide a more comprehensive supplier evaluation. Longitudinal studies should be conducted to assess how supplier performance evolves over time and the long-term impact of supplier selection decisions on company operations. Additionally, similar studies in different sectors of the manufacturing industry could help understand the variability in supplier selection criteria and their respective weights across industries. Integrating advanced analytics and machine learning techniques could further enhance the accuracy of predicting supplier performance and identifying risk factors.
The practical implications of this research offer valuable guidance for manufacturing companies in enhancing their supplier selection process using the analytic hierarchy process (AHP). Firstly, companies can prioritize criteria and sub-criteria based on the determined weights from this study to identify the most critical factors in supplier selection. For instance, recognizing the significant weight assigned to raw material quality, companies can prioritize the evaluation of raw material quality from each supplier. Secondly, companies can customize the weights of criteria and sub-criteria according to their specific needs and preferences. If a company faces challenges related to costs, for instance, it can allocate higher weights to cost-related criteria and payment terms.
Furthermore, utilizing the AHP approach allows companies to make more informed and directed decisions in supplier selection by considering the assigned weights to each criterion. They can evaluate potential suppliers based on prioritized criteria according to their weights. Additionally, the AHP process enables continuous evaluation and improvement of the supplier selection process. By monitoring supplier performance regularly and updating criteria weights in line with changing needs and market conditions, companies can ensure the effectiveness and efficiency of their supplier selection process. Ultimately, implementing these guidelines empowers manufacturing companies to effectively utilize the AHP approach in improving their supplier selection process, leading to sustained benefits for their overall operations and business performance.
[1] Garg, R.K. (2021). Structural equation modeling of E-supplier selection criteria in mechanical manufacturing industries. Journal of Cleaner Production, 311: 127597. https://doi.org/10.1016/j.jclepro.2021.127597
[2] Adikoro, H.T., Wurjaningrum, F. (2022). Analisis pemilihan supplier kain Byemi Official Store dengan metode fuzzy AHP dan fuzzy TOPSIS. Jurnal Manajemen dan Perbankan, 9(2): 38-53.
[3] Andika, D., Anggraeni, S.K., Sirajuddin, S. (2013). Usulan pemilihan supplier bahan baku tetap menggunakan vendor performance indicator dan analytical hierarchy process (AHP). Journal Teknik Industri, 1(2): 128-132.
[4] Hassanzadeh, S., Cheng, K. (2016). Suppliers selection in manufacturing industries and associated multi-objective decision making methods: Past, present and the future. European Scientific Journal, 12(1): 93. http://doi.org/10.19044/esj.2016.v12n1p93
[5] Lakshmanpriya, C., Sangeetha, N., Lavanpriya, C. (2013). Vendor selection in manufacturing industry using AHP and ANN. The SIJ Transactions on Industrial, Financial & Business Management, 1(1): 29-34.
[6] Tahriri, F., Osman, M.R., Ali, A., Yusuff, R.M. (2008). A review of supplier selection methods in manufacturing industries. Suranaree Journal of Science and Technology.
[7] González, M.E., Quesada, G., Mora Monge, C.A. (2004). Determining the importance of the supplier selection process in manufacturing: A case study. International Journal of Physical Distribution & Logistics Management, 34(6): 492-504. https://doi.org/10.1108/09600030410545415
[8] Pal, O., Gupta, A.K., Garg, R.K. (2013). Supplier selection criteria and methods in supply chains: A review. International Journal of Economics and Management Engineering, 7(10): 2667-2673.
[9] Bei, W., Wang, S., Hu, J. (2006). An analysis of supplier selection in manufacturing supply chain management. In 2006 International Conference on Service Systems and Service Management, Troyes, France, 2: 1439-1444. https://doi.org/10.1109/ICSSSM.2006.320724
[10] Pateriya, A., Verma, D.S. (2013). Supplier selection methods for small scale manufacturing industry: A Review. International Journal of Science and Research (IJSR), 2: 319-322.
[11] Tahriri, F., Osman, M.R., Ali, A., Yusuff, R., Esfandiary, A. (2008). AHP approach for supplier evaluation and selection in a steel manufacturing company. Journal of Industrial Engineering and Management (JIEM), 1(2): 54-76. https://doi.org/10.3926/jiem.2008.v1in2.p54-76
[12] Prasad, K.D., Prasad, M., Rao, S.B., Patro, C.S. (2016). Supplier selection through AHP-VIKOR integrated methodology. SSRG International Journal of Industrial Engineering, 3(5): 1-6.
[13] Shakey, B.K. (2012). Supplier selection using AHP and PROMETHEE-2. International Journal of Scientific Research, 2(6): 156-160.
[14] Garoma, T., Diriba, S. (2014). Modeling and analysis of supplier selection method using analytical hierarchy process (AHP). Science, Technology and Arts Research Journal, 3(1), 145-151. https://doi.org/10.4314/star.v3i1.24
[15] Bayazit, O., Karpak, B. (2005). An AHP application in vendor selection. In ISAHP 2005, Honolulu, Hawaii, pp. 1-24.
[16] Hwang, H.S., Moon, C., Chuang, C.L., Goan, M.J. (2005). Supplier selection and planning model using AHP. International Journal of the Information Systems for Logistics and Management, 1(1): 47-53.
[17] Hruška, R., Průša, P., Babić, D. (2014). The use of AHP method for selection of supplier. Transport, 29(2): 195-203. https://doi.org/10.3846/16484142.2014.930928
[18] Wang, C.N., Dang, D.C., Vu, Q.Q., Zeng, Y.X. (2018). Supplier selection for manufacturing industries. In 2018 IEEE International Conference on Advanced Manufacturing (ICAM), Yunlin, Taiwan, pp. 268-271. https://doi.org/10.1109/AMCON.2018.8614833
[19] Luo, X., Wu, C., Rosenberg, D., Barnes, D. (2009). Supplier selection in agile supply chains: An information-processing model and an illustration. Journal of Purchasing and Supply Management, 15: 249-262. https://doi.org/10.1016/j.pursup.2009.05.004
[20] Kannan, D., Khodaverdi, R., Olfat, L., Jafarian, A., Diabat, A. (2013). Integrated fuzzy multi criteria decision making method and multi-objective programming approach for supplier selection and order allocation in a green supply chain. Journal of Cleaner Production, 47: 355-367. https://doi.org/10.1016/j.jclepro.2013.02.010
[21] Gosling, J., Naim, M., Towill, D. (2013). A supply chain flexibility framework for engineer-to-order systems. Production Planning & Control, 24(7): 552-566. https://doi.org/10.1080/09537287.2012.659843
[22] Chai, J., Liu, J.N.K., Ngai, E.W.T. (2013). Application of decision-making techniques in supplier selection: A systematic review of literature. Expert Systems with Applications, 40(10): 3872-3885. https://doi.org/10.1016/j.eswa.2012.12.040
[23] Govindan, K., Rajendran, S., Sarkis, J., Murugesan, P. (2015). Multi criteria decision making approaches for green supplier evaluation and selection: A literature review. Journal of Cleaner Production, 98: 66-83. https://doi.org/10.1016/j.jclepro.2013.06.046
[24] Olson, D.L., Wu, D. (2023). Enterprise risk management in supply chains. In Enterprise Risk Management Models: Focus on Sustainability, pp. 1-14. https://doi.org/10.1007/978-3-662-60608-7_1
[25] Bai, C., Sarkis, J. (2010). Integrating sustainability into supplier selection with grey system and rough set methodologies. International Journal of Production Economics, 124(1): 252-264. https://doi.org/10.1016/j.ijpe.2009.11.023
[26] Hald, K., Ellegaard, C. (2011). Supplier evaluation processes: The shaping and reshaping of supplier performance. International Journal of Operations & Production Management, 31: 888-910. https://doi.org/10.1108/01443571111153085
[27] Li, C.C., Fun, Y.P., Hung, J.S. (1997). A New measure for supplier performance evaluation. IIE Transactions, 29(9): 753-758. https://doi.org/10.1023/A:1018538505716
[28] Wang, M., Zhong, W. (2009). The manufacturing enterprise supplier performance evaluation indicator selection under e-procurement. In 2009 International Conference on Electronic Commerce and Business Intelligence, Beijing, China, pp. 7-11. https://doi.org/10.1109/ECBI.2009.11
[29] Rajan, A.J., Rao, K.S., Ganesh, K. (2007). VEPCE: Decision-making model for vendor evaluation with respect to product prioritisation and customer expectation. International Journal of Logistics Systems and Management, 3(1): 34. https://doi.org/10.1504/IJLSM.2007.012069
[30] Imeri, S. (2013). Key performance criteria for vendor selection–A literature review. Management Research and Practice, 5(2): 75-75. https://api.semanticscholar.org/CorpusID:167560289.
[31] Lee, J.Y., Ren, L. (2011). Vendor-managed inventory in a global environment with exchange rate uncertainty. International Journal of Production Economics, 130(2): 169-174. https://doi.org/10.1016/j.ijpe.2010.12.006
[32] Choi, K.S., Dai, J.G., Song, J.S. (2004). On measuring supplier performance under vendor-managed-inventory programs in capacitated supply chains. Manufacturing & Service Operations Management, 6(1): 53-72. https://doi.org/10.1287/msom.1030.0029
[33] Abdel-Malek, L., Areeratchakul, N. (2004). An analytical approach for evaluating and selecting vendors with interdependent performance in a supply chain. International Journal of Integrated Supply Management, 1(1): 64. https://doi.org/10.1504/IJISM.2004.004598
[34] Sulaiman, W., Karimi, H., Mustafa, Y. (2021). A GIS-based AHP method for groundwater potential zone assessment: A review. Journal of Geoinformatics & Environmental Research, 2(2): 86-91. https://doi.org/10.38094/jgier2237
[35] Brin, P., Nehme, M. (2021). Sustainable development in emerging economy: Using the analytical hierarchy process for corporate social responsibility decision making. Journal of Information Technology Management, 13: 159-174. https://doi.org/10.22059/JITM.2021.80744
[36] Tavana, M., Soltanifar, M., Santos-Arteaga, F.J. (2023). Analytical hierarchy process: Revolution and evolution. Annals of Operations Research, 326(2): 879-907. https://doi.org/10.1007/s10479-021-04432-2
[37] Verma, D.S., Pateriya, A. (2013). Supplier selection through analytical hierarchy process: A case study in small scale manufacturing organization. International Journal of Engineering Trends and Technology, 4(5): 1428-1433.
[38] Hu, Y. (2009). Supplier selection based on analytic hierarchy process and grey relational analysis. In 2009 ISECS International Colloquium on Computing, Communication, Control, and Management, Sanya, China, pp. 607-610. https://doi.org/10.1109/CCCM.2009.5267499
[39] Siregar, M.L., Suparno, S. (2021). Selecting the best supplier in procurement section (Goods Spot Purchase)-departement SCM with analytical hierarchy process (AHP) method. IPTEK Journal of Proceedings Series, (6): 504-508. https://doi.org/10.12962/j23546026.y2020i6.11151
[40] Rouyendegh, B.D., Erkan, T.E. (2012). Selecting the best supplier using analytic hierarchy process (AHP) method. African Journal of Business Management, 6(4): 1455. https://doi.org/10.5897/AJBM11.2009
[41] Abastante, F., Corrente, S., Greco, S., Ishizaka, A., Lami, I.M. (2019). A new parsimonious AHP methodology: Assigning priorities to many objects by comparing pairwise few reference objects. Expert Systems with Applications, 127: 109-120. https://doi.org/10.1016/j.eswa.2019.02.036
[42] Ogrodnik, K., Kolendo, Ł. (2021). Application of GIS technology and AHP to determine the areas with fully developed, compact functional and spatial structure: A case study of Bialystok, Poland. Land Use Policy, 109: 105616. https://doi.org/10.1016/j.landusepol.2021.105616
[43] Saaty, R.W. (1987). The analytic hierarchy process—What it is and how it is used. Mathematical Modelling, 9(3-5): 161-176. https://doi.org/10.1016/0270-0255(87)90473-8
[44] Saaty, T.L., Xu, S. (1990). Recent developments in the analytic hierarchy process. Addendum Multicriteria Decision Making, TL Saaty, University of Pittsburgh, RWS Publications, A153-A174.
[45] Saaty, T.L. (2008). Decision making with the analytic hierarchy process. International Journal of Services Sciences, 1(1): 83. https://doi.org/10.1504/IJSSCI.2008.017590
[46] Alonso, J.A., Lamata, M.T. (2006). Consistency in the analytic hierarchy process: A new approach. International Journal of Uncertainty, Fuzziness and Knowledge-Based Systems, 14(4): 445-459. https://doi.org/10.1142/S0218488506004114
[47] Pant, S., Kumar, A., Ram, M., Klochkov, Y., Sharma, H.K. (2022). Consistency indices in analytic hierarchy process: A review. Mathematics, 10(8): 1206. https://doi.org/10.3390/math10081206
[48] Razi, P., Ali, M.I., Ramli, N.I. (2019). AHP-based analysis of the risk assessment delay case study of public road construction project: An empirical study. Journal of Engineering Science and Technology, 14: 875-891.
[49] Nyamasege, O.J., Biraori, O.E. (2015). Effect of supplier relationship management on the effectiveness of supply chain management in the Kenya public sector. International Journal of Managing Value and Supply Chains, 6(1): 25-32. https://doi.org/10.5121/ijmvsc.2015.6103
[50] Quayle, M. (2002). Purchasing in small firms. European Journal of Purchasing & Supply Management, 8(3): 151-159. https://doi.org/10.1016/S0969-7012(02)00005-9
[51] Ellram, L.M. (1990). The supplier selection decision in strategic partnerships. Journal of Purchasing and Materials Management, 26(4): 8-14. Retrieved from https://doi.org/10.1111/j.1745-493X.1990.tb00515.x
[52] Creswell, J.W. (2017). Research Design: Qualitative, Quantitative, and Mixed Methods Approaches (4th ed.). Sage.
[53] Etikan, I. (2016). Comparison of convenience sampling and purposive sampling. American Journal of Theoretical and Applied Statistics, 5(1): 1. https://doi.org/10.11648/j.ajtas.20160501.11
[54] Bhutta, K.S., Huq, F. (2002). Supplier selection problem: A comparison of the total cost of ownership and analytic hierarchy process approaches. Supply Chain Management: An International Journal, 7(3): 126-135. https://doi.org/10.1108/13598540210436586
[55] de Boer, L., Labro, E., Morlacchi, P. (2001). A review of methods supporting supplier selection. European Journal of Purchasing & Supply Management, 7(2): 75-89. https://doi.org/10.1016/S0969-7012(00)00028-9
[56] Chowdhury, M.N., Shafi, S., Arzaman, A.F.M., Teoh, B.A., Kadhim, K.A., Xuan, A.N.S. (2024). Navigating human factors in maritime safety: A review of risks and improvements in engine rooms of ocean-going vessels. International Journal of Safety & Security Engineering, 14(1): 1-14. https://doi.org/10.18280/ijsse.140101