Methaq Azeez Jouda![]() | Mushtak A. K. Shiker*
| Mushtak A. K. Shiker*![]()
© 2024 The authors. This article is published by IIETA and is licensed under the CC BY 4.0 license (http://creativecommons.org/licenses/by/4.0/).
OPEN ACCESS
House construction projects, known for their critical importance and complexity, often face significant constraints related to cost and time. These constraints necessitate the use of robust project management techniques to ensure timely and within-budget completion. This study presents an analysis of key project management methodologies, specifically the critical path method (CPM) and program evaluation and review technique (PERT), in the context of a house construction project. The methodologies employed include the identification of the earliest start and latest finish times, along with forward and backward passes to determine the project's critical path. A comparative analysis of CPM and PERT was conducted, revealing a minor variance of just two days between the two methods in determining project completion. The probability of completing the house construction project within 105 days was calculated to be 74.54%, indicating that both CPM and PERT are effective in ensuring timely project completion. The findings underscore the efficacy and practical benefits of employing CPM and PERT techniques in managing construction projects.
activities, critical path method, CPM, project management, review technology, PERT
Managing projects requiring multiple activities is one of the most challenging tasks a manager can take on. There are many factors to consider when coordinating these tasks, including setting a realistic timeline, monitoring project progress, and more [1]. Project management focuses on determining the project duration and related major tasks, and there are two main methods that have been helpful for planning and scheduling engineering projects: CPM and PERT [2].
A critical activity is defined as one in which the oldest and most recent times are the same. A project network may have more than one critical path [3]. CPM and PERT were initially created to plan construction, analyze the project, and propose related tasks. The project is accomplished by utilizing a system of interconnected and similar events to coordinate the optimal sum and period parameters [4]. So, they are handy and essential tools to manage all types of projects effectively; on the other hand, delays in the building and construction process are a global problem. Using CPM/PERT to manage construction projects facilitates the ability to supervise large projects that involve a lot of coordination of activities, which is one of the most challenging things a manager can do [5].
Structurally, planning is imperative because it determines the timing and order of several steps and the linkage between activities. People can define this critical duty and maintain control of the construction project using CPM and PERT [6, 7].
Employing cost engineering based on expertise and experience can accurately predict the time required for various tasks during project implementation by looking at previous projects. Uncertainty can also move the calendar chart. Since hesitation cannot be avoided entirely in projects [8], a technique that can reduce improbability may be needed, namely PERT. Starting from the former, PERT agrees to determine event duration estimates using three-time estimates (optimistic, almost inevitable, and adverse), taking into account the uncertainty present in the duration. These three estimates are used to calculate the expected time for the activity. The range between optimistic and pessimistic estimates is a measure of variance that allows statistical inferences about the probability of an event occurring in the project at a given time [9].
However, users may experience some advantages when applying BERT, which uses empirical distributions and requires sufficient temporal data to make estimates more accurate. Therefore, in a house building project, CPM is applied to know the critical path, and PERT is applied, where the time rate calculation equation is applied and the last start and end of the house construction project activities are calculated. The critical path will be calculated, the differences will be noted, and the results between CPM and PERT will be compared and evaluated, as well as how they differ from systematic data collection and analysis [10, 11].
CPM evaluates the plan manager's contribution to confirm project plan performance through a realistic review. The only way to quickly estimate how long it will take to complete a project is to calculate the cost of each operation [12, 13].
The time estimate used in the calculation refers to the typical time and trade-off between completion time and project cost [14]. This project can be completed in two dissimilar ways, ahead and passing the ball back. Frontal advance is controlled using the following formula [15, 16]:
$X_i=\operatorname{Max}_j\left\{X_i+Z_{i j}\right\}$ (1)
Forward calculation starts from scratch event to terminate event, set opening event is zero. i.e. $X i=0$
Including [17]:
$X_j=L A_j-Z_{i j}$ (2)
where,
Xi: The first recorded activity.
Xj: The most recent initiation.
Zj: The amount of time needed to do a task.
LAj: The earliest time a task is finished.
According to the frontward pass calculation, the initial and latest possible times of completion of the activity are found from the backward pass calculations using the formulation given below [18]:
$L A_j=\operatorname{Min}_j\left\{L A_j-Z_{i j}\right\}$ (3)
Project evaluation and testing techniques are economical for planning and controlling projects [19]. PERT is one of them, the purpose of which is to study project networks, not to create schedules. In application, PERT uses three-time estimates, optimistic, most likely, and pessimistic, about dealing with duration uncertainty. Favorable time is the minimum time for an activity, most likely when an activity occurs most frequently when repeated, and pessimistic time is the maximum time for an activity. The three estimates are related in a beta probability distribution, where the parameters a and b represent the end and start points, and m is the most common value [20]. The beta distribution is used because it is unimodal (it has one peak) and not necessarily symmetric, properties that seem ideal for activity duration distributions [21].
PERT is also known as a retrospective research technique. This technique uses time as a variable in planning, organizing, coordinating, and controlling unsafe activities and performance specifications.
PERT calculations support assigning task completion time probabilities based on time for optimism (F), time for likelihood (M), and pessimistic time (S). Use PERT to determine the activity values required for the critical path to include a slack account [22, 23].
In the PERT method, activity time can have flexibility, the most common being complete floats (TF) and free floats (FF), which are the crucial route with floats with values equal to zero. That is, TF = 0 and FF = 0, which can be obtained from the equations bellow [24]:
$T F=L A_j-X_i-Z_{i j}$ (4)
$F F=X_j-X_i-Z_{i j}$ (5)
The following formula applies to the variance (V) and mean time $\left(\mu_T\right)$:
$\mu_T=\frac{F+4 M+S}{6}$ (6)
$V=\left(\frac{S-F}{6}\right)^2$ (7)
Given the parameters (α, β), it follows a beta distribution. Temporal forecasting and the probability of using the PERT completion time for construction work are also included in the calculation. The standard model for beta is as follows [25]:
$\mathrm{Z}=\frac{\left(\mathrm{X}-\sum \mu_{\mathrm{T}_{\text {critical }}}\right)}{\sqrt{\mathrm{V}_{\text {critical }}}}$ (8)
where:
X = Overall project duration (CPM).
Z = Compared with tabulated normal distribution.
$\sum \mu_{T_{\text {critical }}}$ = Calculation of the total sum of anticipated critical values.
$V_{\text {critical }}$ = Aggregate of all variances essential task.
3.1 Methodology and data collection
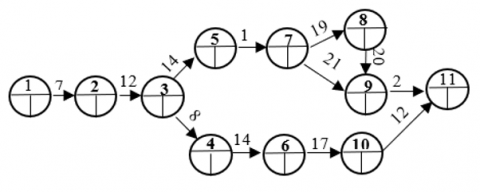
The data contained therein is specific to a house-building project. For the building project, the house has 11 activities and stages; the earliest start and end times are set for each activity. The duration of each activity was determined based on the secondary data presented in Table 1 [26]. The data in this study were analyzed using CPM and PERT methods. They are collected as shown in Table 1, so the results are compared to determine the best way to determine when a home construction project will be completed. Table 1 represents the activities and phases of a home construction project, duration calculation, optimistic and pessimistic estimates (a, b) and their precursors [27].
Note: the project is a hypothetical example.
Table 1. The steps and activities involved in building a house
|
Activity |
The Period in Days |
The Min and Max Time Allowed in Days (a, b) |
Precedence Relationship |
|
1-2 |
7 |
4,10 |
- |
|
2-3 |
12 |
10,14 |
1 |
|
3-4 |
8 |
5,11 |
2 |
|
3-5 |
14 |
13,15 |
2 |
|
4-6 |
14 |
12,16 |
3 |
|
5-7 |
12 |
8,16 |
3 |
|
7-8 |
19 |
12,20 |
5 |
|
7-9 |
21 |
15,22 |
5 |
|
8-9 |
20 |
16,26 |
7 |
|
6-10 |
17 |
16,24 |
4 |
|
9-11 |
21 |
15,22 |
8,7 |
|
10-11 |
12 |
10,14 |
6 |
The network diagram in Figure 1 represents the data in Table 1.
Figure 1. Network diagram with most likely estimates (M)
3.2 Analyze data using CPM
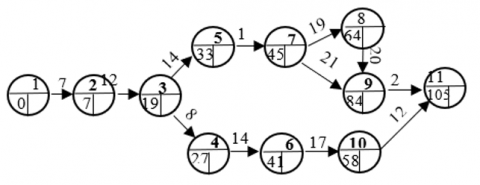
The forward pass is calculated using Eq. (1). The time required to complete the project using CPM is 105 days, as shown in Table 2.
Table 2. Forward pass computation (CPM)
|
Activity |
The Event Immediately Preceding It |
Period in Days |
Closest Activity Time |
The Sum |
|
1 |
- |
- |
0 |
0 |
|
2 |
1 |
7 |
0+7 |
7 |
|
3 |
2 |
12 |
7+12 |
19 |
|
4 |
3 |
8 |
19+8 |
27 |
|
5 |
3 |
14 |
19+14 |
33 |
|
6 |
4 |
14 |
27+14 |
41 |
|
7 |
5 |
12 |
33+12 |
45 |
|
8 |
7 |
19 |
45+19 |
64 |
|
9 |
8,7 |
20,21 |
64+20,45+21 |
84 |
|
10 |
6 |
17 |
41+17 |
58 |
|
11 |
10,9 |
12,21 |
58+12,84+21 |
105 |
The construction project requires an entire amount of time. One hundred five days, as shown in column 5 and row 11 thereof, according to the network schematic of the forward pass calculation CPM shown in Figure 2, we have three paths to finish the project by the CPM, and using Eq. (1), the critical path is (1-2-3-5-7-8-9-11):
Figure 2. Network diagram of the front-end calculation process using the CPM
3.3 Analyze data using the PERT method
There are three-time estimates in the table [28]. This is summed up in Table 3.
A schematic of the onward pass calculation of PERT is shown in Figure 3.
It is clear to us from the method of calculating the forward pass (CPM) and the reverse pass (PERT) that the critical path includes activities with a difference between early time and late time equal to 0, as shown in Table 4.
Using PERT, we have three-time estimates; for these time estimates, the mean and variance are calculated using Eqs. (6) and (7) respectively, as shown in Table 5.
Table 3. Backward pass computation PERT method
|
Activity |
The Event Immediately Preceding It |
Period in Days |
Last Activity Time |
Min |
|
11 |
- |
- |
105 |
105 |
|
10 |
11 |
12 |
105-12 |
93 |
|
9 |
11 |
21 |
105-21 |
84 |
|
8 |
9 |
20 |
84-20 |
64 |
|
7 |
8,9 |
19,22 |
64-19,84-22 |
45 |
|
6 |
10 |
17 |
93-17 |
76 |
|
5 |
7 |
12 |
45-12 |
33 |
|
4 |
6 |
14 |
76-14 |
62 |
|
3 |
4,5 |
8,14 |
62-8,33-14 |
19 |
|
2 |
3 |
12 |
19-12 |
7 |
|
1 |
2 |
7 |
7-7 |
0 |
Figure 3. Network diagram using inverse arithmetic with CPM
Table 4. The difference between late time and early time
|
Activity |
Late Time |
Early Time |
The Difference |
|
1 |
0 |
0 |
0 |
|
2 |
7 |
7 |
0 |
|
3 |
19 |
19 |
0 |
|
4 |
62 |
27 |
35 |
|
5 |
33 |
33 |
0 |
|
6 |
76 |
41 |
35 |
|
7 |
45 |
45 |
0 |
|
8 |
64 |
64 |
0 |
|
9 |
84 |
84 |
0 |
|
10 |
93 |
58 |
35 |
|
11 |
105 |
105 |
0 |
Table 5. Mean and variance
|
Paths |
F Time |
M Time |
S Time |
Mean |
Var |
|
1-2 |
4 |
7 |
10 |
7 |
1 |
|
2-3 |
10 |
12 |
14 |
12 |
0.444 |
|
3-4 |
5 |
8 |
11 |
8 |
1 |
|
3-5 |
13 |
14 |
15 |
14 |
0.111 |
|
4-6 |
10 |
13 |
16 |
13 |
1 |
|
5-7 |
8 |
12 |
16 |
12 |
1.778 |
|
6-10 |
16 |
17 |
24 |
18 |
1.778 |
|
7-8 |
12 |
19 |
20 |
18 |
1.778 |
|
7-9 |
10 |
13 |
16 |
13 |
1 |
|
8-9 |
16 |
20 |
26 |
20 |
2.778 |
|
9-11 |
15 |
21 |
22 |
20 |
1.361 |
|
10-11 |
10 |
12 |
14 |
12 |
0.444 |
Thus, the expected project length is calculated using the PERT method accordingly:
$\sum_{\text {critical }}=7+12+14+12+18+20+20=103$
The total variances for the critical path in the project are:
$\sum_{\text {varaince }}=1+0.444+0.111+1.778+1.778+2.778+1.361=9.25$
Then, the completion period of project X = 105 days; by applying Eq. (8), we can find that the probability of completing the home project is:
$\operatorname{prob} Z \leq\left(\frac{105-103}{\sqrt{9.25}}\right)=\operatorname{prob}[Z \leq 0.66]=0.7454$
This indicates that there is a chance of completing the project within 105 days, equal to 74.54%. There will only be a two-day difference in project completion between PERT and CPM. Thus, the critical path (CPM) and PERT methods are successful and effective when building a house. Whole floats (TF) and allowed floats (FF) are calculated using Eqs. (4) and (5) respectively, as displayed in Table 6. The critical route table above shows that the order of activities is flexible, with total floats (TF) being the most prevalent example. Moreover, floating freely (FF) is the crucial route when using floats that have values of zero. TF=0 and FF=0 in this case.
The accompanying table shows the order in which the actions of the (1-2-3-5-7-8-9-11).
Table 6. TF and FF design in PERT
|
Path |
Start |
End |
Start |
End |
F |
TF |
Note |
|
1-2 |
0 |
7 |
0 |
7 |
0 |
0 |
Cr |
|
2-3 |
7 |
19 |
7 |
19 |
0 |
0 |
Cr |
|
3-4 |
19 |
27 |
19 |
67 |
0 |
40 |
- |
|
3-5 |
19 |
33 |
19 |
33 |
0 |
0 |
Cr |
|
4-6 |
27 |
41 |
62 |
76 |
35 |
35 |
- |
|
5-7 |
33 |
45 |
33 |
45 |
0 |
0 |
Cr |
|
6-10 |
41 |
58 |
76 |
93 |
35 |
35 |
- |
|
7-8 |
45 |
64 |
45 |
64 |
0 |
0 |
Cr |
|
7-9 |
45 |
84 |
45 |
84 |
0 |
0 |
- |
|
8-9 |
64 |
84 |
64 |
84 |
0 |
0 |
Cr |
|
9-11 |
84 |
105 |
84 |
105 |
0 |
0 |
Cr |
|
10-11 |
58 |
105 |
93 |
105 |
35 |
12 |
- |
3.4 Summary
This study was designed for a home-building project. Collect and analyze data using CPM and PERT. The study describes the various activities involved in the project by rolling the account forward and backward, including early events and the most recent start and end of the activity.
Using CPM and PERT methods to determine slack quantities and critical paths. According to the results, the difference in calculation methods between CPM and BERT implementation can be seen in their estimates, as shown in Table 7. The CPM method is based only on the almost certain estimate (M), while the study using PERT is based on the optimistic estimate (A), the almost certain estimate (M), and the doubtful estimate (B).
However, PERT calculations support the possibilities of reporting task completion times based on three-period estimates. Furthermore, the research shows that the total CPM days to completion is 105 days, the total number of PERT days is 103 days, the probability of completing a home construction project is 74.54%, and the time for project completion is very important.
The difference was very important in terms of reducing costs and saving time.
Table 7. Compare results between CPM and PERT
|
Comparison |
CPM |
PERT |
Difference |
|
Duration (measured in days) |
105 |
103 |
2 |
The findings of this study underscore the pivotal role of project management and task distribution in the timely completion of construction projects. The application of scientific techniques such as CPM and PERT has been shown to significantly reduce project completion times. In the specific case of the house construction project analyzed, the CPM algorithm indicated a completion time of 105 days, while the PERT algorithm resulted in a slightly shorter duration of 103 days. This two-day difference highlights the greater efficiency of the PERT technique in this context.
Furthermore, the probability of completing the house construction project within 105 days was calculated to be 74.54% when using the PERT technique. This finding suggests that the PERT method provides a higher likelihood of on-time project completion, thereby enhancing the reliability of project timelines.
It is evident from the results that the adoption of scientific project management methods such as CPM and PERT is crucial in optimizing both time and cost in construction projects. These methodologies not only facilitate effective planning and scheduling but also ensure a higher degree of accuracy in project completion forecasts. Therefore, the integration of CPM and PERT techniques into project management practices is highly recommended for achieving improved efficiency and reliability in construction project outcomes.
[1] Kelley Jr, J.E., Walker, M.R. (1959). Critical-path planning and scheduling. In Papers Presented at the December 1-3, 1959, Eastern Joint IRE-AIEE-ACM Computer Conference, Boston, USA, pp. 160-173. https://doi.org/10.1145/1460299.1460318
[2] Ahuja, H.N., Dozzi, S.P., Abourizk, S.M. (1994). Project Management: Techniques in Planning and Controlling Construction Projects. John Wiley & Sons.
[3] Rosenthal, A. (1977). Computing the reliability of complex networks. SIAM Journal on Applied Mathematics, 32(2): 384-393. https://doi.org/10.1137/0132031
[4] Abdulmunem, A.H., Al-Khafaji, Z. (2023). Forecasting of long-range electrical loads in Najaf province using Markov model. In 2023 6th International Conference on Engineering Technology and its Applications (IICETA), Al-Najaf, Iraq, pp. 414-419. https://doi.org/10.1109/IICETA57613.2023.10351454
[5] Mohammed, A.M., Al-Khafaji, Z. (2023). Innovative way to evaluate the reliability and importance of complex-series networks. In 2023 6th International Conference on Engineering Technology and its Applications (IICETA), Al-Najaf, Iraq, pp. 540-544. https://doi.org/10.1109/IICETA57613.2023.10351457
[6] Fadhil, R.A., Hassan, Z.A.H. (2023). A hybrid honey-badger intelligence algorithm with Nelder-Mead method and its application for reliability optimization. International Journal of Intelligent Systems and Applications in Engineering, 11(4s): 136-145. https://www.ijisae.org/index.php/IJISAE/article/view/2580.
[7] Li, W.G., Carter, D.J. (2005). Construction baseline schedule review and submittal timeframe. Cost Engineering, 47(2): 28.
[8] Alridha, A.H., Salman, A.M., Mousa, E.A. (2023). Numerical optimization software for solving stochastic optimal control. Journal of Interdisciplinary Mathematics, 26(5): 889-895.
[9] Abbas, S.A.K., Hassan, Z.A.H. (2021). Use of ARINC Approach method to evaluate the reliability assignment for mixed system. In Journal of Physics: Conference Series, IOP Publishing, 1999(1): 012102. https://doi.org/10.1088/1742-6596/1999/1/012102
[10] Mahmood, S.S., Eidi, J.H. (2022). New class of rank 1 update for solving unconstrained optimization problem. Iraqi Journal of Science, 63(2): 683-689. https://doi.org/10.24996/ijs.2022.63.2.25
[11] Mohammed, A.M., Al-Khafaji, Z. (2023). Novel approach to obtain minimum path/cut sets for complex-series networks. In 2023 6th International Conference on Engineering Technology and its Applications (IICETA), Al-Najaf, Iraq, pp. 659-664. https://doi.org/10.1109/IICETA57613.2023.10351276
[12] Ali-Hussein, Y., Shiker, M.A. (2022). Using the largest difference method to find the initial basic feasible solution to the transportation problem. Journal of Interdisciplinary Mathematics, 25(8): 2511-2517. https://doi.org/10.1080/09720502.2022.2040852
[13] Liu, J.Y. (2012). Schedule uncertainty control: A literature review. Physics Procedia, 33: 1842-1848. https://doi.org/10.1016/j.phpro.2012.05.293
[14] Mahdi, M.M., Dwail, H.H., Wasi, H.A., Hashim, K.H., Kahtan Dreeb, N., Hussein, H.A., Shiker, M.A. (2021). Solving systems of nonlinear monotone equations by using a new projection approach. In Journal of Physics: Conference Series, IOP Publishing, 1804(1): 012107. https://doi.org/10.1088/1742-6596/1804/1/012107
[15] Alridha, A., Wahbi, F.A., Kadhim, M.K. (2021). Training analysis of optimization models in machine learning. International Journal of Nonlinear Analysis and Applications, 12(2): 1453-1461. https://doi.org/10.22075/IJNAA.2021.5261
[16] Hashim, L.H., Dreeb, N.K., Hashim, K.H., Shiker, M.A. (2021). An application comparison of two negative binomial models on rainfall count data. In Journal of Physics: Conference Series, IOP Publishing, 1818(1): 012100. https://doi.org/10.1088/1742- 6596/1818/1/012100
[17] Kadhim, H.J., Shiker, M.A., Al-Dallal, H.A. (2021). A New technique for finding the optimal solution to assignment problems with maximization objective function. In Journal of Physics: Conference Series, IOP Publishing, 1963(1): 012104. https://doi.org/10.1088/1742-6596/1963/1/012104
[18] Dwail, H.H., Mahdi, M.M., Shiker, M.A. (2022). CG method with modifying βk for solving unconstrained optimization problems. Journal of Interdisciplinary Mathematics, 25(5): 1347-1355. https://doi.org/10.1080/09720502.2022.2040854
[19] Dreeb, N.K., Hashim, L.H., Hashim, K.H., Shiker, M.A. (2021). Using a new projection approach to find the optimal solution for nonlinear systems of monotone equation. In Journal of Physics: Conference Series, IOP Publishing, 1818(1): 012101. https://doi.org/10.1088/1742-6596/1818/1/012101
[20] Hussein, H.A., Shiker, M.A.K., Zabiba, M.S. (2020). A new revised efficient of VAM to find the initial solution for the transportation problem. In Journal of Physics: Conference Series, IOP Publishing, 1591(1): 012032. https://doi.org/10.1088/1742-6596/1591/1/012032
[21] Hashim, K.H., Hashim, L.H., Dreeb, N.K., Shiker, M.A. (2021). Solving the nonlinear monotone equations by using a new line search technique. In Journal of Physics: Conference Series, IOP Publishing, 1818(1): 012099. https://doi.org/10.1088/1742-6596/1818/1/012099
[22] Mahdi, M.M., Dwail, H.H., Shiker, M.A. (2022). Hybrid spectral algorithm under a convex constrained to solve nonlinear equations. Journal of Interdisciplinary Mathematics, 25(5): 1333-1340. https://doi.org/10.1080/09720502.2022.2040851
[23] Salman, A.M., Alridha, A., Hussain, A.H. (2021). Some topics on convex optimization. In Journal of Physics: Conference Series, IOP Publishing, 1818(1): 012171. https://doi.org/10.1088/1742-6596/1818/1/012171
[24] Dwail, H.H., Mahdi, M.M., Wasi, H.A., Hashim, K.H., Hussein, H.A., Shiker, M.A. (2021). A new modified TR algorithm with adaptive radius to solve a nonlinear systems of equations. In Journal of Physics: Conference Series, IOP Publishing, 1804(1): 012108. https://doi.org/10.1088/1742-6596/1804/1/012108
[25] Hashim, L.H., Hashim, K.H., Shiker, M.A. (2021,). An application comparison of two Poisson models on zero count data. In Journal of Physics: Conference Series, 1818(1): 012165. https://doi.org/10.1088/1742-6596/1818/1/012165
[26] Nicholas, J.M., Steyn, H. (2020). Project Management for Engineering, Business and Technology. Routledge, London. https://doi.org/10.4324/9780429297588
[27] Mahmood, S.S., Muhanah, N.S. (2019). Symmetric and positive definite Broyden update for unconstrained optimization. Baghdad Science Journal, 16(3): 661-666. http://doi.org/10.21123/bsj.2019.16.3.0661
[28] Hebert, J.E., Deckro, R.F. (2011). Combining contemporary and traditional project management tools to resolve a project scheduling problem. Computers & Operations Research, 38(1): 21-32.