Fredy Sumasto*![]() | Indah Nur Safitri
| Indah Nur Safitri![]() | Febriza Imansuri
| Febriza Imansuri![]() | Indra Rizki Pratama
| Indra Rizki Pratama![]() | Isma Wulansari
| Isma Wulansari![]() | Edwin Sahrial Solih
| Edwin Sahrial Solih![]() | Arif Dzulfikar
| Arif Dzulfikar![]()
© 2024 The authors. This article is published by IIETA and is licensed under the CC BY 4.0 license (http://creativecommons.org/licenses/by/4.0/).
OPEN ACCESS
In the dynamic landscape of the automotive industry, operational efficiency is a pivotal factor for sustained growth. This study delves into the intricacies of enhancing manufacturing operations, mainly focusing on the blowing machines at RMA Ltd, a key player in the Indonesian automotive SME sector. The primary objective is to optimize Overall Equipment Effectiveness (OEE) by implementing a Total Productive Maintenance (TPM) approach. The Indonesian automotive sector, vital to national economic growth, needs help maintaining optimal production efficiency. This study centres on the blowing machines at RMA Ltd's Plant 7, emphasizing the need to address breakdowns, particularly in the blowing machine, which has been identified as the primary source of production losses. A comprehensive research methodology is outlined, beginning with an extensive literature review on TPM and OEE. The study then focuses on the Indonesian automotive SME sector, with RMA Ltd as the primary research subject. Data collection involves an initial survey to assess the current state of blowing machines, encompassing OEE, Six Big Losses, and other relevant factors. Post-implementation of improvements, the study reveals substantial enhancements in OEE. Availability rates increased (93.19%), Performance Efficiency improved (84.84%), and Quality Rate remained consistently high (98.41%). The calculated OEE rose from 67.42% to an impressive 77.80%. Noteworthy reductions in Six Big Losses, particularly in breakdowns, setup losses, and reduced speed losses, validate the efficacy of TPM implementation. This research introduces a novel approach by integrating socialization strategies, detailed work instructions, and proactive maintenance practices. Through a comprehensive research methodology, including an initial survey and post-implementation analysis, this study demonstrates significant OEE improvements of 11%. The findings underscore the novelty of this research in emphasizing the importance of holistic TPM implementation strategies in enhancing manufacturing operations within the Indonesian automotive SME sector. Furthermore, this study provides actionable insights for SMEs in the Indonesian automotive sector, highlighting the relevance of TPM in achieving operational excellence and competitive advantage. Ultimately, this research contributes a valuable blueprint for SMEs seeking to navigate the complexities of the automotive industry, offering a roadmap to optimize manufacturing operations and thrive in a competitive market.
automotive parts, manufacturing, OEE, TPM, six big losses, SMEs
In an era of intense industrial competition, operational efficiency is critical for companies, especially in Indonesia's rapidly growing automotive sector [1, 2]. The main focus of this article is to improve the effectiveness of blowing machines at RMA Ltd to achieve optimal Overall Equipment Effectiveness (OEE). With support from the automotive component sector, the automotive industry plays a vital role in national economic growth [1, 3-6]. As an automotive component manufacturer, RMA Ltd faced the challenge of improving the OEE of the blowing machine, which is a critical element in the production of door covers. Maintenance data showed that the blowing machine had a significant breakdown rate, with the highest percentage among other machines in RMA Ltd's Plant 7.
As reported by Singh et al. [7], previous research showed that implementing Total Productive Maintenance (TPM) can improve the OEE of production machines. By adopting this approach, RMA LTD is expected to address the issue of machine effectiveness, particularly on the blowing machine. As observed by Edward [8], the implementation of TPM in the manufacturing industry can positively contribute to machine performance. In the case of Toba Pulp Lestari Ltd, the emphasis on OEE helped identify and reduce production losses. Duraisamy et al. [9] emphasised that SMEs can achieve operational excellence by implementing TPM. Although the company's size differs, the TPM concept remains relevant to improve production efficiency and effectiveness.
The case study from Zulfikar et al. [10] at ABC Ltd shows that OEE evaluation and Six Big Losses analysis can help identify the root causes of problems and guide improvements. This case is consistent with the concept of Lean Manufacturing, as discussed by Ondra [11]. Guritno and Cahyana [12] reported an increase in OEE after implementing TPM with an Autonomous Maintenance (AM) approach [8]. These measures have also proven successful in the case of TPM implementation at Wahana Tunas Utama Rucika Ltd. The application of TPM to packaging machinery, as in the study Saputra and Rady [13], shows the importance of OEE in improving productivity. With OEE evaluation, companies can identify factors that affect machine performance, as described by Martomo and Laksono [14].
The Lean Manufacturing approach, as proposed by Sandy and Wathoni [15], can be the foundation for OEE measurement. In the pharmaceutical industry, OEE is an effective tool for monitoring and improving production efficiency. A lightweight TPM model that suits the needs of SMEs, as proposed by Xiang and Chin [16], can guide the implementation of TPM at RMA Ltd. This research shows that TPM can be adopted effectively without burdening companies with significant investments [17, 18]. As a step towards aligning with international standards, RMA Ltd needs to adopt Lean Manufacturing and TPM methods. This step will help achieve the desired OEE level and improve the company's competitiveness in the global automotive market.
This study aims to investigate the potential of implementing TPM with a Lean Manufacturing approach to improve blowing machine OEE at RMA Ltd. By detailing blowing machine defect cases, measuring OEE, and implementing TPM-based improvement measures, the research endeavours to achieve optimal production performance and support the growth of the automotive industry in Indonesia. While the primary focus is on the blowing machines at RMA Ltd's Plant 7, the insights gained from this study hold broader implications for the Indonesian automotive SME sector. By elucidating the synergies between TPM and Lean Manufacturing principles in enhancing blowing machine OEE, this research offers transferable insights and methodologies applicable to similar contexts within the Indonesian automotive SME sector. Through a nuanced understanding of the challenges and opportunities encountered by RMA Ltd, this study aims to contribute to operational excellence and competitiveness within the wider Indonesian automotive industry.
However, despite the abundance of literature advocating for TPM and Lean Manufacturing principles, more research is still needed, focusing on their integration within the Indonesian automotive SME sector, particularly in the context of blowing machines. This gap underscores the need for a tailored approach to address the specific challenges faced by SMEs like RMA Ltd, where blowing machine breakdowns pose significant obstacles to achieving optimal production efficiency.
In the preliminary phase, an in-depth literature study will be conducted to thoroughly understand the concept of Total Productive Maintenance (TPM) and its application in improving Overall Equipment Effectiveness (OEE) in various industries. The main focus will be on the problems and challenges commonly faced in the manufacturing industry, especially in production machinery. After the initial understanding, the next step is to establish the scope of the study. This process will include identifying small and medium-sized automotive companies (SMEs) in Indonesia as research subjects.
2.1 Data collection
Before TPM implementation, an initial survey will be conducted to obtain data on the conditions and problems associated with blowing machines in each SME automotive company [13, 19]. Data regarding OEE, Six Big Losses, and other factors affecting machine performance will be collected [20-22]. Once the data is collected, a preliminary OEE analysis will be conducted to evaluate the effectiveness level of the packaging-making machine. Identify the Six Big Losses that are most significant in the context of the SME automotive industry in Indonesia [10, 23, 24].
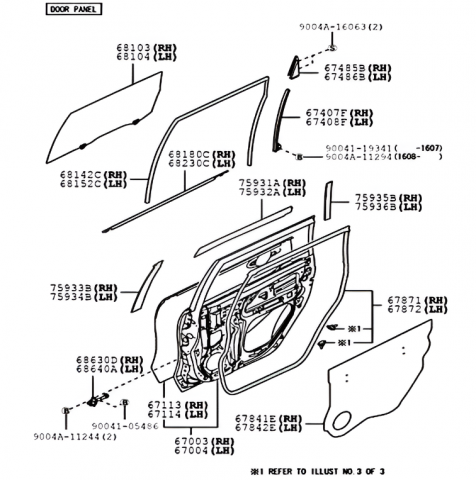
The door cover is one of the constituent parts of a car, the basic material of which is plastic. This component is located on the inside of the car door. Its function is to prevent water from entering the wall of the car door. The name of the machine is film blowing machine (SJ-H55/1000), the beginning of the machine at RMA LTD in 2015. The location of the cover door can be seen in Figure 1.
Figure 1. Location of cover door
2.2 Analysis of current condition
Based on the findings of the initial analysis, a TPM training programme will be designed. It covers the steps of TPM implementation, with an emphasis on preventive maintenance, directed improvement, and employee engagement [1, 19]. After the design of the training programme, the TPM implementation phase will begin in each company. Careful monitoring of changes in the machine's Availability Rate, Performance Rate, and Rate of Quality will be conducted periodically [13, 25, 26].
2.3 Design and Implementation of TPM
Data from TPM implementation will be statistically analysed to evaluate significant changes in machine performance. Factors determining the success or obstacles in TPM implementation will be identified. The findings will be compiled in a report with graphs, tables, and in-depth analyses. Specific recommendations will be provided to improve engine OEE in the SME automotive industry. As a final step, the findings and recommendations will be discussed and validated with relevant parties in each SME automotive company, ensuring the sustainability and validity of the research results.
Moreover, a detailed elucidation of the blowing machines and their operational significance within the manufacturing process is warranted. The blowing machines, specifically the film blowing machine (SJ-H55/1000), serve as instrumental apparatuses in the production cycle of door covers, a fundamental component in automotive manufacturing. These machines play a crucial role in the extrusion of plastic film, which subsequently contributes to the fabrication of door covers essential for preventing water ingress into car doors. Additionally, it is imperative to critically evaluate any underlying assumptions guiding the study and their potential implications on the research outcomes and their generalizability. Assumptions concerning machine maintenance schedules, operational parameters, and levels of employee engagement may significantly influence the efficacy of TPM implementation and subsequent enhancements in OEE metrics. By meticulously examining these assumptions, this study endeavours to fortify the reliability and applicability of its findings across the Indonesian automotive SME sector.
3.1 Result of data collection
3.1.1 Working hour of blowing machine
Working hour is the overall time that shows the number of working hours used for the production process. RMA Ltd operates for 5 working days a week, this research was conducted only on shift 1. In September and November 2022 there was overtime, each month 2 times overtime. The overtime time is 1 hour 30 minutes. The working hour data of the blowing machine in September 2022-November 2022 can be seen in Table 1.
Table 1. Working hour data of blowing machine
|
Month |
Total Working Hour (min) |
Actualised Working Hour (min) |
|
Sep |
11,620 |
10,951 |
|
Oct |
10,920 |
10,288 |
|
Nov |
11,620 |
10,962 |
3.1.2 Planned downtime of blowing machine
Planned downtime is data showing the machine downtime the company has planned for scheduled maintenance or other management activities. Routine activities before carrying out the production process at RMA Ltd are gymnastics and briefing, then continued with the preparation time for operator preparation to run the machine after the production process has been completed, followed by cleaning activities to clean the work area and scrap from the production process. The scheduled time may change or not be the same and is flexible according to needs. The planned downtime data of the RMA Ltd blowing machine can be seen in Table 2.
3.1.3 Breakdown time of blowing machine
Breakdown time is data that shows the time of disruption to the machine so that the machine must be repaired immediately, even though the machine is operating. Then, the machine stops operating for a while. RMA LTD blowing machine breakdown time data can be seen in Table 3.
3.1.4 Setup and adjustment time of blowing machine
Setup and adjustment time shows the time it takes for the machine to start operating to produce new components, such as setting up a machine or changing moulds or dies. RMA Ltd's blowing machine setup and adjustment data can be seen in Table 4.
Table 2. Planned downtime of blowing machine
|
Month |
Planned Downtime (min) |
Total (min) |
|||
|
Exercise |
Briefing |
Prepare |
Cleaning |
||
|
Sep |
219 |
114 |
226 |
110 |
669 |
|
Oct |
209 |
106 |
212 |
105 |
632 |
|
Nov |
220 |
110 |
220 |
108 |
658 |
Table 3. Breakdown time of blowing machine
|
Month |
Breakdown Time (min) |
Total (min) |
||||
|
Broken Filters |
Dynamo Burns |
Broken Heater |
Perforated Octopus Hose |
Broken Bolts |
||
|
Sep |
110 |
619 |
- |
- |
- |
729 |
|
Oct |
135 |
- |
355 |
- |
- |
490 |
|
Nov |
117 |
- |
- |
214 |
229 |
560 |
Table 4. Setup and adjustment data of blowing machine
|
Month |
Setup and Adjustment Time (min) |
|
Sep |
518 |
|
Oct |
541 |
|
Nov |
567 |
In the production process, products are good, and some products have defects that must be rejected or repaired. The production data of the RMA LTD blowing machine can be seen in Table 5. In addition, the performance of the blowing machine (Table 6) also needs to be considered to assess the ideal output produced.
Table 5. Production data of blowing machine
|
Month |
Actual Output (pcs) |
Scrap (pcs) |
Repair/Rework (pcs) |
|
Sep |
58,811 |
589 |
257 |
|
Oct |
61,395 |
520 |
233 |
|
Nov |
60,591 |
1,002 |
470 |
Table 6. Performance data of blowing machine
|
Month |
Performance |
||||
|
Operating Time (min) |
Production Target (pcs) |
Actual Output (pcs) |
Ideal Cycle Time (min) |
Actual Cycle Time (min) |
|
|
Sep |
9,664 |
71,675 |
58,811 |
0.12 |
0.17 |
|
Oct |
9,257 |
68,656 |
61,395 |
0.12 |
0.15 |
|
Nov |
9,835 |
72,943 |
60,591 |
0.12 |
0.16 |
3.2 Data processing
The data collected during the research at RMA LTD will then be processed, namely calculating the availability rate, performance efficiency, quality rate, OEE, and six significant losses carried out on the blowing machine. Availability rate is a ratio that shows the utilisation of time available for machine or equipment operation activities expressed as a percentage, for example, the calculation of availability rate in September 2022 (Eq. (1)). The availability rate percentage for September 2022-November 2022 can be seen in Table 7.
$\begin{gathered}\text { Availability Rate }=\frac{\text { Operating Time }}{\text { Loading Time }} \times 100 \% =\frac{10,900-1247}{10,900} \times 100 \%=88.56 \%\end{gathered}$ (1)
Table 7. Calculation of availability rate
|
Month |
Loading Time (min) |
Downtime (min) |
Operating Time (min) |
Availability (%) |
|
Sep |
10,900 |
1,247 |
9,653 |
88.56% |
|
Oct |
10,288 |
1,031 |
9,257 |
89.98% |
|
Nov |
10,962 |
1,127 |
9,835 |
89.72% |
Performance efficiency is a ratio that shows the ability of equipment or machinery to produce products expressed in percentages, for example, the calculation of performance efficiency in September 2022 (Eq. (2)). The percentage of performance efficiency for September 2022-November 2022 can be seen in Table 8.
$\begin{gathered}\text { Performance }= \frac{\text { Processed Amount } \times \text { Ideal Cycle Time }}{\text { Operating time }} \times 100 \% \\ =\frac{58,811 \times 0.12}{9,653} \times 100 \%=73.11 \%\end{gathered}$ (2)
Table 8. Calculation of performance efficiency
|
Bulan |
Operating Time (min) |
Cycle Time (min) |
Total Production (pcs) |
Performance (%) |
|
Sep |
9,653 |
0.12 |
58,811 |
73.11% |
|
Oct |
9,257 |
0.12 |
61,395 |
79.59% |
|
Nov |
9,835 |
0.12 |
60,591 |
77.28% |
The quality rate calculation is a ratio that shows the ability of a machine to produce products that meet standards and is expressed as a percentage, for example, the calculation of the quality rate in September 2022 (Eq. (3)). The quality rate percentage for September 2022-November 2022 can be seen in Table 9.
$\begin{gathered}\text { Quality Rate }& =\frac{\text { Processed Amount }- \text { Defect Amount }}{\text { Processed Amount }} \times 100 \% \\ &=\frac{58,811-(589+257)}{58,811} \times 100 \%=98.56 \%\end{gathered}$ (3)
Table 9. Calculation of quality rate
|
Month |
Total Production (pcs) |
Scrap (pcs) |
Repair/Rework (pcs) |
Finished Good (pcs) |
Quality (%) |
|
Sep |
58,811 |
589 |
257 |
57,965 |
98.56% |
|
Oct |
61,395 |
520 |
233 |
60,642 |
98.77% |
|
Nov |
60,591 |
1,002 |
470 |
59,119 |
97.68% |
The OEE calculation is based on the availability, performance, and quality values obtained; for example, the OEE calculation in September 2022 (Eq. (4)). The OEE percentage for September 2022-November 2022 can be seen in Table 10.
$\begin{gathered}\mathrm{OEE}&=\text { Availability } \text { Rate } \times \text { Performance Efficiency } \times \text { Quality } \text { Rate } \\ &=88,56 \% \times 73,11 \% \times 98,56 =63,81 \%\end{gathered}$ (4)
Table 10. Calculation of OEE
|
Month |
Availability (%) |
Performance (%) |
Quality (%) |
OEE (%) |
|
Sep |
88.56% |
73.11% |
98.56% |
63.81% |
|
Oct |
89.98% |
79.59% |
98.77% |
70.73% |
|
Nov |
89.72% |
77.28% |
97.68% |
67.72% |
|
Average |
89.42% |
76.66% |
98.34% |
67.42% |
The calculation of six big losses aims to see what losses occur in the production process, resulting in less effectiveness. The calculation of six big losses consists of breakdown losses, set-up and adjustment losses, reduced speed losses, idling and minor stoppages, rework losses, and reduced yield.
Breakdown losses are a visible cause of loss because the damage will impact the machine, which will not produce output, for example, the calculation of breakdown losses in September 2022 (Eq. (5)). The percentage of breakdown losses for September 2022-November 2022 can be seen in Table 11.
$\begin{gathered}\text { Breakdown Losses }=\frac{\text { Total Breakdown Time }}{\text { Loading Time }} \times 100 \% \\ =\frac{729}{10.900} \times 100 \%=6.69 \%\end{gathered}$ (5)
Table 11. Calculation of breakdown losses
|
Month |
Total Breakdown Time (min) |
Loading Time (min) |
Breakdown Losses (%) |
|
Sep |
729 |
10,900 |
6.69% |
|
Oct |
490 |
10,288 |
4.76% |
|
Nov |
560 |
10,962 |
5.11% |
|
Average |
5.52% |
||
Setup and adjustment losses are caused by the preparation of a long production process due to waiting for the arrival of materials and machine settings, for example, the calculation of setup and adjustment losses in September 2022 (Eq. (6)). The percentage of setup and adjustment losses for September 2022-November 2022 can be seen in Table 12.
$\begin{aligned} \text { Setup & Adjust Losses} &=\frac{\text { Total Setup & Adjustment Time }}{\text { Loading Time }} \times 100 \% \\ & =\frac{518}{10,900} \times 100 \%=4.75 \% \\ & \end{aligned}$ (6)
Table 12. Calculation of setup and adjustment losses
|
Month |
Setup and Adjustment Times (min) |
Loading Time (min) |
Setup and Adjustment (%) |
|
Sep |
518 |
10,900 |
4.75% |
|
Oct |
541 |
10,288 |
5.26% |
|
Nov |
567 |
10,962 |
5.17% |
|
Average |
5.06% |
||
Reduced speed losses are caused by a decrease in engine speed in carrying out its operations or the engine does not work optimally, for example, the calculation of reduced speed losses in September 2022 (Eq. (7)). The percentage of reduced speed losses for September 2022-November 2022 can be seen in Table 13.
$\begin{aligned}\text { Operating Time (Ideal Cycle Time } \times \text { Result Processed) } \text { Loading Time } \times 100 \%\\= \frac{9,959-(0.12 \times 58,811)}{10,900} \times 100 \%=26.62 \% \\ & \end{aligned}$ (7)
Table 13. Calculation of reduce speed losses
|
Month |
Actual Production Time (min) |
Loading Time (min) |
Ideal Cycle Time (min) |
Total Production (pcs) |
Reduced Speed (%) |
|
Sep |
9,959 |
10,900 |
0.12 |
58,811 |
26.62% |
|
Oct |
9,037 |
10,288 |
0.12 |
61,395 |
16.23% |
|
Nov |
10,132 |
10,962 |
0.12 |
63,336 |
23.09% |
|
Average |
21.98% |
||||
Idling and minor stoppages cause the production process to stop for no more than five minutes but with a fairly frequent stoppage frequency, which can also be called machine idle time or non-productive time; for example, the calculation of idling and minor stoppages in September 2022 (Eq. (8)). The percentage of idling and minor stoppages for September 2022-November 2022 can be seen in Table 14.
$\begin{aligned} (\text { Total Target } \times \text { Total Production }) \times \text { Ideal Cycle Time } \text { Loading Time } \times 100 \%\\=\frac{(71,675 \times 58,811) \times 0.12}{10,900}\times 100 \%=14.16 \% \\ & \end{aligned}$ (8)
Table 14. Calculation of idling and minor stoppages
|
Month |
Total Target (pcs) |
Total Production (pcs) |
Ideal Cycle Time (min) |
Loading Time (min) |
Idling and Minor Stoppages (%) |
|
Sep |
71,675 |
58,811 |
0.12 |
10,900 |
14.16% |
|
Oct |
68,656 |
61,395 |
0.12 |
10,288 |
8.47% |
|
Nov |
72,943 |
63,336 |
0.12 |
10,962 |
10.52% |
|
Average |
11.05% |
||||
Rework losses are caused by the production process producing defective products, and the defective products produced result in material losses, reduced quantities that have been produced, increased production waste, and require costs for rework, for example, the calculation of rework losses in September 2022 (Eq. (9)). The percentage of rework losses for September 2022-November 2022 can be seen in Table 15.
$\begin{aligned} \text { Rework Losses } & =\frac{\text { Ideal Cycle Time } \times \text { Product Rework }}{\text { Loading Time }} \times 100 \% \\&=\frac{0.12 \times 257}{10,900} \times 100 \%=0.28 \%\end{aligned}$ (9)
Table 15. Calculation of rework losses
|
Month |
Rework (pcs) |
Loading Time (min) |
Ideal Cycle Time (min) |
Reject Losses (%) |
|
Sep |
257 |
10,900 |
0.12 |
0.28% |
|
Oct |
233 |
10,288 |
0.12 |
0.27% |
|
Nov |
470 |
10,962 |
0.12 |
0.51% |
|
Average |
0.36% |
|||
Reduced yield is a loss that arises during the production process, resulting in products that do not meet the standards due to the production process not yet reaching a stable condition, for example, the calculation of reduced yield in September 2022 (Eq. (10)). The percentage of reduced yield for September 2022-November 2022 can be seen in Table 16.
$\begin{gathered}\text { Reduced Yield }=\frac{\text { Ideal Cycle Time } \times \text { Product Scrap }}{\text { Loading Time }}\times 100 \%\\=\frac{0.12 \times 589}{10,900} \times 100 \%=0.65 \%\end{gathered}$ (10)
Table 16. Calculation of reduced yield
|
Month |
Scrap Product (pcs) |
Loading Time (min) |
Ideal Cycle Time (min) |
Reject Losses (%) |
|
Sep |
589 |
10,900 |
0.12 |
0.65% |
|
Oct |
520 |
10,288 |
0.12 |
0.61% |
|
Nov |
1,002 |
10,962 |
0.12 |
1.10% |
|
Average |
0.78% |
|||
3.3 OEE and six big losses analysis
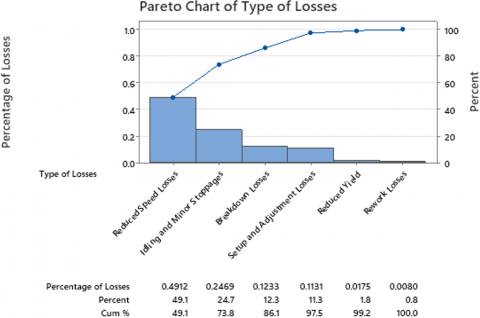
The Pareto chart of the six big losses can be seen in Figure 2. The calculation of the six big losses that have been accumulated shows that reduced speed losses are the largest type of losses that occur.
Figure 2. Pareto chart of six big losses
Analysis of OEE calculations is carried out in order to determine the level of effectiveness of the use of blowing machines in September 2022-November 2022 (Table 17). This OEE measurement uses average data from September 2022 to November 2022, namely by multiplying the availability value, performance efficiency value, and quality rate value.
Table 17. Percentage of OEE value
|
Category |
Average OEE Value |
|
Availability Rate (%) |
89.42% |
|
Performance Efficiency (%) |
76.66% |
|
Quality Rate (%) |
98.34% |
|
OEE (%) |
67.42% |
The OEE value of the calculation for three months made the average result of 66.42%, and the lowest category is performance efficiency, which is 75.54%. The explanation is as follows:
Analysis of six big losses aims to determine what factors affect the low effectiveness of blowing machines. The relationship between OEE and six big losses has an inversely proportional relationship. If the OEE value is low, it will result in a high value of six big losses, and vice versa. Based on the results of the calculations that have been carried out, the factor that causes the low OEE value occurs in performance efficiency. The results of the calculation of six big losses and the percentage order for September 2022-November 2022 can be seen in Table 18.
The six big losses for three months are calculated using the average. The results obtained reduce speed losses with the highest value, affecting the value of the actual production time, actual production quantity, ideal cycle time, and loading time. The value that most affects the low reduced speed losses is the time spent not following the output obtained, and the ideal cycle time that has been determined with the actual cycle time is different and slower.
Table 18. Percentage of six big losses
|
Type of Losses |
Average Losses (%) |
Percentage Losses (%) |
|
Reduced Speed Losses |
21.98% |
49.12% |
|
Idling and Minor Stoppages |
11.05% |
24.69% |
|
Breakdown Losses |
5.52% |
12.33% |
|
Setup and Adjustment Losses |
5.06% |
11.31% |
|
Reduced Yield |
0.78% |
1.75% |
|
Rework Losses |
0.36% |
0.80% |
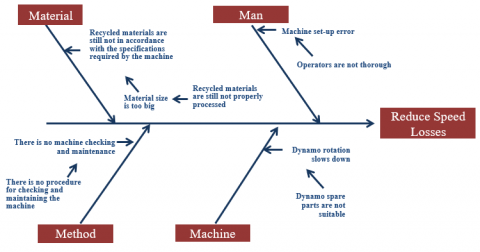
The next stage is to analyse the results of the most dominant type of losses in the calculation of six big losses, namely reduced speed losses, using Fishbone diagrams in order to find out the root causes of the problems that cause the dominant losses, look for any factors that cause reduced speed losses. The factor is sought for the cause of the problem and to find out the root of the problem. Making this Fishbone diagram results from discussions with operators and maintenance staff. The fishbone diagram for reduced speed losses can be seen in Figure 3.
Figure 3. Fishbone diagram of reduce speed losses
Four factors cause reduced speed losses (Figure 3) to be the most dominant losses: humans, materials, methods, and machines. The explanation of each factor is as follows:
(1) Man
The problem is the operator makes machine setup errors. This problem happens because the operator is not careful.
(2) Material
The material factor, which is the problem, is that the recycled material needs to follow the machine's specifications. This problem happens because recycled material processing still needs to be corrected, so the plastic beans produced from recycled processing are quite large.
(3) Method
The method factor that is a problem is that machine checking and maintenance do not exist because there is no definite procedure.
(4) Machine
The machine factor that is a problem is that the replacement dynamo spare parts need to match the specifications. The previous dynamo caught fire, so the company had to look for a replacement dynamo. The production process needs to run smoothly, and the machine is reduced in speed.
After the factors that affect reducing speed losses are successfully mapped, a 5W + 1H analysis is made. 5W + 1H analysis is carried out to bring up the resolution of the problems that have been analysed in the Fishbone diagram. Each factor in the Fishbone diagram will be sought for problem-solving so that the problems can be resolved. The 5W+1H analysis of reduced speed losses can be seen in Table 19.
Table 19. 5W+1H analysis
|
Factor |
Causes |
Why |
What |
Where |
When |
Who |
How |
|
Why does it need to be fixed? |
What is the improvement plan? |
Where is the improvement done? |
When is the repair done? |
Who is in charge? |
How does it work? |
||
|
Man |
Less thorough |
To avoid process errors |
Re-conduct socialisation |
Blowing machine at RMA Ltd |
Dec 2022 |
Supervisor plant 7 |
Provide re-socialisation for machine setting procedures and make work instructions so as not to forget again. |
|
Material |
Recycled materials have not been properly processed |
To match the specifications |
Make provisions for material size |
Blowing machine at RMA Ltd |
Dec 2022 |
Production division |
Make adjustments to material sizes in accordance with machine specifications. |
|
Method |
There is no procedure for checking and maintaining the machine |
In order to extend the usability of the machine, and the machine is not easy to experience breakdowns so that the production target is achieved |
Make a check sheet for checking and maintaining the machine |
Blowing machine at RMA Ltd |
Dec 2022 |
Operator of the blowing machine |
Checking and maintaining the machine regularly, one of which is by making a check sheet. |
|
Machine |
Dynamo spare parts are not suitable |
In order to prevent machine damage |
Make a list of standard machine spare parts |
Blowing machine at RMA Ltd |
Dec 2022 |
Production division |
Make a standard list for machine spare parts so that if there is a purchase of spare parts, there is no error. |
3.4 Improvement implementation
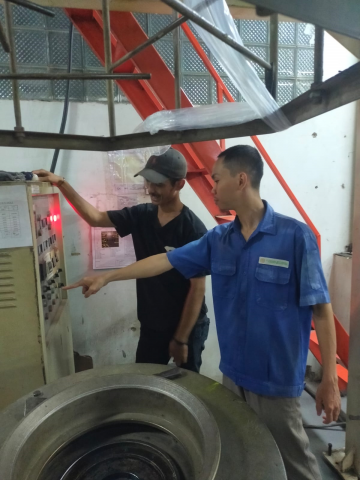
3.4.1 Socialising and making work instructions
This improvement was made because the operator needed to set up the machine correctly. With the supervisor re-socialising the operator to do the machine setup for each type of part, the operator is expected to avoid making mistakes again. The socialisation done by the supervisor can be seen in Figure 4.
Figure 4. Socialisation by supervisor
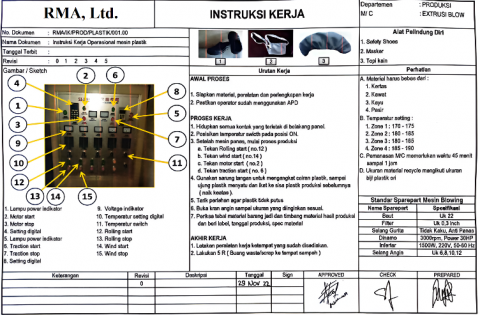
Making work instructions is the next stage so machine setup errors do not occur again. The goal is for operators to see the procedures and rules for each type of cover door for machine setup. The impact is that operators find it easier to do machine setup so that the goods produced follow the standards and the course of the production process follows the target. Based on the data, the number of operators making machine setup errors in September 2022-November 2022 occurred 3 times, and after the improvements seen in December 2022-February 2023, there were no such errors. In the work instructions, there are standard blowing machine spare parts so that there are no errors in purchasing and installing machine spare parts. Work instructions for the blowing machine can be seen in Figure 5.
3.4.2 Material standardisation
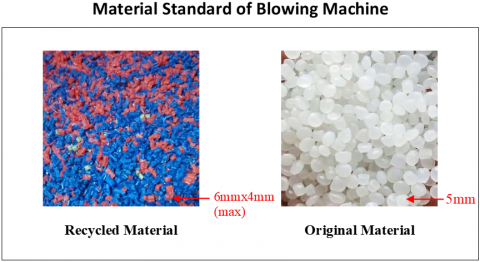
This improvement is done so that operators pay attention to the material used in the machine. Materials that do not follow the standard will quickly damage the filter part of the machine, adding machine breakdown time to repair the filter so that the production process time will be disrupted. The use of recycled materials for the subcover consists of 20%-25% original plastic seeds, the rest recycled plastic seeds, and 100% recycled plastic seeds for plastic packing.
Improvements were made because the size of the recycled material was enormous, so the machine filter was damaged twice a month. After regular checks and paying attention to the standard size of the material, damage to the machine filter occurred once a month. This recycled material aims to reduce costs, so its characteristics must be improved for the size to be appropriate, as in Figure 6.
Figure 5. Example of work instruction for blowing machine (in Bahasa)
Figure 6. Material standard of blowing machine
3.4.3 Improvement of check sheet creation
This improvement is carried out in the hope that the blowing machine will not easily experience breakdowns and that production targets are achieved if the problem can be resolved, it will have an impact on the availability value and performance efficiency value because it is related to the breakdown time and the amount of production produced, before implementing the check sheet, the calculation of Mean Time To Repair (MTTR), Mean Time Before Failure (MTBF), Mean Time To Failure (MTTF) is carried out.
$\begin{gathered}\text { MTTR }=\frac{\text { Total Downtime }}{\text { Number of Failures }} \times 100 \% \\ =\frac{1,779}{14} \times 100 \%=127.07 \text { minutes }\end{gathered}$ (11)
Based on the MTTR calculation (Eq. (11)) that has been carried out, the average time required for repair when damage or problems occur is 127.07 minutes.
$\begin{gathered}\text { MTTF }=\frac{\text { Total Downtime }}{\text { Number of Failures }} \times 100 \% \\ =\frac{28,745}{13} \times 100 \%=2,211.15 \text { minutes }\end{gathered}$ (12)
Based on the MTTF calculations that have been carried out, the average time the machine can operate before the subsequent damage occurs is 2,211.15 minutes, in the case of the dynamo checked for 3 months. The replacement of the dynamo is carried out for 5 years due to the infrequent frequency of damage, for the engine filter is replaced for 2 weeks once due to the frequency of damage 1 month 2 times.
$\begin{gathered}\text { MTBF }=\frac{\text { Total Downtime }}{\text { Number of Failures }} \times 100 \% \\ =\frac{28.745}{1}=28,745 \text { minutes }\end{gathered}$ (13)
Based on the MTBF calculations that have been carried out, the average time the machine can operate before the next damage occurs is 28,745 minutes.
3.5 Impact of improvement
3.5.1 OEE after improvement
The OEE value is calculated again after the improvement implementation. The OEE value is expected to change for the better because the increase in the OEE value means that the implementation provides good results. The calculation for OEE after the implementation of improvements is as follows:
(1) Availability rate after improvement
There is an increase in the availability rate after improvement because implementing improvements reduces machine breakdown time. The data from the availability rate after improvement can be seen in Table 20.
(2) Performance efficiency after improvement
After improvement, performance efficiency increases because the machine is more controlled with reduced damage and TPM or machine checking. Hence, the resulting output is better after improvement. The data from performance efficiency after repair can be seen in Table 21.
(3) Quality rate after improvement
There is a not-too-far increase in the quality rate after improvement because the previous value is good. The data from the quality rate after improvement can be seen in Table 22.
(4) Overall Equipment Effectiveness (OEE)
The calculation results for the average OEE value after improvement have increased from 67.42% to 77.80% (Table 23). This value has increased because each factor has increased, and the improvements that have been implemented affect the OEE value.
Table 20. Availability rate after improvement
|
Month |
Loading Time (min) |
Downtime (min) |
Operating Time (min) |
Availability (%) |
|
Dec |
10,718 |
752 |
9,966 |
92.98% |
|
Jan |
10,708 |
817 |
9,891 |
92.37% |
|
Feb |
9,754 |
564 |
9,190 |
94.22% |
|
Average of Availability Rate |
93.19% |
|||
Table 21. Performance efficiency after improvement
|
Month |
Operating Time (min) |
Ideal Cycle Time (min) |
Production Target (pcs) |
Total Production (pcs) |
Performance (%) |
|
Dec |
9,966 |
0.12 |
73,748 |
70,753 |
85.19% |
|
Jan |
9,891 |
0.12 |
73,193 |
70,012 |
84.94% |
|
Feb |
9,190 |
0.12 |
68,006 |
64,631 |
84.39% |
|
Average of Performance Efficiency |
84.84% |
||||
Table 22. Quality rate after improvement
|
Month |
Total Production (pcs) |
Scrap (pcs) |
Repair/Rework (pcs) |
Finished Good (pcs) |
Quality % |
|
Dec |
70,753 |
581 |
643 |
69,529 |
98.27% |
|
Jan |
69,828 |
698 |
295 |
68,835 |
98.58% |
|
Feb |
64,631 |
701 |
349 |
63,581 |
98.38% |
|
Average of Quality Rate |
98.41% |
||||
Table 23. OEE Value after improvement
|
Month |
Availability (%) |
Performance (%) |
Quality (%) |
OEE (%) |
|
Dec |
92.98% |
85.19% |
98.27% |
77.85% |
|
Jan |
92.37% |
84.94% |
98.58% |
77.35% |
|
Feb |
94.22% |
84.39% |
98.38% |
78.22% |
|
Average |
93.19% |
84.84% |
98.41% |
77.80% |
3.5.2 Six big losses after improvement
(1) Breakdown Losses
The value of breakdown losses has decreased due to reduced damage time with the improvements that have begun to be implemented. The calculation of breakdown losses after the implementation of improvements can be seen in Table 24.
Table 24. Breakdown losses after improvement
|
Month |
Total Breakdown Time (min) |
Loading Time (min) |
Breakdown Losses (%) |
|
Dec |
137 |
10,718 |
1.28% |
|
Jan |
210 |
10,708 |
1.96% |
|
Feb |
62 |
9,754 |
0.64% |
|
Average |
1.29% |
||
(2) Setup and adjustment losses after improvement
The value of setup and adjustment losses has decreased because the loading time value has improved with reduced damage time, even though no overtime is added to have a good loading time. The calculation of setup and adjustment losses after improvement can be seen in Table 25.
Table 25. Setup and adjustment losses after improvement
|
Month |
Setup and Adjustment Times (min) |
Loading Time (min) |
Setup and Adjustment (%) |
|
Dec |
615 |
10,718 |
5.74% |
|
Jan |
607 |
10,708 |
5.67% |
|
Feb |
502 |
9,754 |
5.15% |
|
Average |
5.52% |
||
(3) Reduce speed losses after improvement
The value of reduced speed losses has decreased because the actual production time has become better, the loading time has become better, and the amount of production has increased from before. The calculation of reduced speed losses after improvement can be seen in Table 26.
(4) Idling and minor stoppages after improvement
The value of idling and minor stoppages has decreased because the production amount is close to the target amount, and the loading time is improving. The calculation of idling and minor stoppages after improvement can be seen in Table 27.
Table 26. Reduce speed losses after improvement
|
Month |
Ideal Production Time (min) |
Loading Time (min) |
Ideal Cycle Time (min) |
Total Production (pcs) |
Reduced Speed (%) |
|
Dec |
10,027 |
10,718 |
0.12 |
70,753 |
14.33% |
|
Jan |
9,909 |
10,708 |
0.12 |
70,012 |
14.08% |
|
Feb |
9,192 |
9,754 |
0.12 |
64,631 |
14.72% |
|
Average |
14.38% |
||||
Table 27. Idling and minor stoppages after improvement
|
Month |
Total Target (pcs) |
Total Production (pcs) |
Ideal Cycle Time (min) |
Loading Time (min) |
Idling and Minor Stoppages (%) |
|
Dec |
73,748 |
70,753 |
0.12 |
10,718 |
3.35% |
|
Jan |
73,193 |
70,012 |
0.12 |
10,708 |
3.57% |
|
Feb |
68,006 |
64,631 |
0.12 |
9,754 |
4.15% |
|
Average |
3.69% |
||||
(5) Rework losses after improvement
The value of rework losses has decreased because the loading time has improved so that the rework products produced do not affect the value of rework losses. The calculation of rework losses after improvement can be seen in Table 28.
Table 28. Rework losses after improvement
|
Month |
Rework (pcs) |
Loading Time (min) |
Ideal Cycle Time (min) |
Reject Losses (%) |
|
Dec |
643 |
10,718 |
0.12 |
0.72% |
|
Jan |
295 |
10,708 |
0.12 |
0.33% |
|
Feb |
349 |
9,754 |
0.12 |
0.43% |
|
Average |
0.49% |
|||
(6) Reduce yield after improvement
The value of reduced yield increased from the results before the improvement because the scrap product increased from before. However, it is still categorised as good enough and does not dominate. The calculation of reduced yield after improvement can be seen in Table 29.
Table 29. Reduced yield after improvement
|
Month |
Product Scrap (pcs) |
Loading Time (min) |
Ideal Cycle Time (min) |
Reject Losses (%) |
|
Dec |
581 |
10,718 |
0.12 |
0.65% |
|
Jan |
698 |
10,708 |
0.12 |
0.78% |
|
Feb |
701 |
9,754 |
0.12 |
0.86% |
|
Average |
0.77% |
|||
3.5.3 MTTR, MTTF, MTBF after improvement
(1) MTTR after Improvement
Based on the data after improvement, the calculation for MTTR is obtained. There are 6 failures after improvement, with a total downtime of 409 minutes. The average time required to make repairs when damage or problems occur is 68.17 minutes. This value is better because of the decreased downtime and decreased damage frequency.
(2) MTTF after Improvement
Based on the data after improvement, the calculation for MTTF, the average time for the machine to operate after repair before damage occurs for the following spare part to be replaced is 7261.75 minutes. This value is obtained from 4 failures with a total operation time of 29,047 minutes. This value is increasing because the production time is improving, and the frequency of damage for items that must be replaced is reduced.
(3) MTBF after Improvement
Based on the data after improvement, the calculation for MTBF, the average time the machine can operate after repair before damage occurs for the next repairable spare part, is 29,047 minutes. This value has increased because production time is used better, and the damage frequency to repairable items is reduced.
3.6 Discussion
The company increased the OEE value of the blowing machine by implementing improvements, namely making check sheets, making material adjustment marks, re-socialising, providing work instructions, and making material lists. This improvement increased the OEE value percentage because the breakdown time was reduced. The machine speed had started to improve, so the resulting output increased from the previous month, and availability increased due to reduced breakdown time. A comparison of OEE values before and after the implementation of improvements can be seen in Table 30.
Table 30. Comparison of OEE before improvement and after improvement
|
Parameter |
Before Improvement |
After Improvement |
|
Availability |
89.42% |
93.19% |
|
Performance Efficiency |
76.66% |
84.84% |
|
Quality Rate |
98.34% |
98.41% |
|
OEE |
67.42% |
77.80% |
To contextualise the results obtained from RMA Ltd further, we will compare the OEE values we obtained with the benchmark OEE values in the automotive manufacturing industry in Indonesia. According to available industry data, the average OEE value in the Indonesian automotive industry is around 60% to 70% [5, 19, 27-30] Thus, the OEE improvement results from 67.42% before improvement to 77.80% after improvement implementation at RMA Ltd. show a significant improvement consistent with the industry standard. In addition, it will compare international trends in the automotive manufacturing industry. Based on the literature, developed countries such as Japan and Germany have OEE values that tend to be higher, reaching 80-85%. Nonetheless, the OEE improvement of 10.38 percentage points that we achieved is an achievement worth considering in the context of Indonesia's growing automotive manufacturing industry.
In analysing the key results, it is important to consider the context of the Indonesian automotive industry and compare it with international trends. The increase in OEE from 67.42% to 77.80% following the implementation of improvements at RMA Ltd. demonstrates significant progress in operational efficiency. However, it should be noted that OEE values in the Indonesian automotive industry are still below the global average, highlighting the potential to improve operational performance in this sector further. Developed countries such as Japan and Germany have achieved higher OEE levels in the international context, reflecting a more mature approach to production management and equipment maintenance. Therefore, while recognising our positive achievements, the company must continue to pay attention to global best practices and implement them consistently to remain competitive in an increasingly competitive automotive market. Thus, while improving OEE is a positive step, it is important to continue pursuing international standards to achieve long-term excellence in the Indonesian automotive industry.
A comparison of the six big losses in Table 31 found that some values have decreased, but some have increased slightly. The highest losses are still reduced speed losses, but the numbers have decreased from the previous ones. The number is improving because the improvements made have a better impact, the number of damage has decreased, and the number of production has increased.
In addition, the MTTR, MTTF, and MTBF values are calculated again to determine the average time to repair the machine, and the average from one damage to the subsequent damage can be determined. A comparison of MTTR, MTTF, and MTBF values can be seen in Table 32.
Table 31. Comparison of six big losses before and after improvement
|
Type of Losses |
Before Improvement |
After Improvement |
|
Breakdown Losses |
5.52% |
1.29% |
|
Setup and Adjustment Losses |
5.06% |
5.52% |
|
Reduced Speed Losses |
21.98% |
14.38% |
|
Idling and Minor Stoppages |
11.05% |
3.69% |
|
Rework Losses |
0.36% |
0.49% |
|
Reduce Yield |
0.78% |
0.77% |
Table 32. Comparison before and after improvement in MTTR, MTTF, and MTBF
|
Type of Losses |
Before Improvement (min) |
After Improvement (min) |
|
MTTR |
127.07 |
68.17 |
|
MTTF |
2,211 |
7,262 |
|
MTBF |
28,745 |
29,047 |
Comparison in Table 32. shows that there is a reasonably good improvement, the average time to repair decreases and the average time from one damage to the subsequent damage has increased, meaning that the improvement makes a good impact. The value becomes better because the damage time decreases and the frequency of damage decreases, so the MTTR, MTTF, and MTBF values improve.
In summary, the study has shed light on the transformative potential of Total Productive Maintenance (TPM) in optimising manufacturing operations, particularly within the Indonesian Automotive SME sector. The research has provided valuable insights into enhancing operational efficiency through a comprehensive analysis of Overall Equipment Effectiveness (OEE) and identifying key areas for improvement using the Six Big Losses framework. The first improvement implemented is to re-socialise the problems that occur. Then, socialisation results in the making of work instructions. The second is to adjust the material's size following the machine's specifications. The third is to check and maintain the machine regularly, one of which is by making a check sheet whose checking time is determined from the calculation of MTTR, MTTF, and MTBF from the results of the MTTF calculation, it shows that the period of checking the machine using a check sheet is for 3 days, while for the calculation of MTBF, checking is carried out for 4 days. The last is to make a standard list of machine spare parts so there is no error if spare parts are purchased. The previous OEE value was 67.42%. After the improvement, the value became 77.80%, up 11% from the previous OEE. The damage to the blowing machine from other machines before the improvement was 35.13%. After the improvement, it decreased to 22.09%. The significant increase in OEE from 67.42% to 77.80% following the implementation of targeted TPM interventions underscores the efficacy of such strategies in driving performance improvements. These findings contribute to the theoretical understanding of TPM and offer practical implications for SMEs in the automotive industry looking to enhance their competitiveness.
Moreover, it is crucial to acknowledge the limitations of this study to provide a balanced perspective. While the implemented interventions have yielded substantial improvements in OEE and machine reliability, it is essential to recognise that the findings are based on a single case study within the Indonesian automotive sector. Future research endeavours could benefit from conducting comparative studies across multiple SMEs or industries to generalise the effectiveness of TPM practices further. Additionally, exploring the long-term sustainability of the improvements and potential barriers to TPM implementation would enrich our understanding of its broader implications.
In addition, this study has significant implications for policy and practice in the Indonesian automotive sector. By demonstrating the tangible benefits of TPM implementation on operational efficiency and engine reliability, policymakers and industry stakeholders are encouraged to encourage adopting TPM practices among SMEs. Companies can also provide supportive policies, such as incentives or resources for TPM training and implementation, facilitating widespread adoption and fostering a culture of continuous improvement within the sector. In addition, collaboration between government agencies, industry associations, and academic institutions can foster innovation and knowledge exchange to advance Indonesia's automotive industry's global competitiveness.
The acknowledgements were given to RMA Ltd and Politeknik STMI Jakarta for providing administrative support to the authors and the materials used for the experiment in the case study.
[1] Sumasto, F., Arliananda, D.A., Imansuri, F., Aisyah, S., Purwojatmiko, B.H. (2023). Enhancing automotive part quality in SMEs through DMAIC implementation: A case study in Indonesian automotive manufacturing. Quality Innovation Prosperity, 27(3): 57-74. https://doi.org/10.12776/QIP.V27I3.1889
[2] Sumasto, F., Imansuri, F., Agus, M., Wirandi, M. (2020). Sustainable development impact of implementing electric taxis in Jakarta: A cost-benefit analysis. IOP Conference Series: Materials Science and Engineering, 885(1): 012027. https://doi.org/10.1088/1757-899x/885/1/012027
[3] Sumasto, F., Arliananda, D.A., Imansuri, F., Aisyah, S., Pratama, I.R. (2023). Fault tree analysis: A path to improving quality in part stay protector a comp. Journal Européen des Systèmes Automatisés, 56(5): 757-764. https://doi.org/10.18280/jesa.560506
[4] Hermansyah, M., Santoso, I., Wijana, S., Fudholi, A. (2021). Implementation of Participatory Rural Appraisal (PRA) in empowering gaplek SMEs using Partial Least Square (PLS) Analysis. International Journal of Sustainable Development & Planning, 16(3): 543-550. https://doi.org/10.18280/IJSDP.160315
[5] Rozak, A., Jaqin, C., Hasbullah, H. (2020). Increasing overall equipment effectiveness in automotive company using DMAIC and FMEA method. Journal Européen des Systèmes Automatisés, 53(1): 55-60. https://doi.org/10.18280/jesa.530107
[6] Sumasto, F., Nugroho, Y.A., Solih, E.S., Arohman, A.W., Agustin, D., Permana, A.K. (2024). Enhancing quality control in the Indonesian automotive parts industry: A defect reduction approach through the integration of FMEA and MSA. Instrumentation Mesure Métrologie, 23(1): 43-53. https://doi.org/10.18280/i2m.230104
[7] Singh, R., Gohil, A.M., Shah, D.B., Desai, S. (2013). Total productive maintenance (TPM) implementation in a machine shop: A case study. Procedia Engineering, 51: 592-599. https://doi.org/10.1016/j.proeng.2013.01.084
[8] Edward, J.G. (2021). Implementation of total productive maintenance with overal equipment effectiveness (OEE) method to determine maintenance strategy for digester plant machines (Case study of PT. Toba Pulp Lestari, Tbk). International Journal of Mechanical Computational and Manufacturing Research, 10(3): 101-110.
[9] Duraisamy, R., Dhanasekaran, C., Ramakrishnan, P.R. (2023). Imeplementation of TPM to improve OEE in SME - A case study. European Chemical Bulletin, 12(1): 528-536.
[10] Zulfikar, M.R., Rizqullah, A.N., Pratama, E.S., Febrianti, S., Al Azhar, F., Anwar, A. (2022). Analysis of total productive maintenance (TPM) using overall equipment effectiveness (OEE) approach on cartoner machine at PT. ABC. Italienisch, 12(2): 459-467.
[11] Ondra, P. (2022). The impact of single minute exchange of die and total productive maintenance on overall equipment effectiveness. Journal of Competitiveness, 14(3): 113-132. https://doi.org/10.7441/joc.2022.03.07
[12] Guritno, J., Cahyana, A.S. (2021). Implementation of autonomous maintenance in total productive maintenance. Procedia of Engineering and Life Science, 1(2): 914. https://doi.org/10.21070/pels.v1i2.914
[13] Saputra, F.A., Rady, M.R. (2023). Increased Productivity of packing machines through implementation of total productive maintenance using the overall equipment effectiveness method case study of PT. GFPJ. Jurnal Serambi Engineering, 8(4): 7155-7159. https://doi.org/10.32672/jse.v8i4.6173
[14] Martomo, Z.I., Laksono, P.W. (2018). Analysis of total productive maintenance (TPM) implementation using overall equipment effectiveness (OEE) and six big losses: A case study. AIP Conference Proceedings, 1931(1): 030026. https://doi.org/10.1063/1.5024085
[15] Sandy, P.M., Wathoni, N. (2022). Implementation of overall equipment effectiveness (OEE) Based on lean manufacturing tools in the Indonesian pharmaceutical industry. Indonesian Journal of Pharmaceutics, 4(1): 158-167. https://doi.org/10.24198/idjp.v4i1.38707
[16] Xiang, Z.T., Chin, J.F. (2021). Implementing total productive maintenance in a manufacturing small or medium-sized enterprise. Journal of Industrial Engineering and Management, 14(2): 152-175. https://doi.org/10.3926/jiem.3286
[17] Sumasto, F., Maharani, C.P., Purwojatmiko, B.H., Imansuri, F., Aisyah, S. (2023). PDCA method implementation to reduce the potential product defects in the automotive components industry. Indonesian Journal of Industrial Engineering & Management, 4(2): 87-98. https://doi.org/10.22441/ijiem.v4i2.19527
[18] Sumasto, F., Nugroho, Y.A., Purwojatmiko, B.H., Wirandi, M., Imansuri, F., Aisyah, S. (2023). Implementation of measurement system analysis to reduce measurement process failures on Part Reinf BK6. Indonesian Journal of Industrial Engineering & Management, 4(2): 212-220. https://doi.org/10.22441/ijiem.v4i2.20212
[19] Sumasto, F., Jiwanto, R.R., Purwojatmiko, B.H., Pratama, I.R. (2023). Implementasi penjadwalan preventive maintenance untuk meningkatkan nilai efektivitas mesin pada mesin CNC milling VL-10i. Journal of Industrial View, 5(1): 23-35.
[20] Manjunatha, B., Srinivas, T.R., Ramachandra, C.G. (2018). Implementation of total productive maintenance (TPM) to increase overall equipment efficiency of an hotel industry. MATEC Web of Conferences, 144: 05004. https://doi.org/10.1051/matecconf/201814405004
[21] Bon, A.T., Lim, M. (2015). Total productive maintenance in automotive industry: Issues and effectiveness. In 2015 International Conference on Industrial Engineering and Operations Management (IEOM), Dubai, United Arab Emirates, pp. 1-6. https://doi.org/10.1109/IEOM.2015.7093837
[22] Irawan, S., Kurniawati, C.A. Febiola, S.D. (2022). Improving the overall equipment effectiveness (OEE) on the chicken bowl printing machine by using the theory of change perspective. E3S Web of Conferences, 348: 00040. https://doi.org/10.1051/e3sconf/202234800040
[23] Herry, A.P., Farida, F., Lutfia, N.I. (2018). Performance analysis of TPM implementation through overall equipment effectiveness (OEE) and six big losses. IOP Conference Series: Materials Science and Engineering, 453(1): 012061. https://doi.org/10.1088/1757-899X/453/1/012061
[24] Karmilawati, E.K., Mulyono, K.M., Nugroho, S.N. (2021). Pendekatan OEE (overall equipment effectiveness) untuk mengurangi losses pada mesin moulding cerex. Jurnal Optimasi Teknik Industri, 3(2): 46-48. https://doi.org/10.30998/joti.v3i2.8576
[25] Sukma, D.I., Prabowo, H. A., Setiawan, I., Kurnia, H., Fahturizal, I.M. (2022). Implementation of total productive maintenance to improve overall equipment effectiveness of linear accelerator synergy platform cancer therapy. International Journal of Engineering, 35(7): 1246-1256. https://doi.org/10.5829/ije.2022.35.07a.04
[26] Nurprihatin, F., Angely, M., Tannady, H. (2019). Total productive maintenance policy to increase effectiveness and maintenance performance using overall equipment effectiveness. Journal of applied research on industrial engineering, 6(3): 184-199. https://doi.org/10.22105/jarie.2019.199037.1104
[27] Zulfatri, M.M., Alhilman, J., Atmaji, F. T.D. (2020). Pengukuran efektivitas mesin dengan menggunakan metode overall equipment effectiveness (OEE) dan overall resource effectiveness (ORE) pada mesin PL1250 di PT XZY. JISI: Jurnal Integrasi Sistem Industri, 7(2): 123-131. https://doi.org/10.24853/jisi.7.2.123-131
[28] Suhendra, S., Wiyatno, T.N. (2022). Peningkatan nilai overall equipment effectiveness pada industri otomotif di indonesia menggunakan metode SMED. Prosiding Sains dan Teknologi, 1(1): 621-629.
[29] Wijaya, C.Y., Widyadana, I.G.A. (2015). Pengukuran overall equipment effectiveness (OEE) di PT astra otoparts tbk. Divisi Adiwira Plastik. Jurnal Titra, 3(1): 41-48.
[30] Sunadi, S., Purba, H.H., Paulina, E. (2021). Overall equipment effectiveness to increase productivity of injection molding machine: A case study in plastic manufacturing industry. ComTech: Computer, Mathematics and Engineering Applications, 12(1): 53-64. https://doi.org/10.21512/comtech.v12i1.6706