Sanusi*![]() | Salleh Ahmad Bareduan
| Salleh Ahmad Bareduan![]() | Larisang
| Larisang![]()
© 2024 The authors. This article is published by IIETA and is licensed under the CC BY 4.0 license (http://creativecommons.org/licenses/by/4.0/).
OPEN ACCESS
The oil and gas industry faces perennial challenges related to cost reduction, product quality enhancement, and operational efficiency. To remain competitive in the market, companies must optimize their production lead times, reduce costs, and ensure high levels of customer service. This study aims to identify and prioritize critical wastes in OCTG production lines to inform operational improvements. This research thoroughly evaluates the existing state of operations and identifies critical areas for improvement by utilizing a combination of Value Stream Mapping (VSM) and Borda Count Methods (BCM). The VSM provides a clear understanding of the complex movement of resources and activities in manufacturing and distributing products, making it easier to identify any inefficiencies. The BCM offers a systematic method to prioritize discovered waste according to its impact and severity. The study's findings expose crucial obstacles and inefficiencies in the production lines of OCTG, with waiting times and defects surfacing as notable areas of concern. By employing BCM, it can prioritize these concerns and derive valuable insights to inform strategic decision-making and operational improvements. The long-term goal of this research is to advance the current efforts of the oil and gas industry in enhancing production processes, reducing costs, and enhancing overall operational efficiency.
lean manufacturing, waste, lead time, Value Stream Mapping, Borda Count Methods
The growth and development of the world's oil and gas drilling equipment supplier (OCTG) industry is increasing, pushing companies to compete for the survival of company growth and operations. The quality of a company is essential and worth considered by consumers in market competition. The quality itself improves the company's reputation, reducing the cost of production, increasing market share, product responsibility, international impact, and the appearance of the product itself. In terms of products, the company must be able to produce goods or services of quality that meet the consumer's demand. Exploring the impact of combining Industry 4.0 technologies and Lean Manufacturing tools on organizational performance has been a popular topic in recent years [1-3].
A good product or service of quality will increase consumer satisfaction while increasing consumer confidence and loyalty to the company. The critical factor that the company will achieve is the profit obtained from its production results. Achieving efficiency is the basis for obtaining the profit the company expects. Many systems are implemented in order to make the company more competitive and in demand by the customer. The term lean production was first introduced by [4]. Lean is a dynamic process of change driven by a systematic set of principles and best practices aimed at continuous improvement [5]. The principles of lean thinking have gained widespread acceptance among production and operation managers and have been successfully implemented across various disciplines [6, 7]. Lean Manufacturing (LM) definitions have been studied and analyzed by researchers and practitioners worldwide. There are 33 definitions of lean manufacturing as the evolution of its ideas, objectives, and scope from 1988 to 2012 [8]. The lean concept emerged in Japan following World War II, as Japanese manufacturers recognized their inability to finance the extensive investments needed to reconstruct their ravaged facilities. Toyota manufactured autos with less inventory, labor, capital, and problems while expanding its range of products. LM enhances manufacturers' competitive advantage by decreasing expenses and enhancing efficiency and excellence. Multiple writers have recorded measurable advantages of using lean practices, including enhancements in production lead time, processing time, cycle time, setup time, inventory management, reduction in defects and scrap, and overall equipment effectiveness. Today, LM is one of the concepts used by many manufacturing companies [2, 9-14]; this approach is derived from the Total Production System (TPS).
Weigel [15] used LM in industries. By using LM, the enterprise can form a productive framework that will make performance more effective and efficient.
Taiichi Ohno, the leader of Toyota, is widely recognized as the founder of the Toyota Production System, which acted as the catalyst for adopting LM in the United States. Many firms utilized the identification of seven categories of waste, including overproduction, waiting time, transportation, over-processing, unneeded inventory, undesired motion, and defects, as a means to enhance their system and productivity [9, 16-19].
Some companies implementing LM can reduce waste and overcome this challenge. LM makes the delivery process more profitable [14, 15]. This philosophy is expected to make the process more responsive to customer demands, reducing different types of waste at the lowest possible cost. Serrano et al. [20] shows that a value stream map developed within a lean paradigm helped practitioners redesign production systems.
PT. XYZ is an industry that supplies oil and gas exploration support equipment. PT. XYZ has implemented a make-to-order/job shop production system where new jobs are carried out when the company receives customer orders. One of its products is producing threading coupling. Coupling is a part of a pipe used in oil and gas exploration that connects the pipe with the next pipe (pipe connection), both ground drilling and offshore drilling. During the operation, it was found that some issues related to waste in the production process occurred frequently. This issue caused delays, unsatisfied customers, and a loss in competition.
Therefore, LM approaches using Value Stream Analysis Tools (VALSAT), Borda Count Method (BCM) [21], Root Cause Analysis (RCA), and Failure Mode and Effect Analyses (FMEA) are practical ways to reduce or eliminate waste that occurs in the coupling production process [7].
Based on the research background, this study focuses on identifying and prioritizing the critical factors causing waste in the production line of coupling PT. XYZ using Value Stream Mapping and Borda Count Method.
2.1 Lean manufacturing
Lean is the concept of side efficiency, and its main goal is to continuously increase customer value through the continuous increase of the value-to-waste ratio (the value-to-waste ratio). The concept of lean is a systematic approach to continuous improvement that emphasizes the reduction of various kinds of unnecessary waste, whether it is waste of activity or waste of resources that do not add value to the product.
It is an important management subject that emphasizes reducing waste in the process, working with lower inventories, avoiding unnecessary investment, and strengthening the overall business by reducing non-value-adding activities.
Identifying waste is crucial in achieving LM. Waste refers to any activity that wastes time, resources, and space without contributing to the satisfaction of requirements. There are seven categories of waste that arise in the manufacturing process. 1) Defect, 2) Unnecessary Inventory, 3) Over-processing, 4) Transportation, 5) Waiting, 6) Unnecessary Motion, 7) Over production. Additionally, it can elevate the likelihood of equipment failure or result in personnel injuries [21-23].
2.2 Value Stream Mapping (VSM)
VSM is one way of achieving constant process improvement through VSM. A value stream is a complete group of some performance containing value-added and non-value-added actions. Used to reduce the lead time of product [10]. The values stream is regarded as the flow of products that is initiated by the raw material and ends by the consumer. The type of activity in the organization can be distinguished into three, namely as follows: 1) Value Adding Activity (VA): This activity can be said to be an activity that adds value, both to the products and services produced by the company; 2) Necessary Non-Value Adding Activity (NNVA), This activity is an activity that should be done but does not give added value to the process that is going on such as compliance, safety, regulatory requirements, paper works, etc. One of the most important components of continuous improvement initiatives meant to maximize value and reduce waste across the whole value stream is identifying and addressing NNVA activities. 3) A non-value-adding activity becomes an activity that will be reduced in the concept of lean thinking. These activities include inspection and surveillance of workers.
2.3 Borda Count Methods (BCM)
The BCM, invented by Jean Charles de Borda, is a direct technique for performing ranking calculations of several alternative options [21]. This approach was employed to assess the magnitude of waste and its impact on the process.
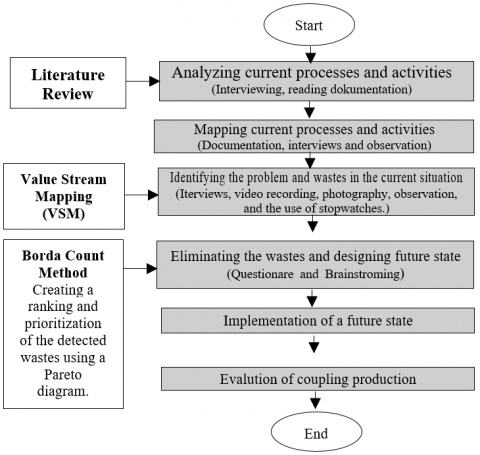
The method used is the approach of LM and VSM. Figure 1 depicts the procedure undertaken to address the research objective, beginning with the analysis of the current process and activities and continuing until the implementation of the improvement process.
Figure 1. Research methodology
Primary data is obtained by employing interviews with Production planning and inventory control (PPIC) officers and Engineers, documentation using a video recorder and camera, and a stopwatch to create the Current State Value Mapping and identify the cause of waste. The Current State Value Mapping was created by collecting production process data in the research object, the cycle time, the number of available times, and waste identification using seven types of waste. Secondary data refers to the company production data and data on rejected products, working hours and number of operators.
To identify the wastes, The following is a list of the seven wastes.
(1) Defect
The threading process has the highest defect rate. Defects can be reduced by employing skilled workers, using the right tools and equipment for a quick setup, and correcting production flaws such as a re-setup tool.
(2) Overproduction
In the event that market demand changes, overproduction increases lead times and the risk of obsolete inventories. Manufacturing produces more coupling than is needed right away, which can result in excess inventory, which requires money and warehousing space.
(3) Waiting Time
Material shortages, Inefficient scheduling, or equipment breakdowns can cause delays between production phases, which can result in idle time for personnel and equipment and lower overall productivity. One way to cut waste is to minimize waiting times by making better use of scheduling and planning.
(4) Excess Inventory
High work-in-progress (WIP), Keeping more raw materials or completed goods on hand than what is required to meet current production demands, can result in waste because of the associated expenses of storage, the possibility of damage or obsolescence, and the tying up of capital.
(5) Transportation
Premature transfer of raw materials or completed goods inside a factory or between sites can waste money, effort, and time. Waste in transportation can be reduced by optimizing material flow and arrangement.
(6) Overprocessing
Excessive machining or other processing stages beyond what is called for by the specifications of the client can lead to time, energy, and resource waste.
(7) Motion Waste
Moving items, overusing tools and equipment, or being around a lot can make workers less productive and put them at higher risk of mistakes. Motion waste can be reduced by setting up workstations properly, putting ergonomic upgrades into place, and offering appropriate training.
PT. XYZ is one of the OCTGs based in Indonesia's Riau Province Island. In its activities, it always strives to maintain quality and improve its production capacity. However, the company is often faced with various obstacles. The obstacle faced by the company, especially the coupling shop department, is not achieving the daily production targets scheduled by the planning production and control department. Based on the production capacity issued by the PPIC department, for a coupling size of 3-1/2 inches in 1 hour, the amount to be produced is 6.9 pcs. The output used as a reference is the output of a threading machine or CNC. The machine capacity in a day (24 hours) is 166 pcs. The daily target given by the PPC department is 70% of the total production for 24 hours. So within a day, the coupling department must produce output for the order of 116 pcs couplings per machine. In the production process, PPC requires output of as much as 348 pcs coupling per day, so the coupling shop department allocates three machines for the manufacturing process. The average achievement is below the target of 66.89% of the 70% target or only capable of producing 9,747 out of 10,200 pcs of coupling. The problem in the coupling shop department of PT. XYZ is not achieving output according to the target by the PPIC department; from the above data, it can be indicated that in the production process, there is still waste due to production delays, waiting, and defects that affect additional costs and reduce production efficiency.
4.1 Current state analysis and problem identification
Some steps to identify waste using VSM, namely:
4.2 Process activity mapping (PAM) is used to present the PPIC department's production process in detail
Activity that lasts during the production process. PAM is a method of visually representing and analyzing the order of activities in a production process. It offers a comprehensive outline of the sequential procedures entailed in manufacturing a coupling, commencing from initiation to completion see Table 1. This tool aims to eliminate unnecessary activity, identify whether a process can be more efficient, and find improvements that can reduce waste.
Table 1. The flow of the current coupling product
|
Activities |
Picture |
Explanation |
Distance |
|
Sawing |
Cutting Material Process for coupling. The raw material is a 12-meter-long pipe-shaped coupling material cut into a 180-mm-sized coupler material. For a 3.5-inch coupler product, the material can be divided into about 65 couplings |
15 meters |
|
|
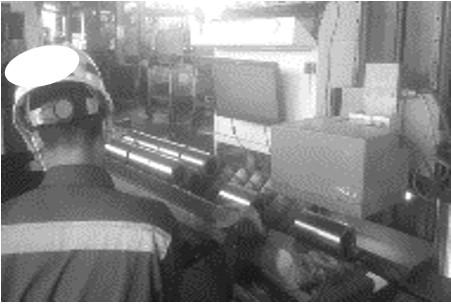
OD Machining |
The process of coating the outer part of the coupling material with the coating process using a CNC machine. The coating is done to obtain the size of the coupling according to the requested specifications. The OD machining process can be seen. |
10 meters |
|
|
Marking Machine |
Giving an identity to the coupler. This identity is a product requirement that will be used from the beginning of the production process until the product is subsequently shipped and used by the customer |
10 meters |
|
|
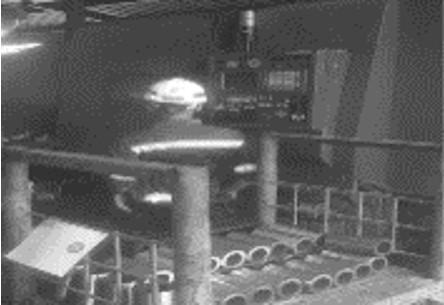
Threading |
Threading is the process of making a thread on the coupling. It is made using an automated CNC machine. According to its function, coupling is a pipe connector with a threading system. |
30 meters |
|
|
MPI |
Inspection process to detect any damage or defect to the coupling product both on the surface of the inner and outer tubes |
20 meters |
|
|
Phosphating |
Laying of the tubes to protect them from rust and also improving the performance of couplings when connected to the pipes |
10 meters |
|
|
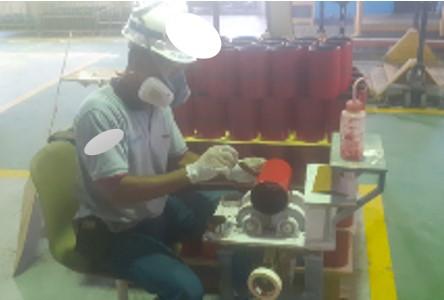
Painting |
The process of giving the standard color identity to the coupling according to the material hardness. The process is carried out by coating the outer part of the coupling with special paint according to the specified standard |
50 meters |
|
|
Storage |
Store the final product |
n/a |
4.3 Identification of waste occurrence
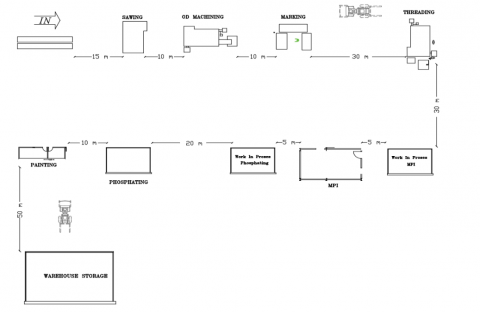
Each process identifies the waste present in the production process by analyzing cycle time, lead time and uptime. To identify the wastes, the distances and the production layout were important to be determined in early state. Lay out of coupling department is shown in Figure 2.
4.4 Distribution of the Borda Count Method questionnaire
After identifying the waste occurring on the basis of seven wastes, the priority waste selection is made and followed by the BCM. This is done by spreading queries to the parts related to the coupling production process in the coupling shop.
The manufacturer must calculate the time required to meet the customer's request for a specific quantity of units, taking into account the speed at which they can produce them. The customer requires a total of 116 couplers per machine on a daily basis. This statistic is derived from the CNC threading machine's capacity. In the production process, two shifts are employed, each lasting for 10.5 hours. The daily working time is determined by multiplying 10.5 by 2 and then multiplying the result by 3600, yielding 75,600 seconds or 1,260 minutes. According to the production data from February 2022, the expectations of customers.
$\text {Takt time} =\frac{\text { Working hours per day }}{\text { Customer demand }}=\frac{75.600}{116}=651.7$ second /pcs
Based on the calculation, the takt time was 651.7 seconds or 10.87 minutes. Takt time calculation relates to the amount of demand from the customer each month, so the size of the takt time can vary according to the actual customer's request, and depending on the coupling size done, therefore continuous improvement must always be made in order to meet the demand of the customer of a fluctuating nature.
Figure 2. Lay out of coupling department
5.1 Data collection
Gathering data through observation, interviews, and team discussions provides a thorough method for comprehending and analyzing the production process. The process flow of connecting the product is depicted in Table 1. The procedure commences with the act of sawing and concludes with the act of storage.
In addition, the data processing involves analyzing defects, measuring uptime, calculating distances, optimizing layouts, determining takt time and cycle time, and managing the production schedule, among other tasks.
Relevance distance and lead time are fundamental notions in the field of production planning and scheduling. Relevance distance pertains to the duration required for alterations in demand or supply to impact production choices, enabling prompt modifications to production strategies. Figure 2 displays the current layout of the coupling department, depicting the flow from the inlet to the storage area.
Lead time refers to the duration between when an order is placed and when it is delivered, and it is influenced by factors such as production capacity and inventory levels. Both principles, namely aligning production operations with market demand and ensuring timely delivery, are crucial for synchronizing output with market needs and guaranteeing punctual shipment.
Product defect data is required to determine the quality rate in each area or to couple production processes in a single production process. Table 2 shows product defects and operational uptime for February 2022. From the table, it can be seen that the highest number of defects is at Threading (29), followed by OD Machining (3), Sawing (2), and Phosphating (2), and the rest had no defects. The more defects there are, the lower the quality rate.
Elevated defect rates can have a substantial impact on the efficiency of production, the effectiveness of quality control systems, customer satisfaction, supply chain management, and the cost associated with poor quality (COPQ). They contribute to elevated expenses in rework, repair, and scrap, resulting in extended lead times and escalated costs. Analyze the defect rates to determine if there is a requirement for expanded quality control processes, improved inspection procedures, more stringent standards, or greater training for production staff. Deficiencies might also impede the flow of goods, impacting the connections with suppliers and customers. Examining the frequencies of flaws aids in identifying the underlying causes and mitigating the occurrence of future defects.
Uptime refers to the amount of time a machine is operational during a given day. Uptime was calculated from the total amount of time a machine actually ran versus the time it was scheduled to run. In Table 2, the lowest uptime, which was at Threading, had a rate of 63.65% when compared to the other process.
Table 2. Information regarding product defects and uptime
|
No |
Process |
No of Product (pcs) |
No of Defect (pcs) |
Quality Rate |
Scheduled Time (Minute) |
Actual Run (Minute) |
% Uptime |
|
1 |
Sawing |
2.401 |
2 |
99,9% |
1260 |
1096.2 |
87 |
|
2 |
OD Machining |
2.398 |
3 |
99,8% |
1260 |
1246.9 |
98.96 |
|
3 |
Marking |
2.398 |
0 |
100% |
1260 |
1248.2 |
99.06 |
|
4 |
Threading |
2.365 |
29 |
98,8% |
1260 |
802.0 |
63.65 |
|
5 |
MPI |
2.365 |
0 |
100% |
1260 |
1231.7 |
97.75 |
|
6 |
Phosphating |
2.365 |
2 |
99,9% |
1260 |
1181.3 |
93.75 |
|
7 |
Painting |
2.365 |
0 |
100% |
1260 |
1207.5 |
95.83 |
|
8 |
Stencil Marking |
2.365 |
0 |
100% |
1260 |
1225.9 |
97.29 |
5.2 Data calculation
After acquiring the essential data, the subsequent action involved doing calculations utilizing the designated formula. The quality rate was calculated by dividing the number of defects by the number of products produced and then multiplying by 100. For example, (2/2401)×100=99.9%. The uptime was calculated by dividing the actual time by the scheduled time and then multiplying by 100. For instance, (1096.2/1260)×100=87%. These calculation results can be found in Table 2.
Upon completion of the data-collecting process, the current VSM was created, as depicted in Figure 3. VSM analysis is a technique employed to visually depict and evaluate the present state of a manufacturing process within the coupling department. The objective of this is to identify inefficiencies, wastage, and potential areas for enhancement. The VSM drawing process, as previously said, begins with client demand and concludes with product shipping. Cycle time was measured using a stopwatch during the production process. The process of sawing to shipment takes ten days, with a total value-added time of 2291.15 seconds. The identification NNVA has a score of 78.13%. It signifies that further enhancement is still necessary.
Process activity mapping
Activity taking is also seen and compared with the existing Standard Operation Procedure (SOP). It also documents activities carried out outside the SOP so that it can be clearly seen what activity the operator carries on a waste. Grouping activities are divided into five categories, namely:
O=Operation, T=Transportation, I=Inspection, S=Storage, and D=Delay.
PAM classification can be categorized into three categories, namely, value-added activity (VA), non-value added or non-valued activity (NVA), and activities that are not value-added but necessary in the production process (NNVA). NNVA activities are tasks or processes in a production system that do not directly create value for the client; however, they are considered essential for the functioning of the system. These operations are crucial for ensuring safety, adhering to regulations, and maintaining the general functionality of the process, although not directly impacting product quality or customer satisfaction.
Figure 3. Current VSM
Table 3. Process activity mapping
|
No |
Activities |
Time (Minute) |
Activities |
Classification |
||||||
|
O |
T |
I |
S |
D |
VA |
NVA |
NNVA |
|||
|
1 |
Material inspection on sawing cabinet |
10 |
|
|
x |
|
|
|
|
x |
|
2 |
Insert material to rak sawing |
12 |
|
x |
|
|
|
|
|
x |
|
3 |
Mapping the measurement and number of coupling |
40 |
x |
|
|
|
|
|
x |
|
|
4 |
Insert the pipa to rak sawing |
1 |
x |
|
|
|
|
|
|
x |
|
5 |
Measure coupling using a caliper |
2 |
x |
|
|
|
|
|
|
x |
|
6 |
Process of sawing |
5.83 |
x |
|
|
|
|
x |
|
|
|
7 |
Check the sawing output using a caliper |
1 |
|
|
x |
|
|
|
|
x |
|
8 |
Put the cut to trolly |
0.16 |
x |
|
|
|
|
|
|
x |
|
9 |
Send the material to OD machining using a hand jack |
5 |
|
x |
|
|
|
|
|
x |
|
10 |
Write down the coupling in the report |
0.5 |
x |
|
|
|
|
|
x |
|
|
11 |
Take the material from rak |
0.5 |
x |
|
|
|
|
|
|
x |
|
12 |
The process at OD Machining |
0.72 |
x |
|
|
|
|
x |
|
|
|
13 |
Measure coupling dimension |
0.5 |
|
|
x |
|
|
|
|
x |
|
14 |
Pull out material from machine to trolley |
0.15 |
x |
|
|
|
|
|
|
x |
|
15 |
Marking identity/coupling number |
0.15 |
|
|
|
|
|
x |
|
|
|
16 |
Send the material to the machine using a hand jack |
5 |
x |
|
|
|
|
|
|
x |
|
17 |
Unload material from the trolley |
0.15 |
x |
|
|
|
|
|
|
x |
|
18 |
Insert data number coupling to machine marking |
0.15 |
x |
|
|
|
|
x |
|
|
|
19 |
marking processing |
0.67 |
x |
|
|
|
|
x |
|
|
|
20 |
Load material to trolley |
0.1 |
x |
|
|
|
|
|
|
x |
|
. |
|
|
|
|
|
|
|
|
|
|
|
. |
|
|
|
|
|
|
|
|
|
|
|
63 |
Wrapping material for packaging |
10 |
|
|
|
|
|
|
|
x |
|
64 |
Sending material end-finishing |
15 |
|
x |
|
|
|
|
|
x |
|
|
Total |
|
|
|
|
|
|
11 |
3 |
50 |
Based on the production process mapping described in Value Stream Mapping in Figure 3, it can be seen that to produce a coupling with a total of 116 pcs, the process lead time is ten days. This is because the process is only the process of receiving raw material into the production input. The lead time measured in a VSM begins when the raw material begins to enter the production phase to become a final product; that is, it begins as the sawing process arrives with the stencil marking process.
The mapping of process activities according to their classification is shown in Table 3. For example, the material inspection task for sawing cabinets required ten minutes. This activity is categorised as non-value-added (NNVA) and falls under the "inspection" category.
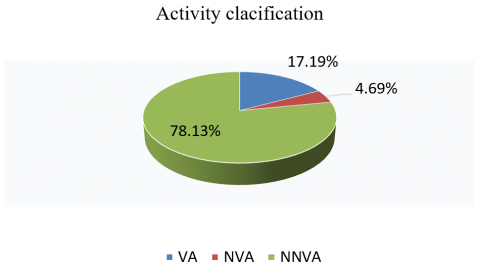
The percentage of activity based on the number of activities and the time of activity can be seen in Table 4 below. The total number of activities is 64, including activities with added value or VA of 11 activities, that is, activity operations with a percentage of 17.19%, activity with no added value, or NVA of three activities with a percentage of 4.69%. Activities without added value (NNVA) consist of 50 activities, including storage, inspection, and transport activities, with a percentage of 78.13%. Investing in a discussion on non-value-added activity (NNVA) can significantly enhance the efficiency of the production process. Through the elimination of these operations, firms can achieve cost reduction, enhance operational efficiency, elevate quality standards, and foster higher levels of employee engagement. By prioritizing jobs that provide additional value, they can decrease the duration of cycles and enhance overall operating efficiency.
Furthermore, engaging in NNVA operations has the potential to enhance product quality, minimize faults, and augment customer satisfaction. By cultivating a culture that promotes sustainable enhancement, firms can effectively adjust to evolving market conditions, customer preferences, and technological advancements. In general, the actions of NNVA can be identified and improved in order to provide more value to customers.
Table 4. Summary of activity and time
|
Activities |
Amount |
Percentage |
Time |
Percentage |
|
VA |
11 |
17,19% |
38,19 |
15,51% |
|
NVA |
3 |
4,69% |
53 |
21,53% |
|
NNVA |
50 |
78,13% |
155,03 |
62,97% |
|
Sum |
64 |
100% |
246.22 |
100% |
Figure 4. Activity classification percentage
Based on percentage based on time, the activity has an added value of 38.19 minutes with a percentage of 15.51%. The activity that does not have an added value is 53 minutes or 21.53%, see Figure 4. The non-added value of this activity is in the sawing process. There are two activities that do not have added value but have the same result: the mapping activity before sawing and the measurement activity using the caliper before cutting. The inefficient mapping activity takes about 40 minutes in a single pipe material-cutting process. The activity which has no value added requires 155.03 minutes or 62.97%. Based on the results of the process activity mapped, the production process proves that there is still much invaluable activity that needs to be done. Critical Waste Determination with BCM.
Figure 4 presents the highest of number of actitivity was non-value-added activity (NNVA) followed by Non Value (NVA) activity and value added (VA). This suggests some activities are not professional, it could imply that there are areas in the process that may not be adding value or may not be meeting professional standards.
Figure 5 illustrates that non-value-added (NNVA) activities make up 62.97% of the total time spent, with non-value-added (NVA) activities coming in at 21.53% and value-added (VA) 15.51%. This distribution indicates that actions that do not immediately add value to the end product.
Figure 5. Activity classification based on time
The critical waste determination is done by determining overproduction, defects, unnecessary inventory, inappropriate processing, excessive transportation, waiting, and unnecessary motion, using the Borda Count Method. The use of this BCM method by distributing a questionnaire (Appendix 1) to respondents of five people to the related and directly responsible parts of the production process, i.e., supervisor of production, inventory raw material in this case, supervisor yard, production planning control (PPC), quality assurance (QA), and inventory finish part or warehouse. The score requirement is that one (1) is the highest value or waste that often occurs, while seven (7) is the lowest or waste that rarely occurs in the process on the production floor. The results of the BCM seven (7) waste questionnaire can be seen in Table 5.
Table 5. BCM respondent's score
|
Waste Category |
|
Respondents |
||||
|
Code |
Resp 1 (PPC) |
Resp 2 (Prod) |
Resp 3 (QA) |
Resp 4 (Yard) |
Resp 5 (Store) |
|
|
Overproduction |
O |
3 |
6 |
4 |
5 |
5 |
|
Defects |
D |
1 |
2 |
1 |
2 |
1 |
|
Unnecessary inventory |
UI |
4 |
7 |
3 |
4 |
3 |
|
Inappropriate Processing |
IP |
6 |
5 |
7 |
5 |
7 |
|
Excessive Transportation |
ET |
3 |
4 |
4 |
7 |
1 |
|
Waiting |
W |
1 |
2 |
2 |
1 |
2 |
|
Unnecessary Motion |
UM |
7 |
2 |
6 |
2 |
6 |
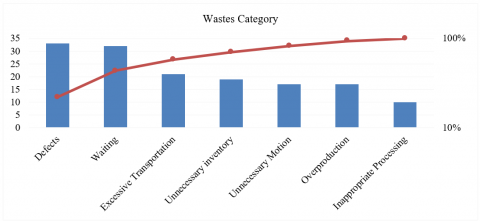
The BCM assigns scores ranging from one (1) to seven (7). The higher the score, the higher the waste rate. Table 6 clearly indicates that the defect is the most prevalent issue, followed by waiting, excessive transportation, unnecessary inventory, overproduction, unnecessary motion, and, finally, inappropriate processing. The score was established by respondents who were actively involved, such as PPC, QA, Production, Yard, and Store person in charge. All of them provided scores as indicated in Table 6. Figure 6 displays the waste using a Pareto diagram to determine the impact of the actions done on the waste.
Table 6. Questionnaire result of BCM
|
Waste Category |
Score |
Rank |
|
O |
17 |
5 |
|
D |
33 |
1 |
|
UI |
19 |
4 |
|
IP |
10 |
7 |
|
ET |
21 |
3 |
|
W |
32 |
2 |
|
UM |
17 |
6 |
Figure 6. Waste category
Based on the results of the critical waste identification questionnaire with the BCM, we obtained the two highest critical ratings of waste waiting with a score of 33 and waste defects with a point of 32, then critical wastes that urgently need to be dealt with on the production floor of PT. XYZ is wasted waiting and wasted defect.
6.1 Defect wastes
Defect waste in the threading process is closely associated with waiting time. The leading cause is the production delay caused by the necessity to reset due to damage. This damage not only causes delays in production but also adds to the occurrence of waste flaws during the threading process. Hence, it is imperative to tackle faulty waste in order to minimize manufacturing process delays and enhance overall efficiency.
6.2 Waiting waste
During the process of sawing, an additional type of waste was identified: non-value-added operations. More precisely, two actions were identified as having no added value yet still leading to the same outcome. The tasks encompass the first mapping procedure performed before sawing, as well as the measurement process employing a caliper prior to cutting. The mapping task, specifically, is inefficient and requires around 40 minutes to finish for a single procedure of cutting pipe material. It is crucial to identify and solve these actions that do not contribute value in order to optimize efficiency and minimize waste in the sawing process.
Both of these wastes have a significant impact on important areas of the PT. XYZ production floor is the area of CNC threading. The waste waiting on the threading process, which is closely related to the waste defect, is the inhibition of the production process caused by the re-set-up tool due to damage. According to experts at the company, waste waiting and waste defects are a priority to be resolved and dealt with immediately.
Although this study did not prioritize other types of waste, focusing on the two specific wastes found in the threading is anticipated to have a more extensive influence. Addressing these primary sources of waste can lead to enhanced efficiency and process optimization that will have a positive impact on the overall production system. This method acknowledges the interdependent relationship between waste in manufacturing processes, wherein targeting one aspect of inefficiency might result in subsequent enhancements throughout other areas. Hence, although the initial emphasis is on certain forms of waste, the eventual objective is to achieve a broader and more enduring enhancement in total waste reduction and process optimization.
By employing Value Stream Mapping (VSM), it is apparent that the lead time was ten days. After examining all processes, it was found that the threading process had the highest defect rate, with 29 defects. This was followed by OD machining with three (3) errors, sawing with two (2) defects and Phosphorating with two (2) defects. The defect rate of threading is 98.8%, which is lower compared to other processes due to a defect problem. By employing the Borda Count Method, it was established that faults and waiting wastes had paramount significance and were impeding the company's capacity to achieve its objective. VSM is a strategic methodology that surpasses simple visualization in order to enhance processes. This organization leverages its capacities to foster positive transformation, foster cooperation, and cultivate a culture of ongoing improvement, enabling it to sustain success in the present competitive environment. VSM entails not only visualizing processes but also strategically utilizing them to enable positive transformation, promote collaboration, and develop a culture of ongoing improvement. To align with the organization's objectives, it is advisable for the firm to prioritize correcting defects and minimizing waiting times. By adopting these suggestions and cultivating an environment that values ongoing enhancement, the organization may establish a strong position for long-term success and competitiveness in the dynamic market environment.
The authors would like to thank Universiti Tun Hussein Onn Malaysia and Universitas Ibnu Sina for partially supporting and sponsoring the research.
[1] Horsthofer-Rauch, J., Schumann, M., Milde, M., Vernim, S., Reinhart, G. (2022). Digitalized value stream mapping: Review and outlook. Procedia CIRP, 112: 244-249. https://doi.org/10.1016/j.procir.2022.09.079
[2] Habib, M.A., Rizvan, R., Ahmed, S. (2023). Implementing lean manufacturing for improvement of operational performance in a labeling and packaging plant: A case study in Bangladesh. Results in Engineering, 17: 100818. https://doi.org/10.1016/j.rineng.2022.100818
[3] Sullivan, B.P., Yazdi, P.G., Suresh, A., Thiede, S. (2022). Digital value stream mapping: Application of UWB real time location systems. Procedia CIRP, 107: 1186-1191. https://doi.org/10.1016/j.procir.2022.05.129
[4] Krafcik, J.F. (1988). Triumph of the lean production system. Sloan Management Review, 30(1): 41-52.
[5] Womak, J.P., Jones, D.T., Roos, D. (1990). The Machine that Changed the World: The Triumph of Lean Production. New York: Rawson Associates.
[6] Al-Esmael, B., Talib, F., Faisal, M.N., Jabeen, F. (2020). Socially responsible supply chain management in small and medium enterprises in the GCC. Social Responsibility Journal, 16(3): 369-386. https://doi.org/10.1108/SRJ-09-2017-0174
[7] Shabeen, S.R., Krishnan, K.A. (2022). Application of lean manufacturing using value stream mapping (VSM) in precast component manufacturing: A case study. Materials Today: Proceedings, 65: 1105-1111. https://doi.org/10.1016/j.matpr.2022.04.159
[8] Bhamu, J., Singh Sangwan, K. (2014). Lean manufacturing: Literature review and research issues. International Journal of Operations & Production Management, 34(7): 876-940. https://doi.org/10.1108/IJOPM-08-2012-0315
[9] Sugito, E., Hadiguna, R.A., Hasibuan, R.P. (2021). Identification material distribution process to improve material handling performance using risk matrix analysis (Case Study at Paper Manufacturing). In Annales de Chimie Science des Materiaux, 45(5): 369-378. https://doi.org/10.18280/acsm.450502
[10] Tyagi, S., Choudhary, A., Cai, X., Yang, K. (2015). Value stream mapping to reduce the lead-time of a product development process. International Journal of Production Economics, 160: 202-212. https://doi.org/10.1016/j.ijpe.2014.11.002
[11] Huang, C.Y., Lee, D., Chen, S.C., Tang, W. (2022). A lean manufacturing progress model and implementation for SMEs in the metal products industry. Processes, 10(5): 835. https://doi.org/10.3390/pr10050835
[12] Schoeman, Y., Oberholster, P., Somerset, V. (2020). Value stream mapping as a supporting management tool to identify the flow of industrial waste: A case study. Sustainability, 13(1): 91. https://doi.org/10.3390/su13010091
[13] Suparno, A., Kholil, M., Hasan, S.B.H. (2021). Implementation of lean manufacturing and waste minimization to overcome delay in metering regulating system fabrication process using value stream mapping and VALSAT method approach (Case Study: Company YS). International Journal of Advanced Technology, 2(1): 22-34. https://doi.org/10.37869/ijatec.v2i1.41
[14] Ramakrishnan, V., Jayaprakash, J., Elanchezhian, C., Ramnath, B.V. (2019). Implementation of lean manufacturing in Indian SMEs-A case study. Materials Today: Proceedings, 16: 1244-1250. https://doi.org/10.1016/j.matpr.2019.05.221
[15] Weigel, A.L. (2000). A Book Review: Lean Thinking by Womack and Jones. Review Literature and Arts of the Americas.
[16] Eleazar, C., Olivares-benitez, E., Minor-popocatl, H. (2019). Applied sciences implementation of lean manufacturing to reduce the delivery time of a replacement part to dealers.
[17] Suhardi, B., Hermas Putri KS, M., Jauhari, W.A. (2020). Implementation of value stream mapping to reduce waste in a textile products industry. Cogent Engineering, 7(1): 1842148.
[18] Fercoq, A., Lamouri, S., Carbone, V. (2016). Lean/Green integration focused on waste reduction techniques. Journal of Cleaner Production, 137: 567-578. https://doi.org/10.1016/j.jclepro.2016.07.107
[19] Putri, N.T., Dona, L.S. (2019). Application of lean manufacturing concept for redesigning facilities layout in Indonesian home-food industry: A case study. The TQM Journal, 31(5): 815-830. https://doi.org/10.1108/TQM-02-2019-0033
[20] Serrano, I., Ochoa, C., Castro, R.D. (2008). Evaluation of value stream mapping in manufacturing system redesign. International Journal of Production Research, 46(16): 4409-4430. https://doi.org/10.1080/00207540601182302
[21] Saari, D.G. (2023). Selecting a voting method: The case for the Borda count. Constitutional Political Economy, 34(3): 357-366. https://doi.org/10.1007/s10602-022-09380-y
[22] Chen, J.C., Li, Y., Shady, B.D. (2010). From value stream mapping toward a lean/sigma continuous improvement process: An industrial case study. International Journal of Production Research, 48(4): 1069-1086. https://doi.org/10.1080/00207540802484911
[23] Hines, P., Rich, N. (2005). The seven tools for value stream mapping. Applied Mechanics and Materials, 17(1): 553-564.