Mahesh Singh![]() | Shimpy Ralhan*
| Shimpy Ralhan*![]() | Mangal Singh
| Mangal Singh![]() | Rajkumar Jhapte
| Rajkumar Jhapte![]() | Pritha Gupta
| Pritha Gupta![]() | Ansha Goyal
| Ansha Goyal![]()
© 2024 The authors. This article is published by IIETA and is licensed under the CC BY 4.0 license (http://creativecommons.org/licenses/by/4.0/).
OPEN ACCESS
This paper provides a concise overview of research and techniques aimed at enhancing the performance of wind power systems, with a focus on mitigating power quality concerns. Although wind energy has become a more substantial component of the world's energy mix, there are still concerns because wind resources are naturally variable, especially when it comes to electricity quality. The paper highlights the potential of wind energy in reducing greenhouse gas emissions and meeting rising electricity demand. In order to improve overall effectiveness in wind power generation, the study emphasizes optimization methodologies and emphasizes the significance of control systems for wind turbines in maximizing power output, adjusting to changing wind conditions, and addressing power quality issues. A grid connected system incorporating the wind power system network along with D STATCOM is modelled with proportional-integral (PI) controller and detailed comparative total harmonic distortion (THD) analysis has been done for various faults. The STATCOM is tuned with genetic algorithms (GA), ant colony optimization (ACO), and harmony search (HS) based PI controller as a control device to achieve the desired power quality. Leveraging ACO for mitigating THD in wind systems under fault conditions holds promise for substantial enhancements in power quality. This approach has the potential to safeguard equipment, improve system reliability, and contribute to overall performance.
power quality issues, total harmonic distortion, optimization technique, wind energy
Wind power systems have become a pivotal component of global energy generation, offering sustainable and renewable electricity. However, their performance can be significantly affected by various factors, including the presence of different types of faults within the electrical grid. These faults can lead to fluctuations in power quality, grid instability, and even damage to wind turbine components. To address these challenges, optimization techniques have emerged as a promising approach to enhance the performance of wind power systems.
The wind turbine is established in seventh century A.D. The first English recorded wind turbine data is from A.D. 1191 [1]. In the year 1439, in Netherlands the first wind grinding turbine was built. The first electrical energy was generated in Denmark by wind turbine in 1890, with 23 meter diameter wind turbine. In the year 1910, in Denmark 5 to 25KW capacity wind turbines were in function.
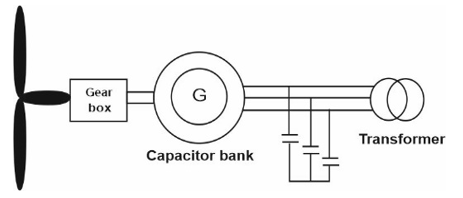
The kinetic energy of the air is converted into spinning mechanical energy to power the wind turbine [2]. In order to have more energy, a few fixed-speeds wind mill have two dissimilar rotating speeds. This is attained either via one or two generator through two windings explained by the studies [3, 4] which is illustrated in Figure 1.
Figure 1. Wind turbine with fixed-speed
Figure 2. Wind turbine with variable-speed
The structure and the main components in wind turbines working in a limited variable-speed area are parallel to fixed-speed wind mill [5] and the wind generator works in a limited speed area which has usually a double fed induction generator (DFIG) with a converter linked to the circuit of rotor. And, the generator’s rotating speed fluctuates around 1000 rpm or 1500rpm, hence a gearbox is essential.
Figure 2 illustrates the major parts of a wind turbine with a large direct-driven generator and a wide variable-speed area.
The intermittent and variable nature of wind resources introduces unique challenges to the stable integration of wind power into the grid. Power quality issues such as voltage fluctuations, harmonics, and grid instability can arise, impacting the reliability and performance of both wind power systems and the broader electrical infrastructure. Power quality refers to the consistency, reliability, and stability of the electricity supply. Ensuring high power quality is essential for the efficient operations of electrical appliances and industrial equipment, as well as the overall reliability of the power grid. Power quality issues can lead to increased maintenance costs, reduced equipment lifespan, and operational disruptions. To fully harness the potential of wind power and facilitate its seamless integration into the grid, it is imperative to address power quality issues. This requires innovative strategies, cutting-edge technologies, and a multifaceted approach to enhancing the performance of wind power systems.
In order to regulate the load side disturbances, the distribution static compensator (D-STATCOM) is essentially a shunt coupled solid state device deployed at the Distribution level. In 1999, a static VAR compensator with a voltage source converter (VSC), the first D-STATCOM, was used. Additionally, a D-STATCOM can function as a parallel active filter to minimize imbalanced current in the source or changes in the supply voltage, as shown in the study [6]. Basic Structure and schematic representation of the D-STATCOM is shown in Figure 3 and Figure 4, respectively.
Figure 3. Basic structure of the DSTATCOM
Figure 4. Block diagram of the D-STATCOM
The DSTATCOM's primary elements are voltage source converter, energy storage Device, L-C passive filter, coupling transformer & control block.
PI controllers are widely used in power electronics and automation systems to regulate various parameters and maintain stable operation. This introduction provides an overview of how PI controllers can be employed to improve power quality. Harmonics, which are undesirable frequency components superimposed on the fundamental frequency, can distort waveforms and disrupt power quality. PI controllers can be employed in DSTATCOM and harmonic compensators to mitigate harmonics. By continuously analyzing the harmonic content of the current or voltage and generating compensating signals, PI controllers can help reduce harmonic distortion and ensure a cleaner power supply. Fluctuations in renewable energy generation can impact voltage and frequency, requiring dynamic control. PI controllers are instrumental in regulating inverters and converters in renewable energy systems, ensuring seamless integration with the grid and stable power quality.
The use of PI controllers combined with optimization techniques is one efficient method for addressing power quality issues. Particle swarm optimization (PSO), ACO, and GA, among others, have become popular for handling complicated control and parameter tuning issues. These techniques can be integrated with PI controllers to optimize control settings dynamically, ensuring optimal performance under varying conditions. Voltage regulation is crucial for maintaining power quality. PI controllers, when coupled with optimization algorithms, can continuously adjust control parameters to respond to voltage fluctuations effectively. Harmonics can distort waveforms and impact power quality. Combining PI controllers with optimization techniques enables the development of advanced harmonic filters and compensators. These systems can detect harmonic distortions in real-time and adjust filter parameters dynamically to mitigate harmonics efficiently. Anita and Babypriya [7] centred on developing a cutting-edge multi-microgrid connection that makes use of power compensation techniques to enhance voltage profiles and lower harmonic distortions using specialised compensation devices in low inertia systems. The study [8] shows that the wind farm's performance is enhanced by the golden eagle optimization technique when compared to observed events and other techniques. Kumar et al. [9] describes how the Golden Eagle Optimization-based control technique can be utilized to improve the performance of renewable energy in the energy storage, microgrid, and two-area systems. In order to improve results, the harmony search algorithm (HSA) and the invasive weed optimization (IWO) are used to compare the performance of the static synchronous compensator (STATCOM) [10]. MATLAB/SIMULINK is used to create a power system model of a wind generation system, and the two methods are then compared [11]. To estimate the switching signals for the DSTATCOM, the suggested control strategy takes into account changes linked to the grid's strength, wind speed, load currents, and dc-link voltage dynamics [12] enhances voltage stability and reduces power quality issues. Magesh et al. [13] presented modelling for various applications .and modelling of the DFIG for fault simulations with modelling of various control parameters used for the study using different software’s like PSCAD, DIgSilent, MATLAB/Simulink. The study [14] demonstrates improved power quality by reducing voltage fluctuations. And utilizes model predictive control (MPC) to optimize wind turbine generator operation for voltage regulation.
The main contributions of this research are outlined as follows:
• To maintain the power quality by improving the power factor, reducing THD in wind energy generating system using PI based tuned controllers.
• To simulate the D-STACOM using tuned PI controller by improving the power quality.
• To improve the efficiency of the grid-connected wind energy conversion system and offer quick relief from a variety of power quality issues such voltage stabilization, reactive power compensation, and harmonic reduction.
The D-STATCOM based voltage source current control inverter injects the current in the power system. Due to this injection of current by D-STATCOM, the source current is free from harmonics and the phase-angle concerning to voltage source have a preferred rate. The current injection negates reactive as well as the harmonic load; & also current at induction machine, therefore it improves the power factor and also, the quality of power.
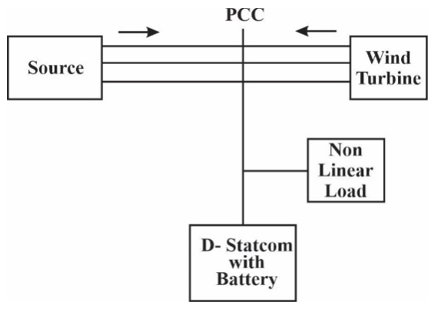
To achieve an objective, voltages at the network system are identified as well as the voltages are coordinated for producing an inverter current control. The recommended power grid linked structure is executed for quality power enhancement at common coupling position shown in Figure 5. D-STATCOM is a component of the power grid-linked system that is linked to a battery energy storage system and a wind turbine energy conversion system.
Figure 5. Grid connected system
2.1 Wind turbine energy generating system
Variable-speed wind turbine generators (VSWTGs), exemplified by dual-fed induction generators (DFIGs) and permanent magnet synchronous generators (PMSGs), have witnessed a substantial increase in market share in recent years. This can be attributed to their notable attributes of high efficiency and easily controllable performance across a broad spectrum of wind speeds. Typically, a VSWTG is linked to the grid through power electronic converters. Consequently, its rotational speed is uncoupled from the system frequency, and it lacks the capacity to contribute rotational inertia to the main power grid [15, 16].
Due to its simplicity in proposed system, the DFIG is employed. It provides the safety at short circuited conditions. The produced power in wind mill system is given in (1).
${{P}_{wind}}=\frac{1}{2}\rho AV_{wind}^{3}$ (1)
The extraction of entire kinetic energy is not possible by the wind mill, so it removes only a portion of the wind power. It is called as wind turbine power coefficient (Cp). The wind mill power coefficient is given by (2).
${{P}_{mech}}={{C}_{p}}{{P}_{wind}}$ (2)
where, $C_p$ is Power Coefficient.
The value of power coefficient depends on the type of the turbine as well as the operating state of the wind turbine. A ratio of tip speed $\lambda$ as well as $\theta$ pitch angle is demonstrated by power coefficient. The wind generator mechanical power is specified in (3).
${{P}_{mech}}=\frac{1}{2}II{{R}^{2}}v_{wind}^{3}{{C}_{p}}$ (3)
The wind mill is distinguished by the power coefficient dimensionless curve of both blade pitch angle (β) and the ratio of tip speed (λ). To completely use obtainable wind mill energy, keep the value of λ at optimal value. Therefore, the power coefficient equivalent to that rate will be optimal. The proportion between the wind mill angular velocity of the rotor and the linear wind mill velocity at the blade tip is denote as tip speed ratio (λ). It is illustrated in (4).
$\lambda ={{W}_{t}}R/{{V}_{w}}$ (4)
The output power of the wind mill ($P_t$) is the function of rotor and wind velocity as well as the blade angle and is shown in (5).
${{P}_{t}}=\frac{1}{2}\rho A{{C}_{p}}\left( \lambda ,\beta \right)V_{w}^{3}$ (5)
In general, the correlation of speed of wind and the extraction of the mechanical power by wind mill is illustrated in (6).
${{p}_{wt}}=\frac{p}{2}{{A}_{wt}}{{C}_{p}}\left( \lambda ,\beta \right)v_{w}^{3}$ (6)
In all wind turbines, the power coefficient is dissimilar and it is relation to the ratio between tip speed ($\lambda$) as well as pitch angle ($\beta$).The performance coefficient shown in (7).
${{C}_{p}}=\frac{1}{2}\left( \lambda -0.022{{\beta }^{2}}-5.6 \right){{e}^{-0.17\lambda }}$ (7)
The wind turbine model, mechanical drive train and the DFIG model is illustrated in below Figure 6.
Figure 6. Schematic diagram of typical wind mill system
2.2 D-STATCOM with PI controller
D-STATCOM is shunt connection VAR power compensating apparatus. It has the capacity to generate the reactive power as well as absorb the reactive power in variable output condition to manage the electrical power system parameters as exact. Generally, it is a solid state controlled converter. Separately, it has the capability to generate or absorb controllable true or VAR power at the terminal of the output when it is supplied from the energy storing device at terminal of the input [17]. To supply a dc voltage, the energy storage capacitor is employed.
Wind turbines can introduce harmonics into the power system due to their nonlinear behavior. A PI controller can mitigate these harmonics by controlling the flow of reactive power, minimizing distortion in the power waveform, and ensuring cleaner power transmission. Wind power systems are subject to fluctuations due to varying wind speeds. A PI controller can help regulate voltage by adjusting the system's reactive power, ensuring stable voltage levels and reducing the risk of voltage sags or surges.
In proposed system, computational technique is implemented with conventional "proportional integral” (PI) controller to enrich the performance of custom devices as well grid network.
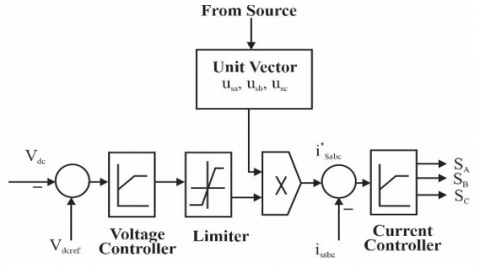
The controller maintains the variables of the control system between the hysteresis area boundary. It provides the proper switching signal for D-STATCOM function explained by the study [18]. In Figure 7, the control scheme is shown.
Figure 7. Control scheme
Figure 8. Schematic diagram of STATCOM connected to the grid
Standard 3-phase inverters with PWM switching are utilised as the STATCOM. The series choke and the dc-bus capacitor, two passive components, are intended to control the ripple in the STATCOM's ac side current and dc bus voltage, respectively.
The schematic diagram of STATCOM connected to the grid is shown in Figure 8. If STATCOM is successfully controlled, the reference current $I_i$ will be equal to the current flowing through R and L. Kirchhoff's Voltage Law is used to determine the voltage that the inverter must produce. R is the equivalent loss resistance, which comprises switch power loss, winding resistance, etc., L is the filter inductance, $V_g$ is the grid voltage and $V_i$ is the inverter output voltage before filtering. The equations are initially written in the R-Y-B plane and then translated to the α-β plane because the current references in the Synchronous Reference Frame strategy are in the d-q plane and followed by the d-q plane. When KVL is applied to the R-L circuit depicted in Figure 8, we get (9) & (10).
${{v}_{ia}}(t)-{{v}_{ga}}(t)=R{{i}_{ia}}(t)+L\frac{d{{i}_{ia}}(t)}{dt}$ (8)
${{v}_{ib}}(t)-{{v}_{gb}}(t)=R{{i}_{ib}}(t)+L\frac{d{{i}_{ib}}(t)}{dt}$ (9)
${{v}_{ic}}(t)-{{v}_{gc}}(t)=R{{i}_{ic}}(t)+L\frac{d{{i}_{ic}}(t)}{dt}$ (10)
Converting the above to α-β plane, (11) and (12) are obtained.
${{v}_{i\alpha }}(t)-{{v}_{g\alpha }}(t)=R{{i}_{i\alpha }}(t)+L\frac{d{{i}_{i\alpha }}(t)}{dt}$ (11)
${{v}_{i\beta }}(t)-{{v}_{g\beta }}(t)=R{{i}_{i\beta }}(t)+L\frac{d{{i}_{i\beta }}(t)}{dt}$ (12)
In general, (13) can be written for STATCOM.
$\overline{{{V}_{i}}}-\overline{{{V}_{i}}}=R\overline{{{I}_{i}}}+L\frac{d\overline{{{I}_{i}}}}{dt}$ (13)
As it is known that α-β plane is related to d-q plane so (14), (15) is obtained.
$\begin{gathered}(\alpha+j \beta)=(d \cos \theta-q \sin \theta) \quad+j(d \sin \theta-q \cos \theta) =(d+j q) e^{j \theta}\end{gathered}$ (14)
$\begin{aligned}\left(v_{i d}-j v_{i q}\right) e^{j \theta}= & R\left(i_{i d}+j i_{i q}\right) e^{j \theta} & +L \frac{d\left(i_{i d}+j i_{i q}\right) e^{j \theta}}{d t} & +\left(v_{g d}+j v_{g q}\right) e^{j \theta}\end{aligned}$ (15)
In Eq. (15), when multiplied by $e^{j \theta}$ is transformed to d-q plane. Since d-axis is aligned with grid voltage, (16) to (17) is obtained.
${{v}_{id}}=R{{i}_{id}}+L\frac{d{{i}_{id}}}{dt}-\omega L{{i}_{iq}}+\left| \overline{V} \right|$ (16)
${{v}_{iq}}=R{{i}_{iq}}+L\frac{d{{i}_{iq}}}{dt}+\omega L{{i}_{id}}$ (17)
From Eqs. (16) and (17), the d axis and q axis currents $I_{i d}$ and $I_{i q}$ can be represented as shown in Figure 9.
Figure 9. Representation for d axis and q-axis currents of STATCOM
where,
$v_{i d}=v_{i d}^{\prime}-\omega L i_{i q}+|\bar{V}|$ (18)
$v_{i q}=v_{i q}^{\prime}+\omega L i_{i d}$ (19)
Above mathematical Eqs. (18) and (19) can be represented as block diagram shown in Figure 10, in which the d-axis and q-axis reference voltage $v_{i d}$ and $v_{i q}$ of STATCOM are obtained. Management of reactive power is accomplished by management of $I_{i q}$ and active power control by control of $I_{i d}$.
Figure 10. Representation of d-axis and q-axis voltage at PCC
Similarly, for DC bus voltage controller, (20) can be obtained.
$I_{i d}=C \frac{d V_{d c}}{d t}+\frac{V_{d c}}{R}$ (20)
Figure 11 shows the representation for DC bus voltage controller of STATCOM.
Figure 11. Representation of STATCOM DC bus voltage controller
2.3 Tuning of PI controller using optimization techniques
The power quality in a wind-generating system is the main problem, according to current study. The main objective of the suggested strategy is to develop a wind power generation system with improved power quality. In the wind energy conversion system deployed by D-STATCOM, a novel controlling technique has been devised. This control scheme proposes the PI controller with optimisation strategies [19].
The flow of electron control VSI is known as D-STATCOM. It injects current into the power grid in order to keep the source voltage's phase angle within the desired range and the source current free of harmonics. The power factor and power quality were both improved by the injection of current from the compensator, which reduced harmonics in the load, reactive component, and current in the double-fed induction generator. The proposed control block consists of the DFIG, non-linear load and D-STATCOM along with optimized PI controller connected at the common coupling point as shown in Figure 12.
Figure 12. Architecture of the proposed method
The switching function of the compensator is enhanced by the IGBT. In proposed control scheme optimized PI controller is implemented which is an enhancement over the tuning of the conventional PI controller and improves the switching function of the compensator.
2.4 Harmony search optimization based controller
The harmony search algorithm (HSA) stands as a contemporary addition to the realm of metaheuristic population search algorithms, having been introduced by reference [20]. Its core concept draws inspiration from the art of creating harmonious music, wherein the algorithm's decision variables take on the role of musicians, and the musical notes they produce symbolize the values of these variables. Ultimately, the harmony achieved through this process is equated to the optimal solution vector.
In stark contrast to gradient-based optimization techniques, HSA operates as a stochastic search method, unburdened by the need for derivatives. This renders it a highly flexible and versatile approach. Moreover, HSA boasts a straightforward mathematical model, rendering it relatively uncomplicated to implement in engineering applications compared to other metaheuristic methodologies. In practical terms, HSA has demonstrated its prowess in tackling a myriad of optimization challenges within the domain of power systems with a track record of success.
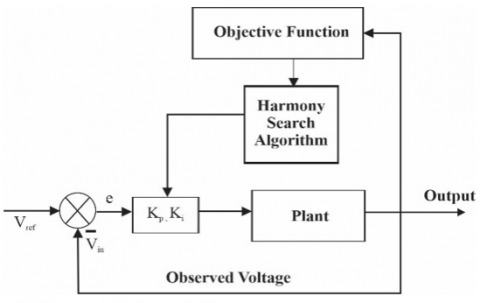
In this study, we have presented a systematic approach to optimizing the parameters of PI controllers through the utilization of the HSA. Our optimization scheme is applied to concurrently control both real and reactive power. Figure 13 depicts the block diagram of the PI controller based on HSA.
Figure 13. HSA based PI Controller
To assess the efficacy of our proposed HSA method in achieving the optimal PI controller parameters within a complex and nonlinear system, we conducted a comparative analysis with two widely recognized techniques: GA and ACO. A thorough analysis demonstrates the necessity of comparative assessment and identifies areas of research gaps in power quality in wind system network & identification optimisation techniques. This comparison serves to illustrate the advantages and capabilities of the HSA-based methodology.
The HSA is a optimization approach inspired by the way musicians adjust their instrument's pitches to discover improved harmony. Just as musical instruments can produce distinct musical notes through either the experience-driven choices of the player or through improvisation involving random processes, optimal design variables can likewise be determined by employing specific discrete values through a combination of computational intelligence and stochastic processes.
Musicians refine their skills by adhering to aesthetic standards, whereas computer memory's design variables can be enhanced by optimizing an objective function. The HSA offers several advantages, including its ability to handle both discontinuous and continuous functions, as it doesn't rely on differential gradients. It eliminates the need for initial value assignment to variables, guards against divergence, and has the capacity to escape local optima. The HSA boasts the following merits:
• HS can accommodate both continuous and discontinuous functions without the need for differential gradients.
• HS is capable of handling both discrete and continuous variables seamlessly.
• HS does not necessitate the assignment of initial values to variables.
• HS is immune to divergence, enhancing its stability.
• HS possesses the capability to evade local optima, promoting global exploration.
• HS offers a potential solution to the limitations of GA's building block theory, which relies heavily on understanding variable relationships within a chromosome. When neighboring variables have weaker associations than remote ones, the building block theory may falter due to crossover operations. In contrast, HS explicitly considers relationships through ensemble operations.
• HS introduces an innovative stochastic derivative applied to discrete variables, drawing inspiration from musicians' experiences to guide the search direction effectively.
Nowadays, the HSA is popular because of its simplicity and ease of implementation. Three operators make up the HSA: pitch-adjusting, rule based on harmony memory consideration, and random search. The three operators that distinguish the HSA from others are what enable it to address issues that arise during the exploration and exploitation phase. According to some experts, HSA's performance must be quite similar to that of an evolution strategy (ES). Two operators have been used in the development of the ES. Recombination and mutation are those. The ES and HSA are comparable in that at every level, both metaheuristic algorithms provide a single new solution. The primary benefit of developing a single new solution at every step is that it can replace the population's worst solution. The exploration and exploitation operators' syntax differs greatly between ES and HSA, which is the primary difference between the two systems.
The initial sub-problem focuses on the ideal deployment of STATCOM devices, employing the modal analysis technique. The subsequent sub-problem centers on optimizing the load flow by configuring STATCOM parameters, leveraging the enhanced harmony search algorithm. HSA was recently conceived as an analogy to the process of musical refinement. This algorithm draws inspiration from the practice of instrument tuning, akin to how musicians engage in improvisation to achieve better harmony by adjusting the pitches of their instruments.
Figure 14. Flow-chart of harmony search algorithm
Figure 14 shows the most popular HS schemes. The algorithm process of HSA is given as follows.
Step 1: The initiation of the objective function and parameters in HSA
The first step's optimisation goal is described as follows: Minimize f(x) subjected to $x_i \in X_i=1,2, \ldots, N$,
where, f(x) is our objective function; x is the set of each decision variable $x_i$; N is the number of decision variables, $X_i$ is the set of the possible choices for each decision variable, that is $L^{x_i} \leq X_i \leq U^{x_i}$.
where, $L^{x_i}$ and $U^{x_i}$ are the lower and upper bounds for individual decision variable.
In this step, the different parameters of harmony search algorithm are defined. Those are dictated below:
All the set of decision variables (solution vectors) are stored in the harmony memory (HM). Here, HMCR and PAR are parameters that are used to improve the solution vector. Those are defined in further steps. NI is stopping criteria for algorithm.
Step 2: Initialization of the harmony memory
In this step, number of randomly created solution vectors makes the HM matrix, which is located as the HMS Eq. (21):
$H M=\left[\begin{array}{cccc}x_1^1 & x_2^1 & \cdots & x_n^1 \\ \vdots & \vdots & & \vdots \\ x_1^{H M S} & x_2^{H M S} & \cdots & x_n^{H M S}\end{array}\right]$ (21)
Step 3: New harmony improvisation
‘Improvisation’ stands for generating a new harmony. A New Harmony vector $x^{\prime}=\left(x_1^{\prime}, x_1^{\prime} \ldots, x_n^{\prime}\right)$ is created based on pitch adjustment, memory consideration and random selection. The value of the first decision variable $x_1^{\prime}$ is selected from any of the special HM range $\left(x_1^{\prime}-x_1^{\prime H M S}\right)$ for the new vector. The values of other decision variables $\left(x_1^{\prime}, x_1^{\prime} \ldots, x_n^{\prime}\right)$ are selected in the same way .The HMCR, is the rate of selection from the historical values stored in the HM. It varies between 0 and 1, selecting HMCR-1 is the rate of randomly selection of a value among the possible range of values.
As an illustration, consider an HMCR (Harmony Memory Consideration Rate) value of 0.75. This value signifies the likelihood of choosing data from the historical records. In other words, the algorithm will select a decision variable with a 75% probability from the historical data, leaving the remaining (100-75)% probability for selecting within the entire range. The adjustment of pitch is determined by taking memory into account, which is governed by the PAR (Pitch Adjustment Rate) parameter. The pitch adjustment rate is defined as follows:
The decision for Pitch adjustment ($x_1^{\prime}$)←YES with probability PAR ($x_1^{\prime}$)← NO with probability (1-PAR).
Step 4: Pitch adjustment
The value of (1-PAR) sets the rate of doing nothing. If the pitch adjustment decision for $x_i$ is yes, $x_i^{\prime}$ is replaced as follows:
$x_i^{\prime} \leftarrow x_i^{\prime} \pm \operatorname{rand}(0,1) \times b w$ (22)
where, the bw is an arbitrary distance bandwidth, rand() is a random number between 0 and 1.
Step 5: Update harmony memory
In the Harmony Memory, if new harmony vector, $x^{\prime}=\left(x_1^{\prime}, x_1^{\prime} \ldots, x_n^{\prime}\right)$ is better than the all the previously determined harmony, compared in terms of objective function value. Then after, the New Harmony is stored and the existing worst harmony is removed from the HM.
Step 6: Checking for stopping criterion
The computation concludes when the stopping criterion (maximum number of iterations/improvisations) is met. If not, Steps 3 and 4 are reiterated.
3.1 Objective function
The evaluation function E is used to describe how well the system performs (23) with the PI controller gains.
$E=\int{\left| {{\left| {{v}_{i}} \right|}^{*}}-\left| {{v}_{i}}(t) \right| \right|}\,dt$
$E=\int{\left| {{\left| {{v}_{i}} \right|}^{*}}-\sqrt{{{v}_{id}}{{(t)}^{2}}-{{v}_{iq}}{{(t)}^{2}}} \right|}\,dt$
$E\approx \sum\limits_{{}}^{{}}{{}}\left| {{\left| {{v}_{i}} \right|}^{*}}-\sqrt{{{v}_{id}}{{(t)}^{2}}-{{v}_{iq}}{{(t)}^{2}}} \right|\Delta t$ (23)
Subjected to,
$\left. \begin{matrix} K_{p}^{\,\min }\le {{K}_{p}}\le K_{p}^{\,\max } \\ K_{i}^{\,\min }\le {{K}_{i}}\le K_{i}^{\,\max } \\\end{matrix} \right\}\left( \text{for}\,\text{PI} \right)$ (24)
The evaluation function used here is the Integral of the Time-Weighted Absolute Error (ITAE) in the load bus voltage [18]. It has been said that a reaction with a low ITAE will have a quick rising time and a comparatively tiny overshoot. Thus, the proposed controller is constructed employing ITAE criterion (24) which achieves adequate stability as well as quick response [21].
This study compares and contrasts various intelligent control methods used for STATCOM and PI controller parameter estimation. Here, harmonics is viewed as a power quality issue, and sag should be decreased using optimisation approaches by adjusting the PI and STATCOM parameters. First, an error-free analysis is performed. After that, each error is considered individually. The GA, ACO, and HSA are the three optimisation techniques used. From the aforementioned methods, the HSA yields the best results because it converges more quickly than GA and ACO.
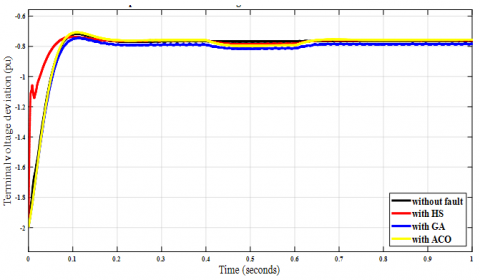
Figure 15 represents the comparative analysis of terminal voltage deviation when fault occurs in the line according to search algorithms. In comparison to ACO and GA, it is evident that HS optimisation yields the best results.
Figure 15. Deviation of terminal voltage
When a systemic three phase fault happens, voltage sag can be observed between 0.4 and 0.6 seconds. The PI and SATCOM parameters are adjusted using optimisation techniques to lessen the voltage sag. HSA yields the best results since it converges more quickly than ACO and GA. Figures 16 to 19 below show various wind generation performance characteristics of terminal voltage, speed, mechanical torque & power, separately.
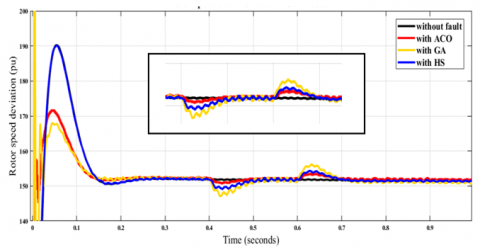
Figure 16. Deviation of speed
Figure 17. Mechanical torque deviation
Figure 18. Power deviation
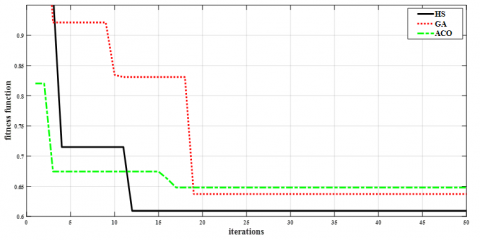
Figure 19. Convergence curve
The comparative analysis of rotor speed deviation when fault occurs in the line is shown in Figure 16 implementing varuious search algorithms. In comparison to ACO and GA, it can be seen that HS when applied the deviation is minimum.
Figure 17 represents the comparative analysis of mechanical torque deviation when fault occurs in the line according to search algorithms. In comparison to ACO and GA, it can be demonstrated that HS optimisation yields the greatest results.
Figure 18 represents the comparative analysis of power deviation when fault occurs in the line according to search algorithms. In comparison to ACO and GA, it can be demonstrated that HS optimisation yields the greatest results.
The values of the STATCOM and PI controller's tuned parameters are shown in Table 1 with the use of optimisation techniques.
Table 1. Performance parameters of PI controller and STATCOM
|
Parameters |
$K_p$ |
$K_i$ |
Vdc |
|
Tuning Methods |
|||
|
Without fault |
0.2500 |
0.5000 |
18.7000 |
|
GA |
4.1053 |
9.8511 |
20.9370 |
|
ACO |
2.8944 |
7.1542 |
27.5221 |
|
HSA |
4.1723 |
9.6753 |
25.2051 |
Figure 19 shows a comparison of the convergence results when fault occurs at wind power system network. Each method is run independently, and the convergence results are combined as shown. In comparison to ACO and GA, it is clear that the harmony search algorithm converges faster in less number of iterations. Hence, the harmony search algorithm's rate of convergence is significantly faster. The paper evaluates algorithm efficiency based on runtime. HSA is the fastest, showcasing its efficiency. ACO takes more time than HAS & GA is the slowest. Thus, it can be said that, when compared to the other two optimisation techniques, the harmony search algorithm is the best.
4.2 Total harmonic distortion of voltage
For THD of voltage, three cases are considered for analysis; when STATCOM and PI controller is not active, when STATCOM and PI controller is active assuming conventional values, when STATCOM and PI controller is active assuming GA, when STATCOM and PI controller is active assuming ACO and when STATCOM and PI controller is active assuming HSA.
(A) When statcom and PI controller are not active
Firstly analysis is done when STATCOM and PI controller are not active. It is seen that in this particular case, THD is very high and to reduce THD, we use power electronics load and PI controller. The initial analysis involves the application of traditional PI controller values and STATCOM. Subsequently, optimization techniques are employed to fine-tune both the PI controller and STATCOM.THD is seen for a particular time period of 0.7-0.9 seconds. It is seen that without tuning of PI controller and STATCOM, total harmonic distortion is very high and after tuning with the help of optimization techniques total harmonic distortion is reduced.
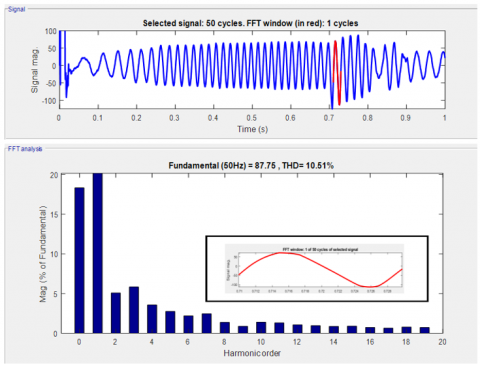
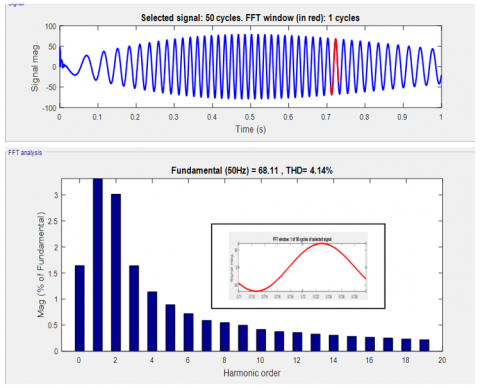
Figure 20 represents the total harmonic distortion when PI controller and STATCOM are not active and the FFT window of voltage total harmonic distortion.
Figure 20. THD when PI controller and STATCOM are not active
(B) When statcom and PI controller are active (assuming conventional values)
Here, analysis is done when STATCOM and PI controller are active assuming conventional values. It is seen that in this case THD is somewhat less than case (A) and to reduce THD, we use power electronics load and PI controller. THD is seen for a particular time period of 0.7-0.9 seconds. Without tuning of PI controller and STATCOM, total harmonic distortion is very high and after tuning with the help of optimization techniques total harmonic distortion is reduced.
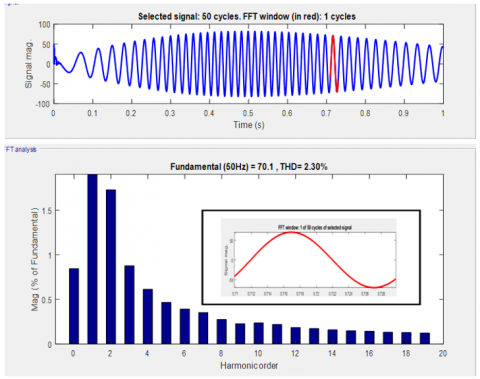
Figure 21 represents total harmonic distortion when PI controller and STATCOM are active assuming conventional values.
Figure 21. THD when PI controller and STATCOM are active assuming conventional values
(C) When statcom and PI controller is active (genetic algorithm)
Here analysis is done when STATCOM and PI controller are active assuming genetic algorithm. It is seen that THD is again reduced and it is less than case (B), when tuned with the help of GA. THD is seen for a particular time period of 0.7-0.9 seconds. Without tuning of PI controller and STATCOM, total harmonic distortion is very high and after tuning total harmonic distortion is reduced as shown in Figure 22.
Figure 22. THD when PI controller and STATCOM are active assuming genetic algorithm
(D) When statcom and PI controller is active (ant colony optimization)
It is seen that in this case THD is reduced to some point and to reduce THD, we use power electronics load and PI controller. THD is seen for a particular time period of 0.7-0.9 seconds.
Without tuning of PI controller and STATCOM, total harmonic distortion is very high and after tuning with ACO total harmonic distortion is reduced. As compared to case (C) THD is less as shown in Figure 23.
Figure 23. THD when PI controller and STATCOM are active assuming ant colony optimization
(E) When statcom and PI controller is active (harmony search algorithm)
Here, the analysis is done when STATCOM and PI controller is active assuming harmony search algorithm.
It is seen that in this case THD is reduced to a satisfactory value for a particular time period of 0.7-0.9 seconds. Figure 24 represents the total harmonic distortion when PI controller and STATCOM are active using ant colony optimization.
Figure 24. THD when PI controller and STATCOM are active assuming harmony search optimization
The pursuit of enhancing the performance of wind power systems through optimization techniques is a critical endeavor in our quest for sustainable and efficient energy generation. This conclusion summarizes the key findings and implications of such efforts:
Our investigation was limited to the wind power sector. Future research, though, might incorporate data from other industries to extrapolate our conclusions from the meta context analysis. Future scholars might combine our research with other theories and models to evaluate the competitiveness of various industries.
Constant study is needed to learn about the advancements made by the wind power sector throughout time. It is important to remember that a number of factors influence how competitive the wind power market is. However, only a small number of parameters have been examined in this study. Future research can get over this restriction by looking into other variables that might have an impact on the wind power industry's competitiveness and profitability.
[1] Tapia, A., Tapia, G., Ostolaza, J.X., Saenz, J.R. (2003). Modeling and control of a wind turbine driven doubly fed induction generator. IEEE Transactions on Energy Conversion, 18(2): 194-204. https://doi.org/10.1109/TEC.2003.811727
[2] Amara, M., Mazouar, A., Sayah, H. (2022). Enhanced control of wind energy conversion system based on DFIG using adaptive super twisting controllers. Journal Europeen des Systemes Automatises, 55(1): 109. https://doi.org/10.18280/jesa.550111
[3] Von Altrock, C., Krause, B., Zimmerman, H.J. (1992). Advanced fuzzy logic control of a model car in extreme situations. Fuzzy Sets and Systems, 48(1): 41-52. https://doi.org/10.1016/0165-0114(92)90250-8
[4] Ganjefar, S., Mohammadi, A. (2016). Variable speed wind turbines with maximum power extraction using singular perturbation theory. Energy, 106: 510-519. https://doi.org/10.1016/j.energy.2016.03.095
[5] Singh, R.K., Ahmed, M.R. (2013). Blade design and performance testing of a small wind turbine rotor for low wind speed applications. Renewable Energy, 50: 812-819. https://doi.org/10.1016/j.renene.2012.08.021
[6] Akhmatov, V., Knudsen, H., Nielsen, A.H. (2000). Advanced simulation of windmills in the electric power supply. International Journal of Electrical Power & Energy Systems, 22(6): 421-434. https://doi.org/10.1016/S0142-0615(00)00007-7
[7] Anita, B.B.R., Babypriya, B. (2009). Modelling, simulation and analysis of doubly fed induction generator for wind turbines. Journal of Electrical Engineering, 60(2): 79-85.
[8] Luo, Y., Li, K., Li, Y., Cai, D., Zhao, C., Meng, Q. (2017). Three-layer Bayesian network for classification of complex power quality disturbances. IEEE Transactions on Industrial Informatics, 14(9): 3997-4006. https://doi.org/10.1109/TII.2017.2785321
[9] Kumar, D., Zare, F., Ghosh, A. (2017). DC microgrid technology: System architectures, AC grid interfaces, grounding schemes, power quality, communication networks, applications, and standardizations aspects. IEEE Access, 5: 12230-12256. https://doi.org/10.1109/ACCESS.2017.2705914
[10] Hamdy, M., Attia, M.A., Abdelaziz, A.Y., Kumar, S., Sarita, K., Saket, R.K. (2021). Performance enhancement of STATCOM integrated wind farm for harmonics mitigation using optimization techniques. In ICT Analysis and Applications: Proceedings of ICT4SD 2020. Springer Singapore, 2: 507-516. https://doi.org/10.1007/978-981-15-8354-4_50
[11] Chawda, G.S., Shaik, A.G., Mahela, O.P., Padmanaban, S. (2022). Performance improvement of weak grid-connected wind energy system using flsrf-controlled dstatcom. IEEE Transactions on Industrial Electronics, 70(2): 1565-1575. https://doi.org/10.1109/TIE.2022.3158012
[12] Sindi, H.F., Alghamdi, S., Rawa, M., Omar, A.I., Elmetwaly, A.H. (2023). Robust control of adaptive power quality compensator in Multi-Microgrids for power quality enhancement using puzzle optimization algorithm. Ain Shams Engineering Journal, 14(8): 102047. https://doi.org/10.1016/j.asej.2022.102047
[13] Magesh, T., Devi, G., Lakshmanan, T. (2023). Improving the performance of grid connected wind generator with a PI control scheme based on the metaheuristic golden eagle optimization algorithm. Electric Power Systems Research, 214: 108944. https://doi.org/10.1016/j.epsr.2022.108944
[14] GK, S., Thangavelu, R. Golden (2023) Eagle optimization algorithm based on a PI control scheme to enhance the dynamic stability of a wind turbine with a double-fed induction generator. https://doi.org/10.2139/ssrn.4379931
[15] Lalor, G., Mullane, A., O'Malley, M. (2005). Frequency control and wind turbine technologies. IEEE Transactions on Power Systems, 20(4): 1905-1913. https://doi.org/10.1109/TPWRS.2005.857393
[16] Holdsworth, L., Ekanayake, J.B., Jenkins, N. (2004). Power system frequency response from fixed speed and doubly fed induction generator‐based wind turbines. Wind Energy: An International Journal for Progress and Applications in Wind Power Conversion Technology, 7(1): 21-35. https://doi.org//10.1002/we.105
[17] Liu, L., Wang, S.T. (2019). Improving low voltage ridethrough with STATCOM and SDBR for wind turbine with squirrel-cage induction generator. European Journal of Electrical Engineering, 21(2): 179-187. https://doi.org/10.18280/ejee.210208
[18] Singh, B., Solanki, J. (2009). A comparison of control algorithms for DSTATCOM. IEEE Transactions on Industrial Electronics, 56(7): 2738-2745. https://doi.org/10.1109/TIE.2009.2021596
[19] Melin, P.E., Guzman, J.I., Hernandez, F.A., Baier, C.R., Muñoz, J.A., Espinoza, J.R., Espinosa, E.E. (2020). Analysis and control strategy for a current-source based D-STATCOM towards minimum losses. International Journal of Electrical Power & Energy Systems, 116: 105532. https://doi.org/10.1016/j.ijepes.2019.105532
[20] Dubey, M., Kumar, V., Kaur, M., Dao, T.P. (2021). A systematic review on harmony search algorithm: Theory, literature, and applications. Mathematical Problems in Engineering, 2021: 1-22. https://doi.org/10.1155/2021/5594267
[21] Singh, M., Patel, R.N., Neema, D.D. (2019). Robust tuning of excitation controller for stability enhancement using multi-objective metaheuristic Firefly Algorithm. Swarm and Evolutionary Computation, 44: 136-147. https://doi.org/10.1016/j.swevo.2018.01.010