Bouyahrouzi El Mahdi* | El Kihel Ali | El Kihel Youssra | Embarki Soufiane
© 2022 IIETA. This article is published by IIETA and is licensed under the CC BY 4.0 license (http://creativecommons.org/licenses/by/4.0/).
OPEN ACCESS
Predictive maintenance (M4.0) allows more targeted and efficient use of resources, reduces unplanned downtime, and increases production and equipment performance compared to classical existing maintenance (M3.0). This paper deals with the development of a new ecosystem that adopts the new technologies of Industry 4.0 to drive real-time monitoring and diagnosis of engine defects. The proposed architecture is based on implementing a process of identifying critical components and extracting related data (speed and acceleration) based on IoT technology. A neural model (ANN) is implemented for monitoring, detecting and diagnosing engine faults with high accuracy compared to existing techniques. The effectiveness and reliability are validated through real-time test bench studies.
maintenance 4.0, internet of things, artificial neural network, monitoring, diagnosis, unbalance
For the first time at the Hannover Fair for Industrial Technologies, Industry 4.0 has been described as the fourth industrial revolution, which consists of a new way of organizing the means of production, where intelligent machines and robots are connected. This industry will change the manufacturing sector through the integration of manufacturing processes by information and communication technologies [1, 2] to develop efficient "smart factories" capable of achieving the current objective in a flexible way [3]. In addition, I4.0 helps to improve and satisfy the emerging demand for products through intelligent process control and management [4, 5]. There is a growing global competition to adopt Industry 4.0 to control the production chain and ensure the desired level of quality and productivity while respecting the axes of sustainable development: social, economic, and risk [6, 7].
Predictive maintenance cannot be dissociated from Industry 4.0. It is one of its main axes because it represents an effective solution to anticipate failure and intervene in advance. M4.0 has several definitions; for some researchers, it has become a brave new world of specialized technologies and methods which consist of monitoring vibrations in rotating machines to anticipate malfunction and thus avoid failure [8]. Meanwhile, others use it by looking at the infrared emissions of electrical devices, engines, and other equipment for the same purpose of problem prevention [9]. These two methods have in common the control over the condition and the operational state of a machine. Overall, one can say that M4.0 is a good way of anticipating and identifying early signs of failure and plan interventions, which leads to improving productivity, product quality, and overall plant efficiency [10], The desire of the scientific and industrial community to adopt this technology and advance towards Industry 4.0 has intensified, particularly with the development of huge data processing and analysis tools [9].
Maintenance 4.0 is a comprehensive process that consists of three main components:
Monitoring: According to the ISO13381 standard of the world federation of national standards organizations, it is an evolution of systems analysis using indicators and predefined thresholds. The purpose of monitoring is to detect the first signs of a failure and then to diagnose them by locating the failing elements and identifying the root causes.
Diagnosis: it consists of searching or analyzing a problem's causes and locating the defective parts. It is the process of detecting and identifying a failure mode within a system. In more detail, diagnosis is a thorough exploration of the failure to identify the root cause after it has occurred [11].
Prognosis: Prognosis is the prediction of future failures. Indeed, it is the rational estimation of the remaining lifetime until a complete failure occurs [12]. Thus, it consists of monitoring and detecting a component's early indications of machine degradation and consistently making accurate predictions. The main objective of prognosis is to predict a malfunction before it occurs, so time is a critical variable in prognosis, distinguishing it from diagnosis, in which time plays a less critical role [13].
Several research studies have been addressed over time on M4.0 approaches. From extensive research, we demonstrated that M4.0 is based mainly on one of the following three approaches:
• Physics-based approaches assume on a mathematical or analytical model to characterize and model the failure [14, 15].
• Data-driven approaches use either a static [16], probabilistic or artificial intelligence model such as artificial neural networks [17-19].
• Hybrid approaches combine the two previous approaches to concatenate the advantages of both [20, 21].
Several review papers [17, 22, 23] have also addressed the suggestions, challenges and future direction of predictive maintenance on how to implement algorithms that do fault diagnosis. However, they have not addressed either the methodology to implement predictive maintenance in conventional plants or the applicability of their algorithms in a real case.
This study aims to develop a transition approach to I4.0 for companies and to help them implement predictive maintenance tools to detect and diagnose failures while guaranteeing the reliability and availability of industrial equipment.
This paper is organized in the following way: the first section presents the methodology developed to transition from classical maintenance to maintenance 4.0. The second section highlights the proposed methodology's applicability on a test bench. Finally, the results and performance of our model are presented in the last section.
With the increase of automated tasks linked to the complexity of machines, maintenance must evolve towards the requirements of the manufacturing sector. Therefore, companies are looking for solutions to adopt the 4.0 technologies and digitalize maintenance processes.
In order to meet this challenge, the contribution developed in this article will guide industrialists to integrate 4.0 technologies in their processes better in order to move towards maintenance that meets the needs of I4.0 [6].
2.1 The architecture developed to make the transition towards industry 4.0
In order to move towards an industry that meets the needs of business and international competitiveness. An architecture has been set up to help manufacturers to integrate 4.0 techniques by focusing on M4.0, thus making a jump toward the future industry.
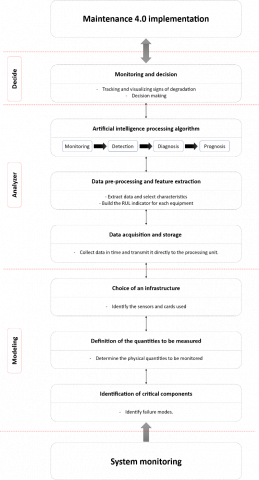
The developed architecture can be divided into seven main modules, as shown in Figure 1.
- Identification of critical components: This involves decomposing the industrial system into several subsystems, each with a well-defined function. This decomposition is based on the expertise of the system operator. Then, a technical description has been made to know the subsystems' functionality and the links between them. Finally, a quantitative and qualitative analysis of the data and knowledge collected during the operation is required.
- Definition of the physical quantities to be monitored: the choice of the physical quantities is essential because it requires a good and thorough knowledge of the causal links between the variation of the value of physical quantities and the evolution of the equipment degradations.
- Choice of an infrastructure: choose sensors and smart meters that have a technical means of communication as well as an acquisition card that is compatible with the system in order to have a communication network.
- Data acquisition and storage: this module aims to acquire and save in real-time and continuously the different data formats by ensuring they are weak and ready for processing.
- Data preprocessing and feature extraction: this module relies on techniques de-rived from the processing of monitoring data provided by the sensors installed on the critical components with the aim of observing the status machine and the relevant information on the triggering and progression of equipment degradation.
- Artificial intelligence processing algorithm is mainly based on detecting and identifying the first signs of failure and the diagnosis the status of the system using artificial intelligence algorithm.
Figure 1. Proposed architecture transformed by adding 4.0 technologies
To validate the reliability of our architecture, a case study has been made on a testbench to evaluate it.
3.1 Experimental testbench description
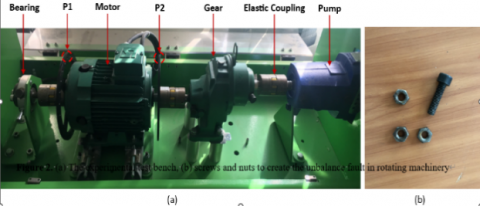
The experimental is conducted using data acquired from an experimental platform built in the Industrial Engineering Department at the National School of Applied Sciences. The test bench used in this validation is illustrated in Figure 2(a). The purpose of this test bench is to characterize the attenuation efficiency of physical quantities such as vibrations, temperature, and power consumption..., as well as the performance of components, for example, bearing, engine, and pump, under controlled conditions. In our experiment, the faults are generated artificially by inserting a screw with a nut in specific points P1 and P2, as shown in Figure 2(b). In addition, the engine speed has been fixed at 1200rpm.
Figure 2. (a) The experimental test bench, (b) screws and nuts to create the unbalance fault in rotating machinery
3.2 Static and dynamic unbalance
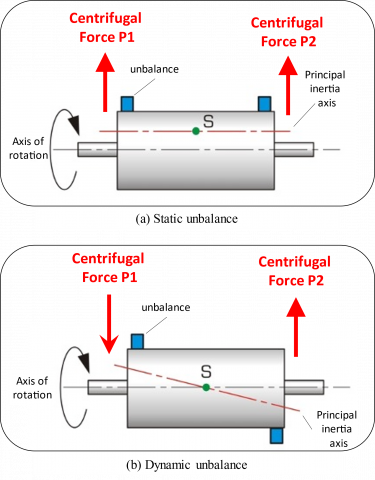
The defects created in this experiment are static and dynamic unbalance defects. This type of fault is often the cause of annoying vibrations and noises. During an unbalance, the machine's center of gravity is outside its axis of rotation. By adding weights, the center of gravity "S" can be moved so that the two axes correspond with the axis of rotation. This process is called unbalance. With the sensors and electronic cards, the unbalance can be demonstrated explicitly. Figure 3 shows the difference between a static and a dynamic unbalance.
Figure 3. Unbalance fault in rotating machinery.
The unbalance force is a rotating force, so it equal:
F=m·R·w2·sin(wt) (1)
With :
F : Centrifugal force, N.
m : Unbalance mass, kg.
R : distance between unbalance and the axis of rotation of the object, m.
w : Angular frequency, rad.s-1.
The unbalance is equivalent to an unbalance mass located at a given distance from the axis of rotation. Thus, the unbalance is equal to:
U=m·R (2)
Therefore, the unbalance force becomes:
F=U·w2·sin(wt) (3)
3.3 Application of proposed architecture
According to the architecture presented in section 2.1, the first step is to identify the critical components of the studied system. In our case, the system has been subdivided into two subsystems, as shown in Table 1: the first one contains three pieces of equipment: a bearing, an engine, and a coupling. The second subsystem contains gear, another coupling and a pump.
Several probable failure modes on the test bench were detected, i.e. bearing, motor, gear or pump failures. In addition, we identified the physical quantities to be monitored for each component.
This work is of great importance; it allows us to optimize and determine the types of sensors, the location point and their number from the directions of the generated efforts.
Several failure modes were identified in the test bench, such as bearing, engine, coupling, or pump failures. In our case, the unbalance faults, in particular, were treated. Then, we drew the physical quantities to be monitored in each organ to define the sensors used and the associated card. For the monitored system, we installed several temperature sensors and accelerometers in different locations to monitor the system and even to follow the effects of unbalance on other equipment.
The next step is to retrieve the data from the sensors via the frame grabber and send it back to the processing unit for storage and pre-processing. The data preprocessing consists of normalizing them and ensuring that they are complete, reliable, and ready to be processed by an artificial neural network algorithm we have developed. As a result, another analysis was done to allow strategic decisions to be made.
The final stage of our process is the development of an artificial intelligence algorithm capable of detecting and diagnosing engine faults.
Applying this approach on the test bench allows for validating the feasibility and efficiency of maintenance 4.0 on industrial systems.
Table 1. Failure modes on the test bench
|
Sub-set |
Organs |
Failure mode |
Physical phenomenon to be monitored |
Actions |
Sensors |
|
Group 1: Bearing Engine Coupling
|
Bearing |
Warm-up |
Inner ring defect |
Temperature and vibration measurement |
Temperature sensor or thermal camera and accelerometer |
|
Vibration |
Outer ring defect |
||||
|
Engine |
Warm-up |
Inner ring defect |
Vibrations analysis |
Accelerometer |
|
|
Vibration |
Outer ring defect |
||||
|
Groaning |
Phase failure or single phasing |
Noise |
Sound level meter |
||
|
Power consumption |
Unbalance |
Power analyzer |
Energy meter |
||
|
Misalignment |
|||||
|
Coupling |
Sound |
Dressing |
Noise |
Sound level meter |
|
|
Vibration |
Misalignment |
Vibration analysis |
Accelerometer |
||
|
Group 2: Gearing Coupling Pump |
Gear |
Vibration |
Pinion crack |
Vibration analysis (Time/ Frequency) |
Accelerometer |
|
Temperature |
Temperature measurement |
Temperature sensor or thermal camera |
|||
|
Pump |
Leakage |
Seal Leakage |
Air and gas compressor |
Ultrasound |
|
|
Temperature |
Water pump faults |
Temperature measurement |
Temperature sensor or Thermal camera |
||
|
Cavitation |
Vibration |
Vibration analysis |
Accelerometer |
Data checking and verification are essential parts of the pre-processing. They allow us to check the reliability and availability of the data, verify the values of the parameters, and select the influenced parameters. Table 2 shows the acquired frame, and Table 3 describes each data frame parameter.
3.4 Generated dataframe
Table 2. Shape of the frame acquired
|
DataFrame |
Description |
|
{Timestamp, v_RMS,Unit, a_RMS,Unit, a_Peak,Unit,crete,Unit, temp,Unit} |
The DataFrame is encoded in Json format. |
Table 3. DataFrame parameter
|
Parameter names |
Derived Units |
Designation |
|
Timestamp |
|
Time sampling |
|
v_RMS |
Meter per Second (m. s-1) |
Average speed |
|
a_RMS |
Meter per Second squared (m.s-2) |
Average acceleration |
|
a_Peak |
Meter per Second squared (m.s-2) |
Peak value |
|
crete |
Meter per Second squared (m.s-2) |
Peak-to-Peak value |
|
Temp |
Celsius (℃) |
Surface temperature |
|
Unit |
|
Represents the unit of each parameter |
3.5 Construction of the ANN
Deploying an AI model to diagnose similar types of engines is possible using supervised machine learning. This involves collecting data from properly functioning engines as well as engines with problems and using that data to train a model that can diagnose problems in new engines. This model can then be implemented on an electronic board to diagnose other motors of the same type in real-time.
That's why, the second part of the method consists in diagnosing the failures from a history of the equipment data. This diagnosis is made by a machine learning model and, more precisely, by artificial neural network using the Python language to model the characteristics of each engine defect.
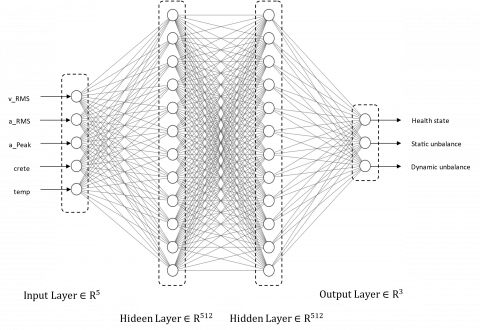
Our architecture is composed:
Five input neurons: these are v-RMS, a-RMS, a-Peak, Crete, Temp, as shown in Table 2. The purpose of the input layer is to receive the data from the sensors via the acquisition card and transmit them to the hidden layer so that it can model the relationship between the inputs and the output. Two hidden layers: each one contains 512 neurons, allowing the process of the relation between the inputs and the output to model the relation between them. Three neurons in outputs: each one represents the state of the engine.
To train this model on the different states of the bearing, we exploited the monitoring history of the latter which contains more than 8000 data.
Figure 4 represents our neural network architecture.
Figure 4. Rotating machinery diagnostics by the developed architecture
Normally, the data is put into the ANN network after preprocessing. The inputs are multiplied by the weights "ω", in this, a bias "b" is added, and the activation function "ReLu" is then applied to the outcome. This process is repeated up until the last layer is reached. As a result, the output of the network gives one of three values (0, 1 or 2), each corresponding to an operating mode of the engine:
- The value “0”: means Healthy Engine,
- The value “1” represent Static Unbalance Fault,
- The value “2” means Dynamic Unbalance Fault.
The developed algorithm directly displays the state of the engine.
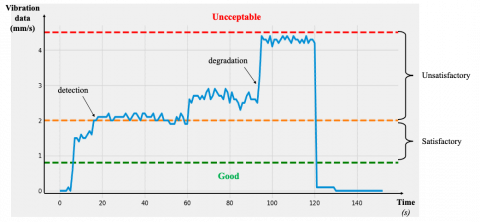
4.1 System monitoring
After integrating the proposed architecture into the studied system, we could have real-time system data, leading to continuous system monitoring. As a result, the ISO10816-3 standard was exploited to monitor the whole system and detect the first signs of failure [24]. In this case study, the motor rotates at a speed of 1200 rpm and has a power of 2.2Kw. According to the ISO10816-3 standard, our system is classified in group I (K), so the vibration thresholds are defined as follows:
- Good (<0,71mm/s)
- Satisfactory (between 0,71 and 1,8mm/s)
- Unsatisfactory (between 1,8 and 4,5mm/s)
- Unacceptable (4,5mm/s <)
Figure 5 illustrates the system monitoring status and the detection of an anomaly.
Figure 5. Continuous system-performance monitoring
The results of the monitoring are shown in Figure 15. The blue curve line represents the vibration signal of the monitored system, and the dotted lines represent the thresholds defined by the standard. At the beginning of the experiment, the vibration signal remains in the "good" area, which means that the system is in good condition. After the fault's appearance, the vibration signal's amplitude increases as the force exerted on the engine increases until it reaches the tolerable zone. The data acquired by the sensors will be recorded in order to exploit them in the training phase of the algorithms.
The next step consists in processing the acquired signals to diagnose the type of fault. This processing is done by the network developed in section 3.5.
4.2 Evaluation of the developed model
The Training and Validation loss displays a graph, see Figure 6, showing the number of errors that appear in the trained model throughout epochs. When the model has been run, a portion of the input data was used to train the model, and a portion of the data was used to validate and assess the model's correctness after it had been run.
Figure 6. Representation of accuracy and loss as a function of epoch
Figure 6 shows the model accuracy and error in each iteration. The developed model reaches an accuracy of 88% and an error of 0.3.
To validate our model, we should be equipped with different assessment metrics to analyze the classification algorithm, these metrics are:
Precision: it represents the actual correct predict divided by total prediction made by our model, as the following formula:
Precision $=\frac{T P}{T P+F P}$ (4)
Recall: represents the number of true positives divided by the total number of true positives and false negatives.
Recall $=\frac{T P}{T P+F N}$ (5)
f1 score: it is a weighted average of precision and recall. This metrics is usually more useful than accuracy, especially if you have an uneven class distribution.
$\mathrm{f} 1=2 \times \frac{\text { precision } \times \text { recall }}{\text { precision } \times \text { recall }}$ (6)
The results of the evaluate are shown in Table 4.
Table 4. Performance evaluation of proposed model
|
|
precision |
recall |
f1-score |
Support |
|
|
|
|
|
|
|
0 |
0.76 |
0.83 |
0.79 |
296 |
|
1 |
0.79 |
0.71 |
0.75 |
291 |
|
2 |
0.98 |
0.98 |
0.98 |
313 |
|
Accuracy |
|
|
0.84 |
900 |
|
Macro avg |
0.84 |
0.84 |
0.84 |
900 |
|
Weighted avg |
0.84 |
0.84 |
0.84 |
900 |
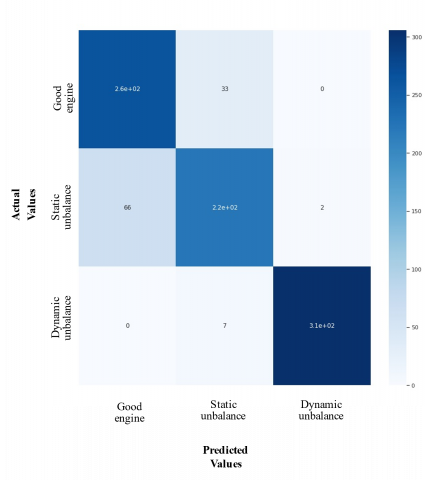
Figure 7 illustrates the confusion matrix in the model's success in identifying each class using the real data and the model results.
Figure 7. Confusion matrix representation
The confusion matrix is a table that summarizes how successful the classification model is at predicting examples belonging to various classes. One axis of the confusion matrix is the label that the model predicted, and the other axis is the actual label. In above confusion matrix, blue diagonal shows the result that in actually they represent one state of the engine and model also predicted that same state but the other boxes show the result that in actual they are one state of the engine and model predicted it another state.
The model results showed that our diagnosis was identical to the target throughout the experiment.
The model is based on two phases, as mentioned in Figure 8.
- A first phase "offline" has been performed to understand and learn the degradation behavior.
- A second phase "online" will allow us to exploit the generated neural network model as a diagnostic tool for other engine of the same type.
Figure 8. Deploy developed model in the online phase
The application findings show that our model functions admirably and is extremely sensitive to engine deterioration. This may be accounted for by the perfect adjusting and setting of the network parameters.
We cannot compare the proposed model with other existing models in the literature because the data treated in this article are generated in our platform and are only available to some.
We presented the methodology developed to integrate new technologies in maintenance 4.0 for engine faults, which applies to different physical quantities of industrial equipment organs. It consists of implementing new technologies in Industry 4.0, monitoring and detecting any failure, and diagnosing the engine condition.
Regarding the implementation of 4.0 technologies, the methodology is based on implementing an IoT infrastructure based on sensors and electronic boards to collect and feedback data continuously and in real-time from the monitored system, as well as create a connection between machines, devices and processing systems. Then, a monitoring phase is triggered to detect any anomaly in the monitored system. Finally, when the first signs of a failure are detected, an algorithm based on artificial neural networks takes over to diagnose the failures and deduce the type of fault.
Based on these results, the application of Maintenance 4.0 allows to anticipate breakdowns and failures of production lines, reduce the frequency of interventions, and positively influence energy consumption.
In future work, it is planned to analyze the errors further to see if it would be possible to optimize the model in such a way that the performance of the learned model is maximized.
This work was financially supported by the Ministry of Higher Education, Scientific Research and Innovation, the Digital Development Agency «DDA» and the National Center for Scientific and Technical Research of Morocco «CNRST» of Morocco (Alkhwarizmi/2020/24). The authors wish to give their sincere thanks to this organism as well as we would like to thank the editors and reviewers for their constructive comments and suggestions, which helped us to improve the quality of these papers.
|
I4.0 |
Industry 4.0 |
|
M4.0 |
Maintenance 4.0 of predictive maintenance |
|
IA IoT |
Artificial Intelligence Internet of Things |
|
Power BI |
Power Business Intelligence |
[1] Sharma, M., Kamble, S., Mani, V., Sehrawat, R., Belhadi, A., Sharma, V. (2021). Industry 4.0 adoption for sustainability in multitier manufacturing supply chain in emerging economies. Journal of Cleaner Production, 281: 125013. https://dx.doi.org/10.1016/j.jclepro.2020.125013
[2] Müller, J.M. (2019). Assessing the barriers to Industry 4.0 implementation from a workers’ perspective. IFAC-PapersOnLine, 52(13): 2189-2194. https://dx.doi.org/10.1016/j.ifacol.2019.11.530
[3] Osman, C.C., Ghiran, A.M. (2019). When Industry 4.0 meets Process Mining. Procedia Computer Science, 159: 2130-2136. https://dx.doi.org/10.1016/j.procs.2019.09.386
[4] Mourtzis, D., Zogopoulos, V., Vlachou, K. (2019). Frugal innovation and its application in manufacturing networks. Manufacturing Letters, 20: 27-29. https://dx.doi.org/10.1016/j.mfglet.2019.04.001
[5] Siku, K., Kwangyeol, R. (2020). Intelligent process quality management for supporting collaboration of mold manufacturing SMEs. Procedia Manufacturing, 51: pp. 381-387.
[6] El Kihel, Y., El Kihel, A., Bouyahrouzi, E. M. (2022). Contribution of maintenance 4.0 in sustainable development with an industrial case study. sustainability, 14(17): 11090. https://dx.doi.org/10.3390/su141711090
[7] Dossou, P.E. (2019). Development of a new framework for implementing industry 4.0 in companies. Procedia Manufacturing, 38: 573-580. https://dx.doi.org/10.1016/j.promfg.2020.01.072
[8] Mobley, R.K. (2002). An introduction to predictive maintenance, 2nd ed. Butterworth-Heinemann, Amsterdam, New York.
[9] Mobley, K.R. (2020). An introduction to predictive maintenance - 2nd Edition. https://www.elsevier.com/books/an-introduction-to-predictive-maintenance/mobley/978-0-7506-7531-4
[10] Razooqi, R.A., Hassan, H.J., Saheb, G.M.A. (2022). Selection algorithm for reducing iot service delay in the smart factory. Journal Européen des Systèmes Automatisés, 55(3): 419-426. https://dx.doi.org/10.18280/jesa.550315
[11] Singh, S.B., Suresha, R., Sachidananda, K.H. (2022). Reliability centered maintenance used in metro railways. Journal Européen des Systèmes Automatisés, 53(1): 11-19. https://dx.doi.org/10.18280/jesa.530102
[12] Lee, J., Wu, F., Zhao, W., Ghaffari, M., Liao, L., Siegel, D. (2014). Prognostics and health management design for rotary machinery systems—Reviews, methodology and applications. Mechanical Systems and Signal Processing, 42(1-2): 314-334. https://dx.doi.org/10.1016/j.ymssp.2013.06.004
[13] Fink, O., Zio, E., Weidmann, U. (2015). A classification framework for predicting components’ remaining useful life based on discrete-event diagnostic data. IEEE Trans. Rel., 64(3): 1049-1056. http://dx.doi.org/10.1109/TR.2015.2440531
[14] Kacprzynski, G., Sarlashkar, A., Roemer, M., Hess, A., Hardman, B. (2004). Predicting remaining life by fusing the physics of failure modeling with diagnostics. The Journal of the Minerals, Metals & Materials Society, 56: 29-35. http://dx.doi.org/10.1007/s11837-004-0029-2
[15] Chelidze, D., Cusumano, J.P. (2004). A dynamical systems approach to failure prognosis. Journal of Vibration and Acoustics, 126(1): 2-8, 2004. http://dx.doi.org/10.1115/1.1640638
[16] Okoh, C., Roy, R., Mehnen, J. (2017). Predictive maintenance modelling for through-life engineering services. Procedia CIRP, 59: 196-201. http://dx.doi.org/10.1016/j.procir.2016.09.033
[17] Amri, O., Mohamed, F., Mohammed, M., Fouad, B. (2022). Discrete event systems fault’s diagnosis and prognosis using feed-Forward neural networks. Journal Européen des Systèmes Automatisés, 54(6): 853-863. http://dx.doi.org/10.18280/jesa.540607
[18] Xu, G., Hou, D., Qi, H., Bo, L. (2021). High-speed train wheel set bearing fault diagnosis and prognostics: A new prognostic model based on extendable useful life. Mechanical Systems and Signal Processing, 146: 107050. http://dx.doi.org/10.1016/j.ymssp.2020.107050
[19] Chouidira, I., Khodja, D., Chakroune, S. (2022). Fuzzy logic based broken bar fault diagnosis and behavior study of induction machine. Journal Européen des Systèmes Automatisés, 53(2): 233-242. http://dx.doi.org/10.18280/jesa.530210
[20] Borutzky, W. (2020). A hybrid bond graph model-based - Data driven method for failure prognostic. Procedia Manufacturing, 42: 188-196. http://dx.doi.org/10.1016/j.promfg.2020.02.069
[21] Medjaher, K., Zerhouni, N. (2013). Hybrid prognostic method applied to mechatronic systems. Int J Adv Manuf Technol, 69(1): 823-834. http://dx.doi.org/10.1007/s00170-013-5064-0
[22] Khelil, J., Khelil, K., Ramdani, M., Boutasseta, N. (2020). Discrete wavelet design for bearing fault diagnosis using particle swarm optimization. Journal Européen des Systèmes Automatisés, 53(5): 705-713. http://dx.doi.org/10.18280/jesa.530513
[23] Boumedine, Mohammed, S., Djalal, K.E., Chakroune, S. (2020). Artificial neuron network based faults detection and localization in the high voltage transmission lines with MHO distance relay. Journal Européen des Systèmes Automatisés, 53(1): 137-147. https://dx.doi.org/10.18280/jesa.530117
[24] Romahadi, D., Xiong, H., Pranoto, H. (2019). Intelligent system for gearbox fault detection & diagnosis based on vibration analysis using bayesian networks. IOP Conf. Ser.: Mater. Sci. Eng., 694(1): 012001. https://dx.doi.org/10.1088/1757-899X/694/1/012001