Hua Li* | Lixin Tian | Lei Zhao | Bo Wang
© 2022 IIETA. This article is published by IIETA and is licensed under the CC BY 4.0 license (http://creativecommons.org/licenses/by/4.0/).
OPEN ACCESS
Aiming at the complementary characteristics of wind energy and solar energy, a wind-solar-storage combined power generation system is designed, which includes permanent magnet direct-drive wind turbines, photovoltaic arrays, battery packs and corresponding converter control strategies. Simulation analysis is carried out by Matlab/Simulink platform, and the results show that the model of wind and solar storage system is correct and effective, and the grid connection control can be completed.
wind power, photovoltaic arrays, battery, modeling and simulation
President Jinping Xi attended the Leaders' Climate Summit by video in Beijing on April 22, 2021, and delivered an important speech entitled "Jointly Building a Community of Human and Natural Life", in which he stressed that China will strive to achieve carbon peaking by 2030 and carbon neutrality by 2060 [1]. Energy transformation is the main path to achieve carbon neutrality, gradually reduce the proportion of fossil energy, solar, wind and other renewable energy to replace fossil energy power generation is one of the effective measures [1], wind energy and solar energy have a natural complementarity in time, the wind / photovoltaic system through the appropriate control strategy together can effectively improve energy utilization. However, wind energy and solar energy have shortcomings such as being greatly affected by the weather and low energy density, and there is obvious discontinuity in the output power. In order to ensure continuous supply of power to the load, it is necessary to install energy storage devices in actual works. The mixed utilization of wind, solar and storage can effectively solve the shortage of long-distance power transmission in remote areas, and improve the economy, reliability and continuity of system power supply.
The establishment of a refined simulation model of the wind-solar-storage combined power generation system is conducive to in-depth study of the specific characteristics of wind-solar complementary power generation, and the model is the basis of research and has certain reference value for actual engineering. Yan and Meng et al. [2, 3] established a model of wind-solar complementary power generation system, a wind-solar complementary coordinated control and grid-connected strategy is proposed, and the feasibility of the control strategy is verified by using simulation results. Zhang et al. [4] proposes a coordinated control strategy for energy optimization management of wind-solar complementary power generation system, but it is only for independent operation and does not involve grid-connected control.
Due to the incoherence of wind energy and the vulnerability of solar energy to external interference, this paper proposes a scientific and reasonable and feasible effective coordination scheme to improve the reliability of power generation, on the basis of analyzing the mathematical model of wind turbine, photovoltaic array and battery, the Matlab/Simulink platform is used to build a model of wind, photovoltaic and storage combined power generation system, introduces in detail the control mode of converter in various parts, designs the control strategy in grid-connected operation mode, conducts simulation analysis of the established model, and verifies the feasibility of model and grid-connected control.
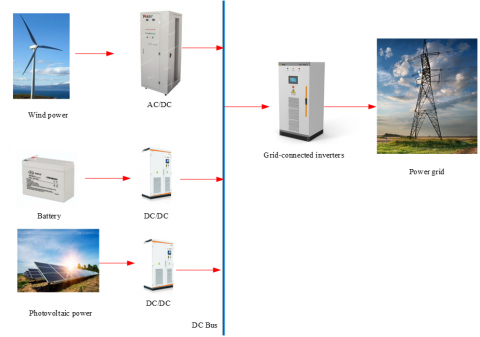
Wind power, photovoltaic, battery constitute a common DC bus structure (see Figure 1), the wind power is controlled by variable pitch to achieve protection against wind speed overruns, the PV is boosted by Boost and fed into the DC bus, and the battery is charged and discharged by bi-directional Buck/Boost, with Boost mode discharging and vice versa. The system takes into account the natural complementary nature of the wind and the solar to maximize the use of renewable energy.
2.1 Wind power system model
Wind turbine model [5]:
${{P}_{w}}=\frac{1}{2}{{C}_{p}}\rho \text{ }\!\!\pi\!\!\text{ }{{R}^{2}}{{V}^{3}}$ (1)
where, Cp, λ, R, V are the wind energy utilization coefficient, the tip speed ratio λ and the function of the pitch angle, air density, wind turbine radius, wind speed respectively, Cp is a function of λ and the pitch angle.
Figure 1. Structure of wind-solar complementary power generation system
$\left\{ \begin{align} & {{C}_{\text{p}}}=0.5173\left( \frac{116}{{{\lambda }_{1}}}-0.4\beta -5 \right){{\text{e}}^{-21/{{\lambda }_{1}}}}+0.0068\lambda \\ & \lambda =\frac{\omega R}{V}=\frac{2\pi Rn}{V} \\ & \frac{1}{{{\lambda }_{1}}}=\frac{1}{(\lambda +0.08\beta )}-\frac{0.035}{\left( {{\beta }^{3}}+1 \right)} \\\end{align} \right.$ (2)
The mechanical speed of the Permanent Magnet Synchronous Generator (PMSG) is equal to the mechanical speed of the wind turbine, and the shaft system equation:
$J\frac{d{{\omega }_{\text{m}}}}{dt}={{T}_{\text{m}}}-{{T}_{\text{e}}}-B{{\omega }_{\text{m}}}$ (3)
In the formula, J, Tm, Te, and B are the moment of inertia, the mechanical torque of the wind turbine, the electromagnetic torque, and the damping coefficient. PMSG voltage equation based on the dq coordinate system [6]:
$\left\{ \begin{align} & \begin{array}{*{35}{l}} {{u}_{\text{d}}}=-{{R}_{\text{s}}}{{i}_{\text{d}}}-{{L}_{\text{d}}}\frac{d{{i}_{\text{d}}}}{dt}+{{\omega }_{\text{s}}}{{L}_{\text{q}}}{{i}_{\text{q}}} \\ {{u}_{\text{q}}}=-{{R}_{\text{s}}}{{i}_{\text{q}}}-{{L}_{\text{q}}}\frac{d{{i}_{\text{q}}}}{dt}-{{\omega }_{\text{s}}}{{L}_{\text{d}}}{{i}_{\text{d}}}+{{\omega }_{\text{s}}}{{\psi }_{\text{f}}} \\\end{array} \\ & {{T}_{\text{e}}}=\frac{3}{2}{{n}_{\text{p}}}\left[ {{\psi }_{\text{f}}}{{i}_{\text{q}}}+\left( {{L}_{\text{d}}}-{{L}_{\text{q}}} \right){{i}_{\text{d}}}{{i}_{\text{q}}} \right] \\ \end{align} \right.$ (4)
where, np is the polar logarithm; Ud, Uq, id, iq represent the stator dq axis voltage and current, respectively; Rs, Ld, Lq (for permanent magnets with smooth radial surfaces Ld=Lq) are stator resistance and dq axis inductance, respectively; ωs is the angular frequency; Ψf is the permanent magnet flux.
2.2 PV system model
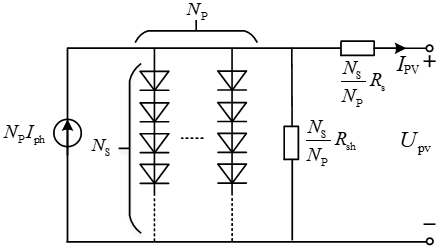
In the project, the single photovoltaic cell is combined by a certain series method, and it is roughly believed that when the performance of each single body is the same and the impedance of the connecting line is not counted, the equivalent circuit of photovoltaic power generation is:
Figure 2. Equivalent circuit of photovoltaic power generation unit
As shown in Figure 2, the relationship between the output voltage Upv of the photovoltaic unit and the current IPV is:
$\begin{align} & {{I}_{\text{pv}}}={{N}_{\text{P}}}{{I}_{\text{ph}}}-{{N}_{\text{P}}}{{I}_{\text{s}}}({{e}^{\frac{q}{BkT}(\frac{U}{{{N}_{\text{S}}}}+\frac{I{{R}_{\text{s}}}}{{{N}_{\text{P}}}})}}-1) \\ & -\frac{{{N}_{\text{P}}}}{{{R}_{\text{sh}}}}(\frac{{{U}_{\text{pv}}}}{{{N}_{\text{S}}}}+\frac{{{I}_{\text{PV}}}{{R}_{\text{s}}}}{{{N}_{\text{P}}}}) \\ \end{align}$ (5)
where, Ns and Np are the number of photovoltaic cells in series and the number of parallel branches of photovoltaic cells.
2.3 Battery model
Battery pack model [7]:
$\left\{\begin{array}{l}E=N_{\mathrm{s}} E_0-\frac{K S O C}{S O C-N_s Q_{\mathrm{n}} \int_0^t i(\tau) \mathrm{d} \tau}+E_{\mathrm{t}} \\ S O C=\frac{N_s N_{\mathrm{p}} Q_{\mathrm{n}}-\int_0^t i(\tau) \mathrm{d} \tau}{N_s N_{\mathrm{p}} Q_{\mathrm{n}}} \times 100 \% \\ C_{\mathrm{b}}=C_{\mathrm{t}}\left(T_{\mathrm{b}}-25\right) \\ E_{\mathrm{t}}=A \exp \left(-B \int_0^t i(\tau) \mathrm{d} \tau+C \mathrm{~b}\right)\end{array}\right.$ (6)
where, Ns is the number of cells in series; E0 is the initial potential; K is the polarization voltage constant; A and B are the voltage and capacity variation coefficients; Qn is the rated capacity of the battery; SOC is the state of charge; i(t) is the charge/discharge current; Ct is the polarization effect coefficient; Tb is the battery temperature; Np is the number of cells in parallel with the battery pack.
3.1 Direct drive wind turbine control
The q-axis adopts the power outer ring, and the current inner ring is controlled to achieve optimal output. In order to avoid permanent magnet demagnetization, id = 0 control is adopted, and the optimal output force is obtained by looking up the table method according to the relationship between rotor speed ws and power, Pref=f(ω); Pw contributes to the fan; id, iq is d, q axis current; Udc is the DC bus voltage, corresponding to the control equation:
$\left\{ \begin{align} & {{M}_{\text{q}}}=\frac{\begin{align} & -{{i}_{\text{d}}}{{\omega }_{\text{s}}}{{L}_{\text{d}}}+{{\omega }_{\text{s}}}{{\psi }_{\text{f}}}-\left( {{\text{k}}_{\text{p1}}}\text{+}\frac{\text{ki}1}{\text{s}} \right) \\ & \left[ \left( {{\text{k}}_{\text{p2}}}\text{+}\frac{\text{ki2}}{\text{s}} \right)\left( {{P}_{\text{ref}}}-{{P}_{\text{gen}}} \right)-{{i}_{\text{q}}} \right] \\ \end{align}}{U\text{dc}} \\ & {{M}_{\text{d}}}=\frac{{{i}_{\text{d}}}{{\omega }_{\text{s}}}L\text{q}-\left( {{\text{k}}_{\text{p3}}}\text{+}\frac{\text{ki3}}{\text{s}} \right)\left( {{i}_{\text{dref}}}-i\text{d} \right)}{U\text{dc}} \\ \end{align} \right.$ (7)
where, Mq/Md are the trigger pulses for the q/d axis, kpn, kin, n=1,2,3... are the proportional and integral coefficients, with the subscript ref are the reference values of the corresponding physical quantities, and the following is not explained in this category, all of which are PI control coefficients.
Corresponding control equation:
$\left\{ \begin{align} & {{M}_{\text{q1}}}=\frac{i\text{d1}\omega \text{L}+\left( {{\text{k}}_{\text{p4}}}\text{+}\frac{\text{ki4}}{\text{s}} \right)\left( {{i}_{\text{q1ref}}}-{{i}_{\text{q1}}} \right)}{U\text{dc}} \\ & {{M}_{\text{d1}}}=\frac{-{{i}_{\text{q1}}}\omega \text{L}+\left( {{\text{k}}_{\text{p5}}}\text{+}\frac{\text{ki}5}{\text{s}} \right)\left( {{i}_{\text{d1ref}}}-i\text{d1} \right)\text{+}{{U}_{\text{d2}}}}{U\text{dc}} \\ & {{i}_{\text{d1ref}}}=\left( {{\text{k}}_{\text{p6}}}\text{+}\frac{\text{ki6}}{\text{s}} \right)\left( {{U}_{\text{dcref}}}-{{U}_{\text{dc}}} \right) \\ & {{i}_{\text{q1ref}}}\text{=0} \\ \end{align} \right.$ (8)
where, id1/iq1 is the net-side d/q-axis current and Ud2 is the net-side d-axis voltage. In order to keep the DC voltage stable and ensure that the reactive power output is 0, the d-axis is controlled by a constant DC voltage, with an external voltage loop and an internal current loop, given that iqref=0, to reduce the inverter capacity and save costs.
Machine-side converter control (Figure 3) [8].
Figure 3. Permanent magnet direct drive wind power group side control block diagram
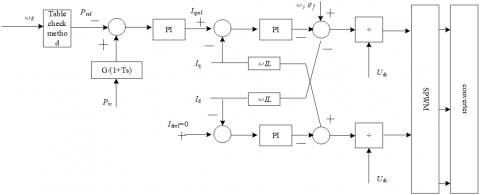
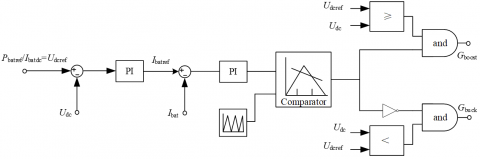
Grid-side converter control (Figure 4) [8]:
Figure 4. Permanent magnet direct drive wind power group network side control block diagram
3.2 Photovoltaic power converter control
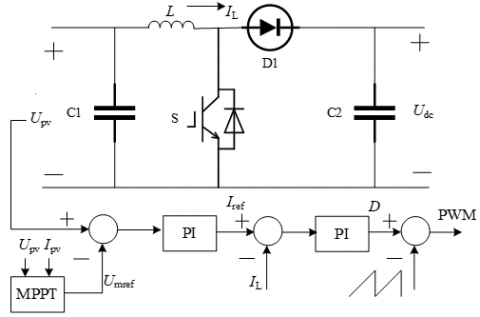
The PV panel is stepped up by the Boost circuit and connected to the DC bus with the following control block diagram (Figure 5):
Figure 5. Photovoltaic Boost circuit control block diagram
Using Upv output voltage and Ipv as input parameters, MPPT control is obtained through the conductance increment method to achieve maximum power tracking, and the resulting Umref value is compared with Upv to obtain the current inner loop given value by PI control, and then the converter trigger pulse is obtained by one PI control, corresponding to the control equation as follows:
$\left\{ \begin{align} & M=({{I}_{ref}}-{{I}_{L}})\left( {{\text{k}}_{\text{p1}}}\text{+}\frac{\text{ki1}}{\text{s}} \right) \\ & {{I}_{\text{ref}}}=\left( {{\text{k}}_{\text{p}}}\text{+}\frac{\text{ki}}{\text{s}} \right)\left( {{U}_{\text{mref}}}-{{U}_{\text{pv}}} \right) \\ \end{align} \right.$ (9)
where, Iref is the Boost converter reference current, IL is the inductor current, Kp1, Ki1, Kp, Ki are the corresponding current inner loop and voltage outer loop proportional integration coefficients.
3.3 Battery energy storage converter control
Charging and discharging control is achieved by using bi-directional Buck/Boost, with Boost for discharging and Buck for charging, and the specific control is as follows:
Figure 6. Block diagram of bidirectional Buck/Boost control for batteries
In Figure 6, Pbatref is the battery power reference value; Ibat is the battery current, Udc is the DC bus voltage value; Ibatdc is the battery DC side current, depending on the size of the DC voltage reference value and the actual value to determine the output mode.
3.4 System power control scheme
There are 4 working conditions, corresponding to the following power profiles.
Condition 1: When the wind speed or solar irradiation rises, that is, Pwind and Ppv increase, the system active surplus Pnet > 0, at this time Pwind+Ppv = Pload+Pes-in, at this time the parallel network frequency f according to f>fref direction, from f tends to ref, where Pwind, Ppv, Pload,Pes-in are the fan output power, photovoltaic Pwind, Ppv, Pload, Pes-in are the wind turbine output power, PV output power, demand load, power absorbed by the energy storage system and the storage system capacity is exactly equal to Pwind+Ppv- Pload, fref is the rated frequency 50Hz.
Condition 2: When the wind speed or solar irradiation rises, that is, Pwind and Ppv increase, the system active surplus Pnet > 0, but the energy storage system absorption has reached its limit, at this time Pwind + Ppv > Pload + Pes-in-max, the frequency is in line with f > fref.
Condition 3: When the wind speed or solar irradiation decreases, that is, Pwind and Ppv decrease, the system active power deficit Pnet < 0, the energy storage system can supplement the difference in power, at this time Pwind + Ppv + Pes-out = Pload, the frequency converges to the rated frequency according to the direction of f < fref, Pes-out is the power issued by the energy storage system.
Condition 4: When the wind speed or solar irradiation decreases, that is, Pwind and Ppv decrease, the system has insufficient power Pnet < 0, the energy storage system cannot supplement the differential power, at this time Pwind + Ppv + Pes-out-max < Pload, the frequency converges to the rated frequency according to the direction of f < fref, Pes-out-max is the limit of the power issued by the energy storage system.
The remaining insufficient power is supplemented by an external grid.
3.5 Simulation analysis
The system model shown in Figure 1 was established in Matlab/Simulink as shown in Figure 7. The simulation parameters are shown in Table 1 and the equipment parameters are derived from actual data from a wind farm in the Inner Mongolia Autonomous Region.
Figure 7. Model of wind-solar combined power generation system based on Matlab/Simulink
Table 1. Equipment parameters
|
Equipment name |
Numeric value |
|
Wind turbine capacity |
120MW |
|
PV system capacity |
80MW |
|
Battery storage capacity |
10.4MW |
|
Rated wind speed |
14.5m/s |
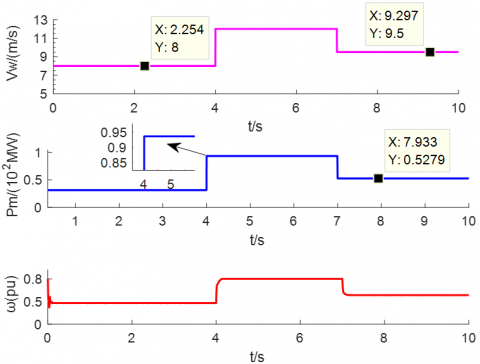
The wind speed and wind turbine output are shown in Figure 8, where the wind farm is equated to a single turbine for the simulation study.
As can be seen from Figure 8, the wind speed is set in three steps, below the rated wind speed, at this moment the pitch angle is 0, 0~4s wind speed is 8m/s, 4~7s is 12m/s, 7~10s is 9.5m/s, corresponding to the speed standard value of 0.48, 0.8, 0.6, the wind turbine output power is 30MW, 95MW, 52MW, the output of the wind turbine varies randomly with wind speed, and the torque tracking is consistent, indicating that the modeling is correct (Table 2).
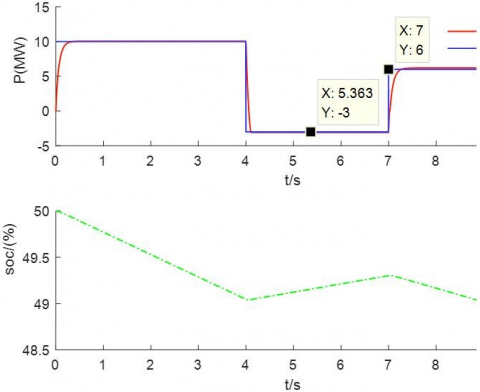
The power output of the energy storage battery system is shown in Figure 9.
Battery energy storage is responsible for supplementing the load demand when the wind and photovoltaic output is insufficient, 10MW is sent out during 0 to 4s, 3MW is absorbed at 4 to 7s, and 6MW is emitted at 7 to 9.2s, and the SOC state is in line with the power charge and discharge situation.
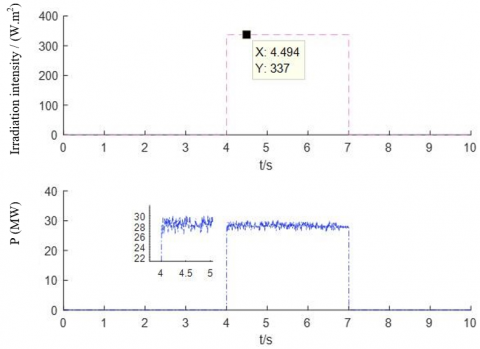
The output of photovoltaic power generation is shown in Figure 10. Photovoltaic output is affected by solar irradiation intensity, with an irradiation intensity of 337W.m2 from 4 to 7s, corresponding to a power output of 28MW.
Table 2. Control parameters
|
Control parameters |
Numeric value |
Control parameters |
Numeric value |
Control parameters |
Numeric value |
|
PMSG q-axis current control scaling factor |
1.5 |
PMSG network side q-axis current scaling factor |
1.2 |
PMSG active control scaling factor |
1.1 |
|
PMSG q-axis current control integration factor |
0.5 |
PMSG net-side q-axis current integration factor |
58.1 |
PMSG active control integration factor |
0.02 |
|
PMSG d-axis current control scaling factor |
2.55 |
PMSG net-side d-axis current scaling factor |
3.1 |
PMSG DC voltage control scaling factor |
0.5 |
|
PMSG d-axis current Control integration factor |
0.05 |
PMSG net-side d-axis current integration factor |
0.6 |
PMSG DC voltage control integration factor |
0.01 |
|
Boost voltage outer loop scaling factor |
58 |
Boost current inner loop proportionality factor |
36 |
Battery converter voltage outer ring scaling factor |
84 |
|
Boost voltage outer loop integration factor |
10 |
Boost current inner loop Integration factor |
105 |
Battery converter voltage outer loop integration factor |
201 |
|
Battery converter current inner loop scaling factor |
138 |
Battery converter current inner loop integration factor |
501 |
—— |
—— |
Figure 8. Wind speed and wind turbine output
Figure 9. Energy storage battery output
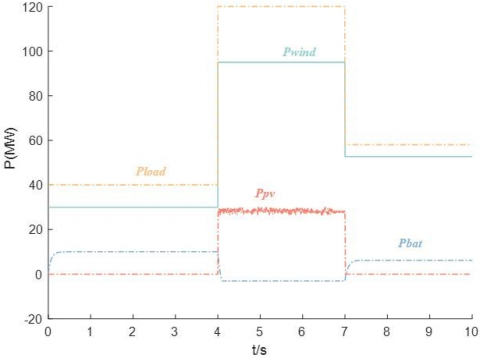
The load is set in three steps of 40MW, 120MW and 58MW respectively, and the power balance of each time period is as follows: 30MW from wind power and 10MW from storage battery in 0~4s; 95MW from wind power, 28MW from PV battery and 3MW from storage battery in 4~7s; 52MW from wind power and 6MW from storage battery in 7~10s. It can be seen that the coordinated cooperation between wind power, PV and battery units ensures the power balance of the system and meets the load demand.
Figure 10. Photovoltaic cell power output
The overall output and load variation of the system are shown in Figure 11.
Figure 11. Load demand and overall output
Starting from the power generation principles of photovoltaic battery, wind turbine and battery storage, the mathematical model of each part is introduced, the corresponding simulation topology is constructed, the system power coordination method is expounded, and the simulation results in Matlab/Simulink are analyzed, and the following conclusions are drawn:
1) The established model of wind, solar, storage and combined power generation system is correct and effective, and the models of wind power, photovoltaic and battery are error-free, which ensures the reliability of power supply.
2) The proposed wind, solar and storage combined power generation system grid connection scheme can realize the power balance between wind power, photovoltaic, battery storage and electricity load, and can meet the system requirements through cooperation, and promote the rational utilization of wind energy, solar energy, and electrochemical energy storage.
[1] Wang, J., Li, H., Peng, Y. (2022). Three application models of renewable energy under the carbon neutrality target. Modern Chemistry, 42(5): 1-6.
[2] Yan, J., Dong, Z., Liu, L. (2022). Research on grid-connected inverter control strategy of wind-solar complementary power generation system. Electrical Automation, 44(1): 27-30.
[3] Meng, D., Liu, W., Cui, M. (2021). Research on coordinated control strategy and grid connection of wind-solar complementary power generation system. Journal of Hebei Institute of Water Conservancy and Electric Power, 31(2): 51-55+66.
[4] Zhang, J., Wang, S. (2017). Coordinated control strategy for energy optimization management of independently operating wind and solar complementary power generation systems. Journal of Solar Energy, 38(10): 2894-2903.
[5] Cai, G.W., Chen, C., Kong, L.G. (2016). Modeling and control of wind power/photovoltaic/hydrogen production/supercapacitor grid-connected system. Power System Technology, 40(10): 2982-2990.
[6] Kong, L., Cai, G., Chen, C. (2017). Model formation and grid-connection control of active permanent magnet direct-drive wind turbine based on hydrogen energy storage. Journal of Electrical Engineering Technology, 32(18): 276-285.
[7] Cai, G., Kong, L., Pan, C. (2013). Modeling and grid-connected control strategies for wind-solar storage co-generation systems. Journal of Electrical Engineering Technology, 28(9): 196-204.
[8] Chen, C. (2017). Modeling and grid-connection control of wind power/hydrogen production/fuel cell integrated system. Northeastern Electric Power University.