Asadi Suresh Kumar* | Vyza Usha Reddy
© 2021 IIETA. This article is published by IIETA and is licensed under the CC BY 4.0 license (http://creativecommons.org/licenses/by/4.0/).
OPEN ACCESS
One of the major concerns for continuous solar photovoltaic (PV) generation is partial shading. The movement of clouds, shadow of buildings, trees, birds, litter and dust, etc., can lead to partial shadow conditions (PSCs). The PSCs have caused inconsistent power losses in the PV modules. This leads to a shortage of electricity production and the presence in the PV curve of several peaks. One of the simplest solutions to PSC’s is the PV configurations. The objective of this paper is modelling and simulation of solar PV system in various shading scenarios for KC200GT 200 W, 5 x 5 configurations that includes Series/Parallel (SP), Total-Cross-Tied (TCT), Triple-Tied (TT), Bridge-Link (BL) configurations. Real time PSC’s such as corner, center, frame, random, diagonal, right side end shading conditions are evaluated under all PV array configurations. A comparative analysis is carried out for the parameters such as open circuit voltage, short circuit current, maximum power point, panel mismatch losses, fill factor, efficiency under all PV configurations considering PSC’s. From the comparison analysis best configuration will be presented.
SP, TCT, TT, BL, PV, PSC
The need for electricity demand is increasing all over the world [1]. The best solution for ever-increasing electricity demand is through renewable energy sources (RES). Solar, wind, geothermal and biomass sources are some of the RES. Among the RES solar energy is popular. However, cost associated with installation and poor energy harnessing capabilities impact negatively. The uncertain non-linear power-voltage (P-V) and current-voltage (I-V) characteristic of PV panel are the key components of solar energy. The series and parallel connections of PV cells build a module. The performance and the reliability of the PV panel usually depends primarily on the occurrence of solar irradiance (G) and temperature (T) [2] insulation. Maximum power of PV module can be tracked using various techniques [3]. The major factors that affect maximum power point are partial shading conditions (PSC). PSC’s not only come from passing clouds, but also from shades of birds, dust, surrounding buildings, and snow covering etc., [4]. All PV modules receive different insolation levels under PSC which lead to voltage and current differences between modules, thus creating hot spots in shaded PV modules. The diode is annexed as bypass diode [5] in order to avoid hot spot issues. Due to PSC’s multiple maximum power point’s will be created in P-V curve also called as local maximum power point. The best of local maximum power point’s is called as global maximum power point. Due to the multiple maximum power points power losses increases, degrades the energy conversion efficiency etc.
Many researchers have recommended several methodologies to overcome PSC’s, such as MPPT tracking methodologies, PV converter control strategies, PV panel reconfiguration strategies etc. Several MPPT techniques are discussed by Bollipo et al. [3] under PSC’s. Conventional MPPT methods like P&O, IC and HC are not capable to track global maximum power point [6]. Intelligent based MPPT techniques shows the better performance than the conventional methods to track the global maximum power point [7-9]. Nevertheless, intelligent methods are complex in hardware implementation. Ali et al. [10] addressed the drawbacks of intelligent MPPT methods. Bingöl and Özkaya [11] reviewed and compared several PV panel configurations S, S-P, T-C-T, B-L, H-C, T-T. In this paper is modelling and simulation of solar PV system in various shading scenarios for KC200GT 200 W, 5 x 5 configurations that includes SP, TCT, TT, BL configurations. Real time PSC’s such as corner, center, frame, random, diagonal, right side end shading conditions are evaluated under all PV array configurations. A comparative analysis is carried out for the parameters such as Maximum Voltage Vmp (V), Maximum Current Imp (A), Maximum Power Pmp (W), Open Circuit Voc (V), Short Circuit Current Isc (A), Fill Factor FF (%), PV Mismatch losses Pml (%), Efficiency η (%) under all PV configurations considering PSC’s. From the comparison analysis best configuration will be presented.
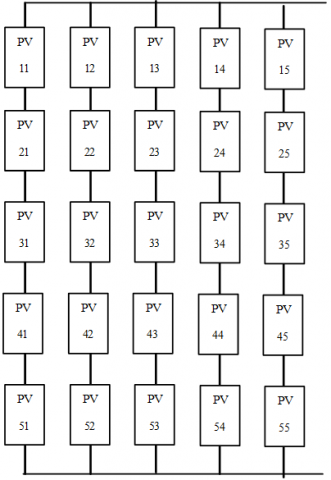
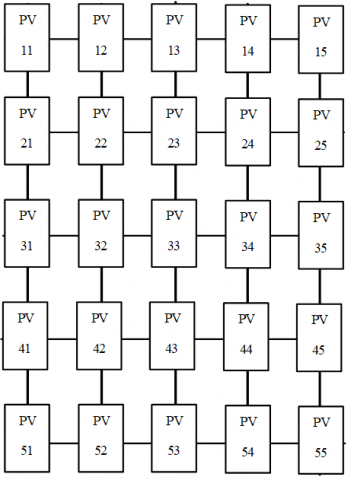
In this paper a 200 W, 5 X 5 KC200GT PV system is considered as test case. The specifications of KC200GT PV panel are tabulated in Table 1. The test case is implemented for SP, TCT, TT, BL configurations shown in Figure 1. PSC’s such as corner, center, frame, random, diagonal, right side end shading conditions are evaluated under all PV panel configurations shown in Figure 2.
Table 1. PV panel specifications
|
Name |
Specification |
|
Maximum Power Pmp |
200.14 W |
|
Maximum Voltage Vmp |
26.3 V |
|
Maximum Current Imp |
7.6 A |
|
O. C. Voltage Voc |
32.9 V |
|
S. C. Current Isc |
8.2 A |
|
No.of Cells |
54 |
(a) SP PV panel configurations
(b) TCT PV panel configurations
(c) BL PV panel configurations
(d) TT PV panel configurations
Figure 1. PV panel configurations
Figure 2. Partial Shading Conditions (PSC’s)
In this paper 200 W, 5 X 5 KC200GT PV system is implemented under several PSC’s considering SP, TCT, BL, TT configurations. The PSC’s considered are shown below (Figure 3).
• Uniform (without PSC);
• Corner PSC;
• Center PSC;
• Frame PSC;
• Random PSC;
• Diagonal PSC;
• Right Side End PSC.
Figure 3. 5 X 5 PV configuration
3.1 Performance evaluation considering uniform (without PSC) condition
In this case performance of proposed PV system is evaluated considering SP, TCT, TT, BL configurations under Uniform (without PSC) condition. In Uniform (without PSC) condition solar irradiance is considered uniformly as 1000 W/m2 and temperature as 25℃ for all 5 X 5 panels. Performance parameters such as Vmp (V), Imp (A), Pmp (W), Voc (V), Isc (A), (%), Pml (%), η (%) are evaluated and tabulated in Table 2.
In the Uniform (without PSC) Condition for all configurations the Efficiency η (%) is same i.e. 14.155.
3.2 Performance evaluation considering corner PSC
In this case performance of proposed PV system is evaluated considering SP, TCT, TT, BL configurations under Corner PSC. In Corner PSC, for 1 X 1, 1 X 2, 2 X 1, 2 X 2 panels, solar irradiance is considered as 200 W/m2 400 W/m2, 600 W/m2, 800 W/m2 respectively, for remaining panels solar irradiance is considered as 1000 W/m2 and temperature as 25℃. Performance parameters such as Vmp (V), Imp (A), Pmp (W), Voc (V), Isc (A), (%), Pml (%), η (%) are evaluated and tabulated in Table 3.
In the Corner PSC Condition TCT configuration recorded the maximum Efficiency η (%) i.e. 12.255%.
3.3 Performance evaluation considering center PSC
In this case performance of proposed PV system is evaluated considering SP, TCT, TT, BL configurations under Center PSC. In Center PSC, for 2 X 1, 2 X 2, 2 X 3 panels, solar irradiance is considered as 200 W/m2 400 W/m2, 600 W/m2, respectively, similarly for 3 X 1, 3 X 2, 3 X 3 and 4 X 1, 4 X 2, 4 X 3 panels, for remaining panels solar irradiance is considered as 1000 W/m2 and temperature as 25℃. Performance parameters such as Vmp (V), Imp (A), Pmp (W), Voc (V), Isc (A), (%), Pml (%), η (%) are evaluated and tabulated in Table 4.
Table 2. Performance evaluation considering uniform (without PSC) condition
|
Configuration Type |
Vmp (V) |
Imp (A) |
Pmp (W) |
Voc (V) |
Isc (A) |
FF (%) |
∆Pml (%) |
η (%) |
|
SP |
131.505 |
38.051 |
5003.846 |
164.490 |
41.108 |
74.002 |
0.000 |
14.155 |
|
TCT |
131.505 |
38.051 |
5003.846 |
164.490 |
41.108 |
74.002 |
0.000 |
14.155 |
|
BL |
131.505 |
38.051 |
5003.846 |
164.490 |
41.108 |
74.002 |
0.000 |
14.155 |
|
TT |
131.505 |
38.051 |
5003.846 |
164.490 |
41.108 |
74.002 |
0.000 |
14.155 |
Table 3. Performance evaluation considering corner PSC
|
Configuration Type |
Vmp (V) |
Imp (A) |
Pmp (W) |
Voc (V) |
Isc (A) |
FF (%) |
∆Pml (%) |
η (%) |
|
SP |
127.563 |
32.522 |
4148.526 |
162.685 |
41.095 |
62.053 |
20.618 |
11.735 |
|
TCT |
141.665 |
30.583 |
4332.486 |
162.845 |
41.077 |
64.769 |
15.496 |
12.255 |
|
BL |
125.960 |
31.744 |
3998.476 |
162.770 |
41.088 |
59.787 |
25.144 |
11.311 |
|
TT |
140.235 |
30.014 |
4209.001 |
162.800 |
41.080 |
62.936 |
18.884 |
11.906 |
Table 4. Performance evaluation considering center PSC
|
Configuration Type |
Vmp (V) |
Imp (A) |
Pmp (W) |
Voc (V) |
Isc (A) |
FF (%) |
∆Pml (%) |
η (%) |
|
SP |
127.938 |
32.032 |
4098.083 |
162.285 |
41.083 |
61.467 |
22.102 |
11.592 |
|
TCT |
143.440 |
30.534 |
4379.842 |
162.455 |
41.049 |
65.679 |
14.247 |
12.389 |
|
BL |
139.050 |
29.814 |
4145.639 |
162.365 |
41.069 |
62.171 |
20.702 |
11.727 |
|
TT |
142.125 |
30.053 |
4271.299 |
162.350 |
41.066 |
64.066 |
17.151 |
12.082 |
In the Center PSC Condition TCT configuration recorded the maximum Efficiency η (%) i.e. 12.389%.
3.4 Performance evaluation considering frame PSC
In this case performance of proposed PV system is evaluated considering SP, TCT, TT, BL configurations under Frame PSC. In Frame PSC, for 1 X 1, 1 X 2, 1 X 3, 1 X 4, 1 X 5 panels, solar irradiance is considered as 200 W/m2 400 W/m2, 600 W/m2, 800 W/m2, 1000 W/m2 respectively, similarly for 1 X 1, 1 X 2, 1 X 3, 1 X 4, 1 X 5, 2 X 5, 3 X 5, 4 X 5, 5 X 5, 5 X 1, 5 X 2, 5 X 3, 5 X 4, 5 X 5 panels, for remaining panels solar irradiance is considered as 1000 W/m2 and temperature as 25℃. Performance parameters such as Vmp (V), Imp (A), Pmp (W), Voc (V), Isc (A), (%), Pml (%), η (%) are evaluated and tabulated in Table 5.
In the Frame PSC Condition TCT configuration recorded the maximum Efficiency η (%) i.e. 11.648%.
3.5 Performance evaluation considering random PSC
In this case performance of proposed PV system is evaluated considering SP, TCT, TT, BL configurations under Random PSC. In Random PSC, solar irradiance is considered as 200 W/m2 400 W/m2, 600 W/m2, 800 W/m2, 1000 W/m2 for random panels, for remaining panels solar irradiance is considered as 1000 W/m2 and temperature as 25℃. Performance parameters such as Vmp (V), Imp (A), Pmp (W), Voc (V), Isc (A), (%), Pml (%), η (%) are evaluated and tabulated in Table 6.
In the Random PSC Condition TT configuration recorded the maximum Efficiency η (%) i.e. 12.703%.
3.6 Performance evaluation considering diagonal PSC
In this case performance of proposed PV system is evaluated considering SP, TCT, TT, BL configurations under Diagonal PSC. In Diagonal PSC, for all diagonal panels solar irradiance is considered as 200 W/m2 400 W/m2, 600 W/m2, 800 W/m2, 1000 W/m2 respectively, for remaining panels solar irradiance is considered as 1000 W/m2 and temperature as 25℃. Performance parameters such as Vmp (V), Imp (A), Pmp (W), Voc (V), Isc (A), (%), Pml (%), η (%) are evaluated and tabulated in Table 7.
In the Diagonal PSC Condition TT configuration recorded the maximum Efficiency η (%) i.e. 13.407%.
3.7 Performance evaluation considering right side end PSC
In this case performance of proposed PV system is evaluated considering SP, TCT, TT, BL configurations under Right Side End PSC. In Right Side End PSC, for 5 X 1, 5 X 2, 5 X 3, 5 X 4, 5 X 5 panels solar irradiance is considered as 200 W/m2 400 W/m2, 600 W/m2, 800 W/m2, 1000 W/m2 respectively, for remaining panels solar irradiance is considered as 1000 W/m2 and temperature as 25℃. Performance parameters such as Vmp (V), Imp (A), Pmp (W), Voc (V), Isc (A), (%), Pml (%), η (%) are evaluated and tabulated in Table 8.
In the Right Side End PSC Condition TCT configuration recorded the maximum Efficiency η (%) i.e. 13.098%.
Table 5. Performance evaluation considering frame PSC
|
Configuration Type |
Vmp (V) |
Imp (A) |
Pmp (W) |
Voc (V) |
Isc (A) |
FF (%) |
∆Pml (%) |
η (%) |
|
SP |
120.425 |
25.883 |
3116.914 |
158.072 |
32.808 |
60.103 |
60.539 |
8.817 |
|
TCT |
143.918 |
28.612 |
4117.726 |
159.071 |
28.712 |
90.159 |
21.520 |
11.648 |
|
BL |
143.577 |
22.325 |
3205.287 |
158.840 |
32.849 |
61.431 |
56.112 |
9.067 |
|
TT |
141.885 |
26.808 |
3803.669 |
158.915 |
31.118 |
76.918 |
31.553 |
10.760 |
Table 6. Performance evaluation considering random PSC
|
Configuration Type |
Vmp (V) |
Imp (A) |
Pmp (W) |
Voc (V) |
Isc (A) |
FF (%) |
∆Pml (%) |
η (%) |
|
SP |
111.000 |
35.308 |
3919.167 |
161.947 |
41.097 |
58.886 |
27.676 |
11.086 |
|
TCT |
142.775 |
30.367 |
4335.593 |
162.470 |
37.684 |
70.814 |
15.413 |
12.264 |
|
BL |
142.815 |
27.707 |
3957.034 |
162.320 |
41.075 |
59.350 |
26.455 |
11.193 |
|
TT |
143.205 |
31.358 |
4490.610 |
162.305 |
41.014 |
67.460 |
11.429 |
12.703 |
Table 7. Performance evaluation considering diagonal PSC
|
Configuration Type |
Vmp (V) |
Imp (A) |
Pmp (W) |
Voc (V) |
Isc (A) |
FF (%) |
∆Pml (%) |
η (%) |
|
SP |
110.550 |
38.017 |
4202.770 |
162.510 |
41.100 |
62.924 |
19.061 |
11.889 |
|
TCT |
145.905 |
32.484 |
4739.624 |
162.875 |
36.864 |
78.939 |
5.575 |
13.407 |
|
BL |
116.290 |
36.784 |
4277.566 |
162.665 |
38.561 |
68.196 |
16.979 |
12.100 |
|
TT |
135.960 |
34.066 |
4631.656 |
162.860 |
36.925 |
77.020 |
8.036 |
13.102 |
Table 8. Performance evaluation considering right side end PSC
|
Configuration Type |
Vmp (V) |
Imp (A) |
Pmp (W) |
Voc (V) |
Isc (A) |
FF (%) |
∆Pml (%) |
η (%) |
|
SP |
124.000 |
34.156 |
4235.358 |
161.822 |
36.124 |
72.454 |
18.145 |
11.981 |
|
TCT |
140.675 |
32.915 |
4630.376 |
161.900 |
36.043 |
79.351 |
8.066 |
13.098 |
|
BL |
137.754 |
31.518 |
4341.705 |
161.873 |
36.142 |
74.212 |
15.251 |
12.282 |
|
TT |
138.765 |
32.116 |
4456.509 |
161.885 |
36.105 |
76.247 |
12.282 |
12.606 |
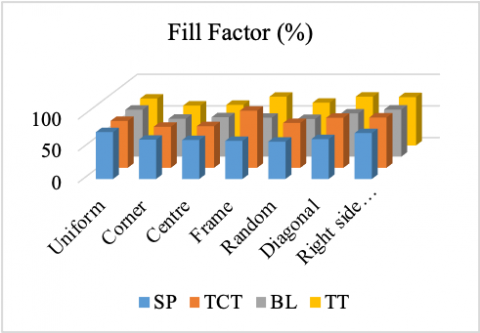
Figure 4. Fill Factor comparison
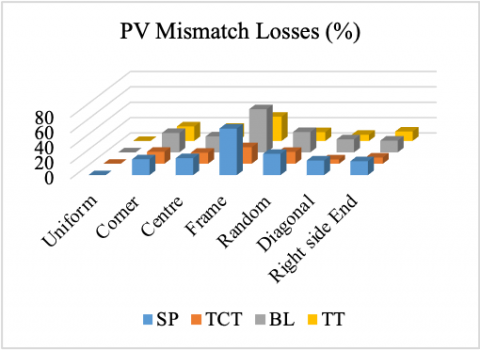
Figure 5. PV Mismatch losses comparison
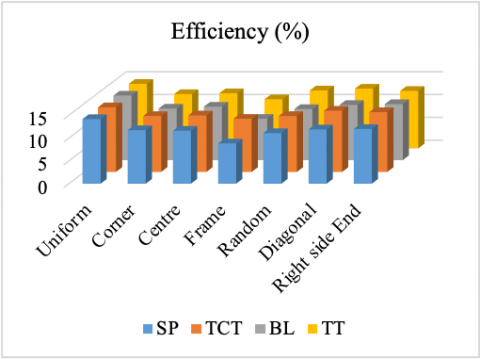
Performance evaluation parameters Fill Factor FF (%), PV Mismatch losses Pml (%), Efficiency η (%), Maximum Power Pmp (W) are compared for all configurations under proposed PSC’s and shown in Figure 4, Figure 5, Figure 6, Figure 7 respectively.
In all the configurations TCT configuration exhibits best performance under all PSC’s shown in Table 9.
Figure 6. Efficiency comparison
Figure 7. PV Maximum power
Table 9. Performance of TCT Configuration
|
Confg.\PSC |
Uniform |
Corner |
Centre |
Frame |
Random |
Diagonal |
Right side End |
|
Fill Factor (%) |
74.00 |
64.77 |
65.68 |
90.16 |
70.81 |
78.94 |
79.35 |
|
PV Mismatch Losses (%) |
0.00 |
15.50 |
14.25 |
21.52 |
15.41 |
5.57 |
8.07 |
|
Efficiency (%) |
14.15 |
12.26 |
12.39 |
11.65 |
12.26 |
13.41 |
13.10 |
|
Maximum Power (%) |
5003.85 |
4332.49 |
4379.84 |
4117.73 |
4335.59 |
4739.62 |
4630.38 |
In this paper modelling and simulation of solar PV system in various shading scenarios for KC200GT 200 W, 5 x 5 configurations that includes Series-Parallel (SP), Total Cross-Tied (TCT), Triple-Tied (TT), Bridge-Link (BL) configurations are presented and implemented in MATLAB/Simulink environment. Real time PSC’s such as corner, center, frame, random, diagonal, right side end shading conditions are evaluated under all PV array configurations. A comparative analysis is carried out for the parameters such as open circuit voltage, short circuit current, maximum power point, panel mismatch losses, fill factor, efficiency under all PV configurations considering PSC’s. It is observed from the comparison analysis, TCT configuration exhibits best performance under all PSC’s. Hence this paper proposes TCT configuration for grid connected and standalone applications.
[1] Kshatri, S.S., Dhillon, J., Mishra, S. (2021). Impact of solar irradiance and ambient temperature on PV inverter reliability considering geographical locations. International Journal of Heat and Technology, 39(1): 292-298. https://doi.org/10.18280/ijht.390132
[2] Manganiello, P., Balato, M., Vitelli, M. (2015). A survey on mismatching and aging of PV modules: The closed loop. IEEE Transactions on Industrial Electronics, 62(11): 7276-7286. https://doi.org/10.1109/TIE.2015.2418731
[3] Bollipo, R.B., Mikkili, S., Bonthagorla, P.K. (2020). Hybrid, optimal, intelligent and classical PV MPPT techniques: A review. CSEE Journal of Power and Energy Systems, 7(1): 9-33. https://doi.org/10.17775/CSEEJPES.2019.02720
[4] Rana, A.S., Nasir, M., Khan, H.A. (2018). String level optimisation on grid‐tied solar PV systems to reduce partial shading loss. IET Renewable Power Generation, 12(2): 143-148. https://doi.org/10.1049/iet-rpg.2017.0229
[5] Zhang, Y., Yu, Y., Meng, F., Liu, Z. (2019). Experimental investigation of the shading and mismatch effects on the performance of bifacial photovoltaic modules. IEEE Journal of Photovoltaics, 10(1): 296-305. https://doi.org/10.1109/JPHOTOV.2019.2949766
[6] Dadkhah, J., Niroomand, M. (2021). Optimization methods of MPPT parameters for PV systems: Review, classification, and comparison. Journal of Modern Power Systems and Clean Energy, 9(2): 225-236. https://doi.org/10.35833/MPCE.2019.000379
[7] Hanzaei, S.H., Gorji, S.A., Ektesabi, M. (2020). A scheme-based review of MPPT techniques with respect to input variables including solar irradiance and PV arrays’ temperature. IEEE Access, 8: 182229-182239. https://doi.org/10.1109/ACCESS.2020.3028580
[8] Ramli, M.A., Twaha, S., Ishaque, K., Al-Turki, Y.A. (2017). A review on maximum power point tracking for photovoltaic systems with and without shading conditions. Renewable and Sustainable Energy Reviews, 67: 144-159. https://doi.org/10.1016/j.rser.2016.09.013
[9] Dhimish, M. (2019). Assessing MPPT techniques on hot-spotted and partially shaded photovoltaic modules: Comprehensive review based on experimental data. IEEE Transactions on Electron Devices, 66(3): 1132-1144. https://doi.org/10.1109/TED.2019.2894009
[10] Ali, A., Almutairi, K., Padmanaban, S., Tirth, V., Algarni, S., Irshad, K., Malik, M.Z. (2020). Investigation of MPPT techniques under uniform and non-uniform solar irradiation condition–a retrospection. IEEE Access, 8: 127368-127392. https://doi.org/10.1109/ACCESS.2020.3007710
[11] Bingöl, O., Özkaya, B. (2018). Analysis and comparison of different PV array configurations under partial shading conditions. Solar Energy, 160: 336-343. https://doi.org/10.1016/j.solener.2017.12.004