Rakhi Yadav* | Yogendra Kumar
© 2021 IIETA. This article is published by IIETA and is licensed under the CC BY 4.0 license (http://creativecommons.org/licenses/by/4.0/).
OPEN ACCESS
Non-technical losses (NTL), which occur up to 40% of the total electric transmission and distribution power, create many challenges worldwide. These losses have a severe impact on distribution utilities and adversely affect the performance of electrical distribution networks. Furthermore, the depreciation of these NTL reduces the requirement of new power plants to fulfill the demand-supply gap. Hence, NTL is an emerging research area for electrical engineers. This paper proposed a model for the detection of non-technical losses based on machine learning and feature engineering. Experimental results check the performance of the proposed model. These results clearly show that this proposed detection model has better accuracy, precision, recall, F1 score, and AUC score than other existing approaches.
smart meter, machine learning, non-technical losses, CWR, feature engineering, SMOTE
The Power grids have a significant role in the development of any country. Unfortunately, these grids are adversely affected by non-technical losses (NTL). For every utility, NTL is a very challenging issue. Across the world, cost estimation per annum for electricity suppliers due to these losses is around 100 billion USD; and by minimizing NTL, revenue, profit, and reliability of the grid can be enhanced. Hence, expenditures due to NTL are of vital interest to authorities.
Nowadays, due to urbanization and living standards, the requirement for electrical energy is increasing. We have limited fossil fuels that are intended to move towards electricity. During electricity generation, transmission, and distribution, two types of losses, i.e., technical and non-technical, occur. The internal resistance of the transformer, generator and transmission lines creates technical losses. In Western Europe, these types of losses result in around 1-2 % of total efficient electricity distribution, and in the case of non-efficient systems, it may vary up to 9-12% Golden and Min [1] or 2-6% [2]. Antmann [3] has defined non-technical losses as electricity theft, errors in meter reading, record keeping, accounting, broken or faulty infrastructure.
Electricity theft can be further divided as:
In refs. [2, 4], authors have reported that financial losses of around one thousand million US dollars occur worldwide due to these losses. These losses represent the significant share of total losses compared to technical losses, which is the motivation to write this paper.
Much work has been done to resolve the above issue based on Artificial-intelligence by applying machine learning and deep learning methods. Existing machine learning methods have been sub-divided into two parts, i.e., classification and clustering models [5-8]. But existing machine learning detection methods are not effective enough for the implementation as most of these approaches still require manual feature extraction, which indicates the inability to handle high-dimensional data, i.e., standard deviation, maximum, and minimum consumption data. Manual feature extraction is a mind-numbing and sluggish process and cannot capture the 2D features from smart meter data. However, among various classifiers, the random forest (RF) classifier takes the benefits of two machine learning techniques, including bagging and random feature selection. Therefore, machine learning-based detection of the non-technical losses faces various challenging issues such as class imbalance, data quality, comparison of different methods, feature description, and selection.
The issues mentioned above are resolved by the proposed machine learning and feature engineering-based model. In the proposed model, feature engineering has been used for data pre-processing, outlier detection, and removal. The data is received from an electric company in an unbalanced condition, further balanced using the synthetic minority over-sampling technique (SMOTE) algorithm. The proposed model has been developed by applying four different classifiers, i.e., Logistic Regression (LR), Support Vector Machine (SVM), Decision Tree (DT), and Random Forest (RF). Moreover, this model is being evaluated by fourteen important parameters and compared with existing models. Comparative analysis and evaluation with pre-existing models have proved the proposed model's effectiveness and usefulness.
The organization of this paper is as follows: In section 2, related works of literature have been mentioned. Section 3 and 4 have dealt with the proposed method and experimental results, respectively. Conclusions are given in section 5, along with future research scopes.
In this section, we have discussed various causes of NTL, the economic effect of NTL, NTL proportion in different countries, and existed essential works of literature related to the detection of non-technical losses.
2.1 Causes of NTL
In NTL, there is an involvement of both types of the user either contractual or irregular. There are many reasons for the occurrence of NTL. It has been observed that many consumers try to bypass the meters with the wrong intention of fraud or deception. Due to any fault or damage in infrastructure, NTL also occurs. Yurtseven [9] and Lewis [10] shows that some consumers are so poor that they cannot pay the electricity bill. At the same time, some consumers can pay the electricity bill but are unwilling to do so. Therefore, another cause of the NTL is unpaid bills [2].
2.2 Economic effects of NTL
The economic effect of NTL reflects directly in the form of losses of income return for electric utilities, which leads to an increase in the additional charge for the regular customer. The indirect economic effect of NTL is the inspection cost because more NTL leads to more inspections in the consumer's premise. NTL also creates unreliability in the network. For maintaining the reliability of the system, the cost of maintenance can be used to settle the indirect effects. Linares and Rey [11] have explained that the extra cost of detection and prevention from NTL may be higher than the rate of return.
2.3 Variation of NTL
The proportion of the NTL in different countries is found different, which is shown in Table 1. The variation in the NTL depends upon the development status of that particular country.
Table 1. List of countries facing NTL and their proportions
|
Reference |
NTL Proportion |
Country |
|
[1] |
1.6%-37.9% |
Uttar Pradesh, India |
|
[9] |
4-73% |
Turkey |
|
[12] |
18% |
Rwanda |
|
[13] |
3-40% |
Brazil |
|
[14] |
Up to 70% |
India |
2.4 Literature related to the detection of NTL
Negi et al. [15] group of authors have used the fuzzy logic expert system and SVM, where the data set the size of ~100K customers. The purpose of including expert human knowledge is to identify fraudulent behavior. In this work, test recall of 0.72 has been achieved. In Ref. [7], the following five features are being used, i.e., maximum consumption, average consumption, standard deviation, the average consumption of the residential area, and the number of inspections. Also, in this work, the fuzzy c-means clustering algorithm is used for grouping the customers into classes based on the features. Further, the classification of the customer into NTL and non-NTL is done by using the Euclidean distance measure based on the fuzzy membership values. This test has achieved 0.745 precision.
The Support Vector Machines (SVM) are supervised learning models used to analyze data for classification and regression. Nagi et al. [16] have used this technique for the detection of NTL. The data set used in this work is from Kuala Lumpur, Malaysia, where the size of the data is ~260K customers. In this data set, consumer's 25 months' meter readings are recorded, and the average daily consumption per month (used as a feature) is calculated. These features are normalized and used for training with a Gaussian kernel. Further, computation of the creditworthiness ranking (CWR) is also used as a feature. Calculations for CWR, along with its range, have already been discussed in the previous section. This work has achieved a recall value of 0.53. Paper [6], also discuss the related setting and achieved the test recall of 0.77 and accuracy of 0.86 on the different data set. According to Ramos et al. [17], 5K Brazilian Industrial Customer data set is used where each consumer profile has ten features like maximum demand, demand billed, installed power, etc. The test accuracy of SVM, neural network, and K-nearest neighbors (KNN) are 0.9628, 0.9448, and 0.9620, respectively.
According to Glauner et al. [18], massive data set of Brazilian customers around 700K and ~31 million monthly reading are inspected from January 2011 to January 2015. They have also used ~400K inspection data. In this work, the expert system has been used to optimize the fuzzy system parameters using stochastic gradient descent as explained by Bottou [19] to that data set. The performance of this fuzzy system is better than the Boolean system. Daily average consumption features are used for ~100K customers and compare the three different algorithms on the different proportions of the fraud. The area under the curve (AUC) shows performance evaluation. The test AUC of 0.55, 0.465, and 0.55 on an NTLproportion of 5% for the optimized fuzzy system, Boolean system, and SVM. For an NTL proportion of 20%, test AUC are0.545, 0.475, and 0.55 for the optimized fuzzy system, Boolean system, and SVM.
Nagi et al. [20] presented the data sets detail 6K high-voltage and 80K low-voltage customers in Malaysia. The detection of electricity theft is based on 30 days meter reading data at an interval of 30 minutes. The test recall is 0.55, which has been achieved in this work. This work uses fuzzy logic along with human expert knowledge for detection. Some of the supervised learning models like CNN and LSTM are used to detect non-technical losses and theft detection in the electric distribution network. In Ref. [21], convolutional neural network (CNN) and long short-term memory (LSTM) was used for classification. The class imbalance problem is also tackled by using the SMOTE algorithm. The data set size for simulation is 10,000 customers and achieved a test accuracy of 89%. In this technique, several hidden layers are used, first four layers performed the convolutional operation with 20 features by each layer, and the remaining layers performed the LSTM operation.
Viegas et al. [22] have introduced a technique for detecting NTL by applying fuzzy-based clustering known as fuzzy Gustafson Kessel Clustering. In this technique, the authors try to identify the user's consumption behavior to determine the prototype used to score the NTL. The AUC score of this technique is 0.741.
This section explains the proposed methodology used for NTL detection in the electric distribution company. After that, we have outlined the necessity of separate performance evaluation metrics for NTL detection. Various procedures are involved in completing this proposed methodology. These procedures are described in the following sub-sections.
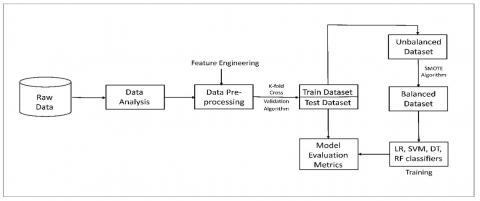
The flow of the proposed work is shown in Figure 1. The input of the model is consumer's consumption reading data, which is collected from the service provider. The collected data is analyzed based on consumer types and weather types. The data pre-processing is used for data cleaning, missing value imputation, and data transformation, which is done through feature engineering.
The collected data set has many useless features such as division code, SDO code, etc. These useless features are removing from the dataset. The k fold cross-validation algorithm is applied to the pre-processed dataset for training and testing. In the data set, the number of defaulters is significantly less to the number of normal consumers, which generates the data imbalance problem. The data imbalance problem may affect the performance of the proposed model. So, we have used SMOTE algorithm for data balancing.
In the proposed model, four machine learning classifiers are used. Different performance evaluation metrics are calculated according to testing results, which lay a strong base to identify various factors that select the most appropriate classifiers to detect NTL [23].
Figure 1. Flowchart of NTL detection
3.1 Data collection and analysis
NTL cannot be adequately detected without a real dataset. Therefore, a real dataset is collected from an electric distribution utility situated in Utter Pradesh, India. The collected data contains monthly consumption records of consumers from January 2019 to December 2019. It has monthly consumption records of 37814 consumers. This data is analyzed based on consumer types and weather types.
3.2 Data Pre-processing
The raw data collected from the distribution utility has 98 features. But it has been observed that few features are not helpful. For example, the feature division code, SDO code, and load unit are the same for all consumers. So, these features can be removed. Similarly, the feature 'serial number' and 'account id' are used for unique identification. Hence, one of them can only be used for identification. In this step, also replace the null value with a suitable feature value. The proposed approach has used 21 features.
We have found that many features in collected data have some erroneous values during data pre-processing, i.e., outliers. In this paper, feature engineering is used to restore the outliers according to the Eqns. (1) and (2):
$F(z)=\frac{x-\mu}{\sigma}$ (1)
where F(z), x, $\sigma$ and $\mu$ are the Z score, current feature value, standard deviation, and mean value, respectively. After calculating the Z score, both upper(Z) and lower(Z) is calculated as a threshold value that depends on the type of feature and standard deviation. Finally, the outliers are detected and also removed using Eq. (2).
$f(x)=\left\{\begin{aligned}
x, & \text { upper }(Z) \geq x \geq \operatorname{lower}(Z) \\
\operatorname{mean}(x), & \text { else }
\end{aligned}\right.$ (2)
In the collected raw data, many features have a wide range of values. So, before applying training and testing, these require the normalization process. The normalization of the feature value is done using Eq. (3), where Vx is the current feature value, min(Vx)and max(Vx) are minimum and maximum values in the present feature, respectively.
$F(V x)=\frac{V x-\min (V x)}{\max (V x)-\min (V x)}$ (3)
3.3 Feature selection
Collected raw data has information about 98 features, but all these features are not necessary. Therefore, in the very beginning, valuable features from the master data are chosen. Prediction error decides the importance of any particular feature i.e. if by changing the value of any feature, the prediction error is varying, then that feature is useful; otherwise, not. By following this procedure, we have shortlisted 21 valuable features.
Apart from these features, we have generated some more features based on meter data features such as creditworthiness (CWR). This feature range is 1 to 5, depending on the consumers' ignorance or delaying payments of the bill, healthy consumer flag, overload, meter read remark, and abnormal load consumption rate. This feature categorizes various consumers into normal and abnormal categories. In the proposed work, five different types of CWR are used, which are calculated as follows:
$\text { Overload }=M D I-\text { Load }$ (4)
The overload value is normalized between 1 to 5. The value of CWR1 is calculated based on this overload value, where a high overload value is considered as high CWR1 and low overload value as low CWR1. CWR2 is based on the healthy consumer flag (HCF) value. If the HCF value is yes, then CWR2 value is 1; else CWR2 is 5.
$C W R 2=\left\{\begin{array}{ll}
1, & H C F=y e s \\
5, & \text { else }
\end{array}\right.$ (5)
$C W R 3=\left\{\begin{array}{ll}
5, & M R R=C D F \\
1, & \text { else }
\end{array}\right.$ (6)
CWR3 is based on the meter read remark (MRR) status, where CWR3 will be 5 if the MRR status is Ceiling Defective (CDF) otherwise 1. CWR4 is based on the late payment surcharge (LPSC). The value of LPSC is normalized between 1 to 5 and considered as CWR4 value. CWR5 is based on the load consumption rate. These all five CWR are very useful for identifying the consumer's categories.
3.4 Generation of train and test datasets
The k fold cross-validation algorithm is used for creating the train and test dataset. Parameters of the proposed model are trained by train dataset, and assessment is done by test data set. The SMOTE algorithm is applied for data balancing.
3.5 Classification
We have used four classifiers for training and testing and their application for NTL detection. The normalized data is used to train and test these four classifiers, namely, logistic regression, random forest, decision tree, and SVM.
The proposed model is implemented using Python 3.6, and system configuration are Intel Core i3, CPU 3.4 GHz, and 4.0 GB RAM. The logistic regression, decision tree, SVM, and RF are programmed using sci-kit learn [23].
4.1 Performance metrics
NTL is detected as a discrete two-class classification task. Therefore, each consumer is divided into abnormal or normal categories. The output of classifier validation is called confusion matrices. Here, four confusion matrices true positive (TP), false negative (FN), false positive (FP), and true negative (TN) are used for NTL detection. These matrices are defined as the number of consumers that are classified correctly as normal, classified falsely as abnormal, classified falsely as normal, and classified correctly as abnormal, respectively. Another important evaluation metric is accuracy, which measures how accurately a classifier predicts the TP and TN values. Accuracy can be calculated using Eq. (7) which is as follows:
$\text { Accuracy }=\frac{\mathrm{TP}+\mathrm{TN}}{\mathrm{TP}+\mathrm{TN}+\mathrm{FP}+\mathrm{FN}}$ (7)
Some other essential evaluation metrics are used for performance measures of the proposed model, which are shown in Eqns. (8) to (12).
$\text { True positive rate }(T P R)=\frac{\mathrm{TP}}{\mathrm{TP}+\mathrm{FN}}$ (8)
$\text { True negative rate }(T N R)=\frac{\mathrm{TN}}{\mathrm{TN}+\mathrm{FP}}$ (9)
$\text { False positive rate }(F P R)=\frac{\text { FP }}{\text { TN + FP }}$ (10)
$\text { False negative rate }(F N R)=\frac{\mathrm{FN}}{\mathrm{TP}+\mathrm{FN}}$ (11)
$\text { Positive predictive value }(P P V)=\frac{\mathrm{TP}}{\mathrm{TP}+\mathrm{FP}}$ (12)
Recall or true positive rate (TPR) measures the total number of electricity theft consumers correctly classified by the classifier. If the value of TPR is higher, the detection of NTL becomes easier.
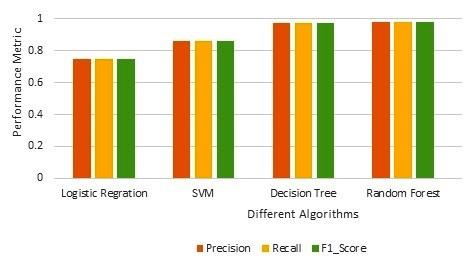
Tested values of the precision, recall, and F1 score are shown in Tables 2 to 5 for the LR, SVM, DT, and RF classifiers. Table 6 shows the comparative analysis among these classifiers based on precision, recall, and F1 score. We have also demonstrated its effectiveness by comparison in Figure 2. The precision, recall, and F1 score of the decision tree are 0.97, 0.97, and 0.97. The recall, precision, and F1 score of random forest are 0.98, 0.98, and 0.98, respectively, which are better than other existed works. This comparison is shown in Table 8. In Tables 2 to 5, we can see that both the classes (normal and defaulter consumers) have the approximately same value for precision, recall, and F1 score, which means that the proposed model solves the data-unbalancing problem.
Table 2. Classification score of Logistic Regression
|
|
Parameters |
||
|
Precision |
Recall |
F1 Score |
|
|
Normal consumer |
0.75 |
0.76 |
0.75 |
|
Defaulter consumer |
0.75 |
0.73 |
0.74 |
|
Average/total |
0.75 |
0.75 |
0.75 |
Table 3. Classification score of SVM
|
|
Parameters |
||
|
Precision |
Recall |
F1 Score |
|
|
Normal consumer |
0.90 |
0.80 |
0.85 |
|
Defaulter consumer |
0.82 |
0.91 |
0.86 |
|
Average/total |
0.86 |
0.86 |
0.86 |
Table 4. Classification score of Decision Tree
|
|
Parameters |
||
|
Precision |
Recall |
F1 Score |
|
|
Normal consumer |
0.97 |
0.97 |
0.97 |
|
Defaulter consumer |
0.97 |
0.97 |
0.97 |
|
Average/total |
0.97 |
0.97 |
0.97 |
Table 5. Classification score of Random Forest
|
|
Parameters |
||
|
Precision |
Recall |
F1 Score |
|
|
Normal consumer |
0.97 |
0.98 |
0.98 |
|
Defaulter consumer |
0.98 |
0.97 |
0.98 |
|
Average/total |
0.98 |
0.98 |
0.98 |
Table 6. Classification score of LR, SVM, DT, and RF
|
Classifiers |
Parameters |
||
|
Precision |
Recall |
F1 score |
|
|
Logistic Regression |
0.75 |
0.75 |
0.75 |
|
SVM |
0.86 |
0.86 |
0.86 |
|
Decision Tree |
0.97 |
0.97 |
0.97 |
|
Random Forest |
0.98 |
0.98 |
0.98 |
The harmonic mean is also used, which is calculated as follows:
$\text { Harmonic mean }=\frac{2 * \text { Precision } * \text { Recall }}{\text { Precision }+\text { Recall }}$ (13)
A high value of the harmonic mean shows the high value of precision and recall. The harmonic mean of this proposed model is 97% and 98% for Decision Tree and Random Forest, respectively. Arithmetic mean and Dominance parameters are also used, which are calculated as:
$\text { Arithmetic mean }=\frac{\text { Precision }+\text { Recall }}{2}$ (14)
$\text { Dominance }=T P R-T N R$ (15)
The range of this parameter is +1 to -1. The value of dominance is close to +1, showing the classifier's good accuracy for the positive class. And dominance value near to −1, depicting good accuracy of the classifier for the negative class. This proposed model's arithmetic mean and dominance is 98% and 0.006, respectively, shown in Table 7.
Figure 2. Comparison among different classifiers based on Precision, Recall, and F1 score
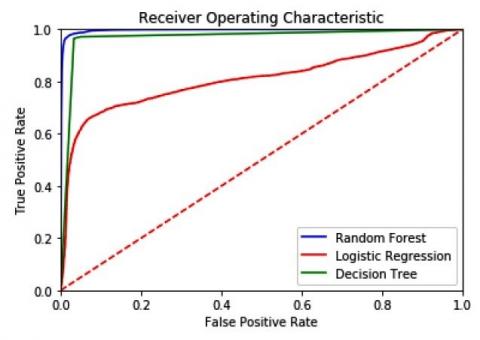
The area under curve (AUC) and receiver operating characteristic (ROC) curve are also used for the detection of NTL. The ROC curve of this proposed model is shown in Figure 5. Mathew's correlation coefficient (MCC) is a vital evaluation parameter [24], which is defined in Eq. (16). MCC can also be used for the evaluation parameter to detect non-technical losses based on machine learning. The proposed model has 0.94 and 0.96 MCC scores for Decision Tree and Random Forest, respectively.
$M=\frac{(\mathrm{TN} * \mathrm{TP})-(\mathrm{FN} * \mathrm{FP})}{\sqrt{(F P+T P)(T P+F N)(T N+F N)(T N+F P)}}$ (16)
Table 7. Complex metrics for LR, SVM, DT and RF
|
Parameters |
LR |
SVM |
DT |
RF |
|
Accuracy % |
75% |
85.4% |
97% |
98% |
|
Arithmetic mean |
0.75 |
0.85 |
0.97 |
0.98 |
|
Harmonic mean |
0.75 |
0.85 |
0.97 |
0.98 |
|
TPR |
0.75 |
0.86 |
0.97 |
0.98 |
|
FPR |
0.265 |
0.093 |
0.030 |
0.025 |
|
TNR |
0.734 |
0.906 |
0.969 |
0.974 |
|
FNR |
0.234 |
0.198 |
0.033 |
0.017 |
|
Dominance |
0.016 |
-0.046 |
0.001 |
0.006 |
|
MCC |
0.46 |
0.72 |
0.94 |
0.96 |
|
AUC score |
0.749 |
0.854 |
0.97 |
0.98 |
Figure 3. Dominance of LR, SVM, DT, and RF
Figure 4. Comparison among LR, SVM, DT, and RF based on TPR, TNR, and Harmonic Mean
Figure 5. ROC curves for LR, DT, and RF
Table 7 shows the comparative analysis of LR, SVM, DT, and random forest based on different metrics such as accuracy; arithmetic mean, harmonic mean, TPR, FPR, TNR, FNR, dominance, and AUC score. Figure 3 shows the comparative analysis of classifiers based on dominance metrics. Figure 4 shows a comparative analysis of the classifiers based on TPR, TNR, and harmonic mean. ROC curves of these three different classifiers (LR, SVM, RF) are shown in Figure 5. Figure 5 clearly shows that the performance of Random Forest is better than others. The proposed model's performance has been compared with existed works which are shown in Table 8. From Table 8, it is clear that the proposed model performs better than other existed works in terms of accuracy, recall, precision, and AUC score.
Table 8. Comparison between the proposed scheme and existed works
|
Reference |
Model |
Accuracy |
Recall |
Precision |
AUC |
|
[6] |
SVM(Gauss) |
0.86 |
0.77 |
- |
- |
|
[15] |
SVM+ Fuzzy |
- |
0.72 |
- |
- |
|
SVM-FIS |
0.72 |
- |
- |
- |
|
|
[7] |
Fuzzy Classification |
0.745 |
- |
- |
- |
|
[16] |
SVM |
0.60 |
0.53 |
- |
- |
|
[20] |
Fuzzy Logic |
0.55 |
- |
- |
- |
|
[21] |
CNN, LSTM |
0.89 |
0.87 |
0.90 |
- |
|
[22] |
Fuzzy Clustering |
- |
- |
- |
0.741 |
|
[25] |
Wide and Deep CNN |
0.9404 |
- |
- |
- |
|
[26] |
DT coupled SVM |
0.925 |
- |
- |
- |
|
[27] |
(SVM, OPF, C4, 5 tree) |
0.862 |
0.64 |
0.544 |
- |
|
[28] |
CNN, LSTM |
0.966 |
- |
- |
- |
|
Proposed Scheme |
Logistic Regression |
0.75 |
0.75 |
0.75 |
0.749 |
|
SVM |
0.854 |
0.86 |
0.86 |
0.854 |
|
|
Decision Tree |
0.97 |
0.97 |
0.97 |
0.968 |
|
|
Random Forest |
0.98 |
0.98 |
0.98 |
0.98 |
Evidently, in the electricity distribution system, non-technical losses (NTLs) are significant losses. This paper has proposed a model for detecting NTL based on feature engineering and machine learning. In this, used a realistic dataset of a distribution company in India. The proposed work considers the various challenging issues, including class imbalance, data quality, comparison of different methods, feature description, and selection. The comparative analysis of the proposed model has found that the proposed scheme has better accuracy, precision, recall, F1 score, and AUC score than other existed works. This work will drastically give a massive benefit to the service provider to detect NTL. It will improve their abilities for NTL detection and the enormous savings of revenue losses which is also a serious concern.
We found that collecting a realistic dataset of a distribution company is a challenging task during this research. So, there is a need for publicly available a real dataset, which can be helping in this area of study.
[1] Golden, M.A., Min, B. (2012). Theft and loss of electricity in an Indian State. 3rd version. International Growth Centre.
[2] Smith, T.B. (2004). Electricity theft: A comparative analysis. Energy Policy, 32(18): 2067-2076. https://doi.org/10.1016/S0301-4215(03)00182-4
[3] Antmann, P. (2009). Reducing technical and non-technical losses in the power sector. World Bank, Washington, DC. http://hdl.handle.net/10986/20786.
[4] Dasgupta, K., Padmanaban, M., Hazra, J. (2017). Power theft localisation using voltage measurements from distribution feeder nodes. IET Generation, Transmission & Distribution, 11(11): 2831-2839. https://doi.org/10.1049/iet-gtd.2016.2011
[5] Nizar, A.H., Dong, Z.Y., Wang, Y. (2008). Power utility nontechnical loss analysis with extreme learning machine method. IEEE Transactions on Power Systems, 23(3): 946-955. https://doi.org/10.1109/TPWRS.2008.926431
[6] Nagi, J., Yap, K.S., Tiong, S.K., Ahmed, S.K., Mohamad, M. (2009). Nontechnical loss detection for metered customers in power utility using support vector machines. IEEE Transactions on Power Delivery, 25(2): 1162-1171. https://doi.org/10.1109/TPWRD.2009.2030890
[7] Angelos, E.W.S., Saavedra, O.R., Cortés, O.A.C., de Souza, A.N. (2011). Detection and identification of abnormalities in customer consumptions in power distribution systems. IEEE Transactions on Power Delivery, 26(4): 2436-2442. https://doi.org/10.1109/TPWRD.2011.2161621
[8] Costa, K.A., Pereira, L.A., Nakamura, R.Y., Pereira, C. R., Papa, J.P., Falcão, A.X. (2015). A nature-inspired approach to speed up optimum-path forest clustering and its application to intrusion detection in computer networks. Information Sciences, 294: 95-108. https://doi.org/10.1016/j.ins.2014.09.025
[9] Yurtseven, Ç. (2015). The causes of electricity theft: An econometric analysis of the case of Turkey. Utilities Policy, 37: 70-78. https://doi.org/10.1016/j.jup.2015.06.008
[10] Lewis, F.B. (2015). Costly ‘throw-ups’: Electricity theft and power disruptions. The Electricity Journal, 28(7): 118-135. https://doi.org/10.1016/j.tej.2015.07.009
[11] Linares, P., Rey, L. (2013). The costs of electricity interruptions in Spain. Are we sending the right signals? Energy Policy, 61: 751-760. https://doi.org/10.1016/j.enpol.2013.05.083
[12] Mwaura, F.M. (2012). Adopting electricity prepayment billing system to reduce non-technical energy losses in Uganda: Lesson from Rwanda. Utilities Policy, 23: 72-79. https://doi.org/10.1016/j.jup.2012.05.004
[13] Ramos, C.C., Rodrigues, D., de Souza, A.N., Papa, J.P. (2016). On the study of commercial losses in Brazil: A binary black hole algorithm for theft characterization. IEEE Transactions on Smart Grid, 9(2): 676-683. https://doi.org/10.1109/TSG.2016.2560801
[14] Katiyar, S.K. (2005). Political economy of electricity theft in rural areas: A case study from Rajasthan. Economic and Political Weekly, pp. 644-648. https://www.jstor.org/stable/4416202.
[15] Nagi, J., Yap, K.S., Tiong, S.K., Ahmed, S.K., Nagi, F. (2011). Improving SVM-based nontechnical loss detection in power utility using the fuzzy inference system. IEEE Transactions on Power Delivery, 26(2): 1284-1285. https://doi.org/10.1109/TPWRD.2010.2055670
[16] Nagi, J., Mohammad, A.M., Yap, K.S., Tiong, S.K., Ahmed, S.K. (2008). Non-technical loss analysis for detection of electricity theft using support vector machines. In 2008 IEEE 2nd International Power and Energy Conference, pp. 907-912. https://doi.org/10.1109/PECON.2008.4762604
[17] Ramos, C.C.O., De Souza, A.N., Gastaldello, D.S., Papa, J.P. (2012). Identification and feature selection of non-technical losses for industrial consumers using the software weka. In 2012 10th IEEE/IAS International Conference on Industry Applications, pp. 1-6. https://doi.org/10.1109/INDUSCON.2012.6451485
[18] Glauner, P., Boechat, A., Dolberg, L., State, R., Bettinger, F., Rangoni, Y., Duarte, D. (2016). Large-scale detection of non-technical losses in imbalanced data sets. In 2016 IEEE Power & Energy Society Innovative Smart Grid Technologies Conference (ISGT), pp. 1-5. https://doi.org/10.1109/ISGT.2016.7781159
[19] Bottou, L. (2003). Stochastic learning. In Summer School on Machine Learning, pp. 146-168. https://doi.org/10.1007/978-3-540-28650-9_7
[20] Nagi, J., Yap, K.S., Nagi, F., Tiong, S.K., Koh, S.P., Ahmed, S.K. (2010). NTL detection of electricity theft and abnormalities for large power consumers in TNB Malaysia. In 2010 IEEE Student Conference on Research and Development (SCOReD), pp. 202-206. https://doi.org/10.1109/SCORED.2010.5704002
[21] Hasan, M., Toma, R.N., Nahid, A.A., Islam, M.M., Kim, J.M. (2019). Electricity theft detection in smart grid systems: A CNN-LSTM based approach. Energies, 12(17): 3310. https://doi.org/10.3390/en12173310
[22] Viegas, J.L., Esteves, P.R., Vieira, S.M. (2018). Clustering-based novelty detection for identification of non-technical losses. International Journal of Electrical Power & Energy Systems, 101: 301-310. https://doi.org/10.1016/j.ijepes.2018.03.031
[23] Pedregosa, F., Varoquaux, G., Gramfort, A., Michel, V., Thirion, B., Grisel, O. (2011). Scikit-learn: Machine learning in Python. The Journal of Machine Learning research, 12(4): 2825-2830.
[24] Matthews, B.W. (1975). Comparison of the predicted and observed secondary structure of T4 phage lysozyme. Biochimica et Biophysica Acta (BBA)-Protein Structure, 405(2): 442-451. https://doi.org/10.1016/0005-2795(75)90109-9
[25] Zheng, Z., Yang, Y., Niu, X., Dai, H.N., Zhou, Y. (2017). Wide and deep convolutional neural networks for electricity-theft detection to secure smart grids. IEEE Transactions on Industrial Informatics, 14(4): 1606-1615. https://doi.org/10.1109/TII.2017.2785963
[26] Jindal, A., Dua, A., Kaur, K., Singh, M., Kumar, N., Mishra, S. (2016). Decision tree and SVM-based data analytics for theft detection in smart grid. IEEE Transactions on Industrial Informatics, 12(3): 1005-1016. https://doi.org/10.1109/TII.2016.2543145
[27] Di Martino, M., Decia, F., Molinelli, J., Fernández, A. (2012). Improving Electric Fraud Detection using Class Imbalance Strategies. In ICPRAM, pp. 135-141.
[28] Bhat, R.R., Trevizan, R.D., Sengupta, R., Li, X., Bretas, A. (2016). Identifying nontechnical power loss via spatial and temporal deep learning. In 2016 15th IEEE International Conference on Machine Learning and Applications (ICMLA), pp. 272-279. https://doi.org/10.1109/ICMLA.2016.0052