Hendi Herlambang* | Humiras Hardi Purba | Choesnul Jaqin
© 2021 IIETA. This article is published by IIETA and is licensed under the CC BY 4.0 license (http://creativecommons.org/licenses/by/4.0/).
OPEN ACCESS
Human involvement in the assembly part manufacturing process is still relatively high. However, automation solutions are not flexible enough to be applied to manufacturing systems. It is essential to evaluate each work activity so that automation can be implemented effectively. We developed an automatic vision inspection using machine vision. The level of automation (LoA) in the company increases, and the impact caused by process failures on manual systems can be eliminated during inspection activities. The automation level increase in the inspection area is described and analyzed using the Hierarchy Task Analysis (HTA). Inspection data process activity and quality data are collected to determine the CCD camera selection, lamp selection, and lens selection. Three quality objectives, such as geometric quality, surface quality, and structural quality, are identified automatically using machine vision. Furthermore, after applying machine vision, an analysis of current LoA conditions and future LoA conditions is carried out. The results showed that the application of machine vision could increase the Level of Automation in the product inspection activity by 81.8%. There is a strong correlation (R = 0.924) between manual measurements carried out by operators and machine vision.
machine vision, image processing, automation, level of automation, hierarchy task analysis, human error identification, gage study, Indonesia
Automation is one of the essential things in the manufacturing process, involving the latest technology and social. Automation is supported by machines or other functions carried out by machines or robots previously performed by humans [1]. Chinniah and Bourbonniere [2] stated automation can increase productivity, quality, and production costs, but it can also relieve repetitive and dangerous tasks. Currently, the competition is getting more stringent in developed countries in the high technology sector. In contrast, countries with low wages and conventional manufacturing techniques continue to mature by increasing their technology capabilities [3].
Meanwhile, in Indonesia, Das et al. [4] also reported that automation could increase productivity and gross domestic product (GDP). Besides, automation can also increase income for workers and provide business opportunities for entrepreneurs. The positive impact on the economy is that it can help accelerate growth and create jobs for 25 million new workforces, producing a positive figure in employment (net gain) in Indonesia. Therefore, automation is an efficient way to increase productivity, save production costs, and create positive job creation values.
There are several options for classifying automation. Parasuraman et al. [1] suggested the degree of automation applied to information acquisition, information analysis, decision and action selection, and action implementation. Each function level has a different degree of automation, from a purely manual level to a fully automated level. In line with Frohm et al. [5] suggested the classification of automation levels in the context of the allocation of physical and cognitive tasks between humans and technology can be divided into seven levels, from purely manual to fully automated. Fasth et al. [6] stated hierarchy task analysis is used to understand the background of the tasks and sub-tasks carried out in a structured order, then compared with the matrix structure of cognitive and physical automation levels. Therefore, the utilization of humans and machines’ potential in the industry must be well understood so that the balance of tasks carried out between humans and machines can be achieved.
Automation using Machine Vision is an alternative to control quality with accurate results, without contact, can perform complex inspections, and low cost [7, 8]. Examination using the eye is less accurate, subjective, eye fatigue, and expensive, so that when applying it with high speed and real-time is not possible [9]. Machine Vision as a quality control system is growing rapidly and has been applied to reduce errors and improve quality [10, 11]. Reynolds et al. [12] documented their research that machine vision can detect defects early in the assembly process before the aerospace electronics industry’s core processes. Therefore, automatic inspection of complex systems using machine vision can improve quality and reduce errors at high speed and real-time.
Based on previous research, Zancul et al. [13] found that automation can improve quality and productivity by implementing machine vision by conducting experiments on a learning factory. Therefore, the author is interested in researching the automation (LoA) level in the inspection area in the assembly section of an electronic component company in Indonesia by using machine vision to increase automation levels. Furthermore, this study’s results can explain the current level of automation and the level of automation in the future after the application of machine vision.
1.1 LoA (Level of Automation)
Parasuraman et al. [1] stated that automation is a function of humans’ work as partially or fully replaced operators. Automation varies in level from pure manual to full automation at the highest level. Furthermore, Frohm et al. [5], in line with William and Li [14], stated that the level of automation in the manufacturing industry is divided into two, the level of mechanization (physical tasks) and information systems (cognitive tasks).
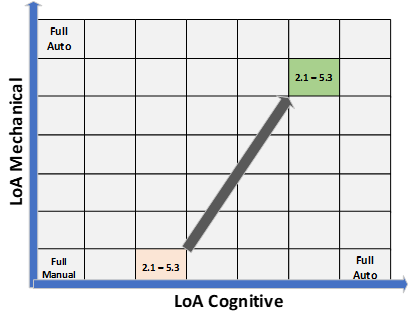
Figure 1. Physical and cognitive LoA matrix [15]
Human physical tasks involved in fulfilling missions, such as human muscle power or tasks related to matter and energy, are represented as mechanization tasks. Information control tasks, such as mental activities related to human sensory thinking processes, are represented by computerized tasks [14]. The implementation of the automation level differs from the operators’ physical and cognitive abilities [16]. The use of Level of Automation is extensive and has been adapted and cited [17].
Figure 2. HTA identification of subtasks production [18]
The level of automation can be explained in two matrix scales of the LoA Cognitive on the X-axis, and the Mechanical LoA is drawn on the Y-axis so that a 7 X 7 scale matrix is formed, which indicates that there are 49 types of opportunities for assignment allocation [19], as shown in Figure 1. To determine the Level of Automation (LoA) is reviewed for the effectiveness of work and activities that involve equipment or tools and technology in order to obtain the desired productivity by using Hierarchy Task Analysis (HTA) [20, 21]. Concerning the Level of Automation (LoA), task analysis is described in detail down to the subtask by knowing how (Cognitive / Information and Control) information processing is carried out and with what (Equipment / Mechanical and Physical) the work is carried out [6]. As seen in Figure 2, the main activity is broken down into several activities according to the order of the work being carried out. Activity one to activity three or n is the decomposition of the main activity. The level of automation in each activity can be determined by decomposition until known how the activity was carried out (LoA Cognitive / Information and Control). Furthermore, the authors can identify the level of automation in the physics group by knowing what the job is being done (LoA Physic / Mechanical and Equipment). So that by decomposing each activity using HTA will make it easier to understand the purpose of the activity.
1.2 Machine vision
Manufacturing industries always want to improve their products’ quality by building machines that can see and interpret the conditions. These machines do not all imitate humans’ vision systems but rather the desirability of industry requirements such as high reliability and low-cost factors. They can be used at high speed, and this concept is called machine vision [22]. Machine vision has been widely applied in manufacturing and its applications, such as robots and services [23], ergonomic movements in linking processes [24].
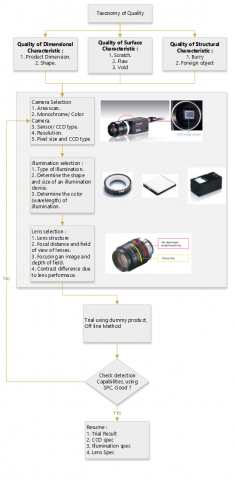
Golnabi and Asadpour [25] stated that machine vision applications are divided into four main categories: automated visual inspection, process control, parts identification, robotic guidance, and control. The most widely used is the automated visual inspection (AVI). Several researchers documented their research that the AVI system was repeatable, and it could also be applied at a very high speed to evaluate the detected object [26, 27]. The steps for applying Machine vision are divided into three stages, selecting a camera, selecting a lens, and selecting lighting [28].
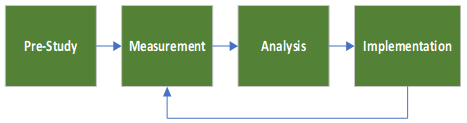
For this research to be carried out well, the four steps of the DYNAMO ++ method, namely pre-study, measurement, analysis, and implementation, are used in this study, as shown in Figure 3.
Figure 3. The dynamo ++ methodology [29]
2.1 Pre-study
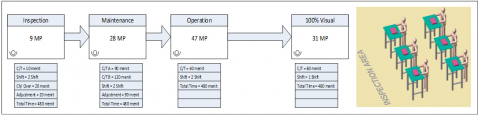
The authors’ initial step is to identify problems in the production process [30] described by value stream mapping (VSM) [31], as shown in Figure 4. Before the product is sent to the other section, a manual inspection is carried out using magnifying. Figure 4 shows that the bottleneck occurs in the 100% inspection area with 31 workers; of course, work in process is also adjusted according to production needs.
2.2 Measurement
From the results of the initial inspection, it can be seen that the 100% visual inspection area is a bottleneck in the production section. Hierarchy Task Analysis (HTA) is used to decompose physical and cognitive activities on 100% visual inspection activities. Next, do a mapping of the Level of Automation (LoA) of each workgroup. LOA assessment on each job is grouped into two groups and separated by asking “how to do the task?” Moreover, “how the role of humans and machines in completing the task?” [5].
Fasth [32] stated that to know the automation’s description to be aimed, an evaluation was carried out by asking “when?” and “how?”, So that the factors related to the person, the production system, and the place where the change would be made could be identified. So that in this research, production operators, technicians, to production managers are involved. According to Frohm et al. [5], it will be more effective when assessing LoA involving employees and those directly involved in observing their work in the assembly line production area.
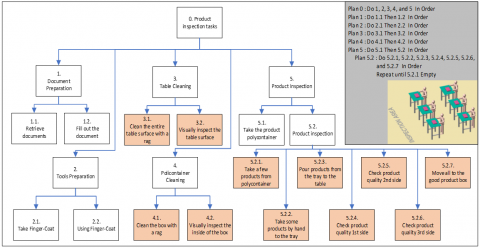
HTA / Human Error Identification (HEI) is a technique for examining potential errors at every work level [33]. As seen in Figure 5, the activity during the inspection process has been decomposed from the main task to the subtask. This is followed by identifying the errors in every activity caused by errors originating in people and information systems.
Task 3.1: Clean the entire table surface with a rag. Cleaning the table is done using a clean cloth so that the table to be used is clean from dust, dirt, and foreign objects. The following errors were identified in this activity:
1. The table area will be difficult to reach at the very end position if the operator does it with limited hand reach, so it will cause pain in the arm if this activity is repeated and done
frequently. To avoid pain in the arm, the operator moves to the table’s left and right sides.
2. The yarn from the fabric is loose and is not visible to the operator’s eye, so that the potential for the thread will enter the product, which will reduce the quality of the product. A special and strong cloth is provided for cleaning the table.
3. Of course, the operator will be conscientious when cleaning the table because there are many variations of the product being checked, so there is no product mix.
Task 3.2: Visually inspect the table surface. After the cleaning process is carried out, the table’s entire surface is carried out using the visual eye to ensure that the table is clean from dust, dirt, and foreign objects. The potential errors that can occur when this activity is carried out are the same as activity 3.1.
Task 4.1: Clean the box with a rag. Empty boxes are prepared to accommodate products that have been selected, previously cleaned using a clean rag. The potential errors that occur are the same, as shown in task 3.1.
Task 4.2: Visually inspect the inside of the box. When the product box is cleaned, a detailed inspection is carried out on the inside of the box in sequence to ensure that no dirt and foreign matter dust is left in the box. The potential for errors that occur is the same as for activity 3.1.
Task 5.2.1: Take a few products from a poly container. Some of the product is taken from the top of the stack inside the poly container by hand, little by little. Product sizes vary from small, medium to large, with the risks that occur if the training process is not carried out properly, namely:
Task 5.2.4: Check product quality, first side. Activities 5.2.4, 5.2.5, and 5.2.6 are the core activities of product inspection.
The first phase of the product is taken with the left hand and then held together with the right hand. The fingers of the left and right hands are positioned to easily visible the product’s surface.
The second phase of the inspected product area (Field of View) must be visible by adjusting the object’s distance being examined against the magnifying and the eye. Lighting standards have been set, as this is the most crucial factor in the product inspection process.
The third phase begins to examine areas that have been defined by the inspection standards, such as flaws, scratch, scratches, dirty, black spots, crack, and pin-holes.
After completing the inspection process in the fourth phase, the right-hand moves the products that have been inspected to the specified area.
After completing the fourth phase, the repetition will continue starting from the first phase until the product being examined has run out. Evaluation of this core activity is captured using video and jointly conducting checks at the scene. The following errors have been identified:
From the explanation of inspection activities with HTA, trained operators must be carried out with excellent abilities. The physical condition of the operator and the environment also needs attention. Mapping using HTA helps transform the current state of the automation (LoA) level in the 100% inspection area, as shown in Figure 6. Currently, operators do not use tools when conducting product inspections. Then, to decide the product is feasible, the operator must refer to the work standards that have been determined.
Figure 6. LoA current condition
2.3 Analysis
The current LoA condition has been described in the measurement stage, finding that the 100% manual inspection activity can be controlled properly. However, with the large variety of products produced, the possibility of disrupting product quality is still there. Discussions through exploratory interviews with parties related to machine vision development are suitable choices in current conditions.
2.4 Machine vision design
Nowadays, image processing (IP) can be done by company technicians quickly and easily, so that for the industry, it will be exciting to speed up the automation process using machine vision [34]. We developed machine vision within the company, and it took eight months. Automation using machine vision is chosen by considering the risk factors that have been identified using HTA / HEI. Besides that, the factors of cost, time, employee capabilities, and the company’s appropriate automation needs are also considered. The steps for developing machine vision are depicted in the form of a flowchart, as shown in Figure 7.
Figure 7. Flow process experimental using machine vision
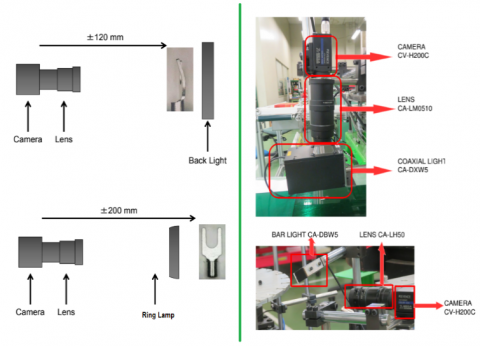
In our case studies, imaging systems are installed at the front and bottom of products with limited space. The allowed distance between the camera and the product terminal ranges from 100 mm to 200 mm, as seen in Figure 9. The experiment was conducted offline, by taking the image several times to get the most optimal results, which in the final stage was evaluated the reliability of the machine vision process by using Gage Study.
The experiment has been completed, and the stability of the static data has been successfully documented. Data experiments are used as a reference when performing the first set of machine vision at the time of machine vision implementation. However, dynamic data retrieval must still be done to know the reliability of product detection using machine vision. The user’s needs determine the selection of machine vision needs by paying attention to the type of product quality, the size of the detected area, and image processing speed. As seen in Table 1 is the minimum requirement of machine vision applications.
Table 1. Minimum requirement machine vision
|
No |
Part |
Type |
Physical |
|
1 |
Digital vision controller |
CV-X150F |
|
|
2 |
Digital Vision Led Controller |
CA-DC21E |
|
|
3 |
Digital Vision Sensor |
CV-H200C |
|
|
4 |
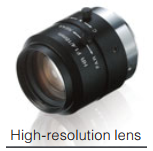
Field Lens |
CA-LHR35 |
|
|
5 |
Coaxial Led |
CA-DXW5 |
|
|
6 |
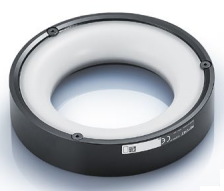
Ring Led Light |
CADRW8M |
|
|
7 |
Back Light |
CA-DSW2 |
|
|
8 |
Optional (LCD Color Monitor) |
CA-MP120 |
2.5 Implementation of machine vision
During the camera detection process, the product continues to move automatically using the feeder. Machine vision is equipped with an automatic exhaust system that will work when machine vision detects product defects caught by the camera. The operator must adequately translate five to ten types of product defects at the product’s manual inspection. Thus, the need for machine vision support equipment in this study requires two cameras and four lighting combinations to detect the upper and rear products’ surface. Not only the quality factor is the point of concern, but the speed of image processing must also be taken into account. The total image processing time is greater than the operator’s speed when performing manual inspections. So, the selection of CCD cameras, lenses, lights, and controllers must be tailored to the company’s needs, as seen in Figure 8 is Image processing flow.
Image processing begins with the arrival of the product object. The photo-sensor functions to trigger the camera to take an image. Reference image has been stored as a basis for decision making. The next step compares the reference image to the current image with the detection function, namely, profile and pattern. The process will not continue when there is a difference in profile or pattern, and the system considers that there is a model failure, or there is no product similarity. When the model follows the reference image, the machine vision will check the dimensional quality, structure quality, and geometric quality sequentially. The system will save the product inspection history used as trace abilities, as seen in Figure 8.
The machine vision application has successfully detected product defects, internal company findings, and customer findings. From material supply to detection, the machine vision production process is carried out automatically and is equipped with automatic sorting using a pneumatic system so that defective products detected by the camera can be automatically discarded, as seen in Figure 10.
Figure 10. Machine vision for electronics component
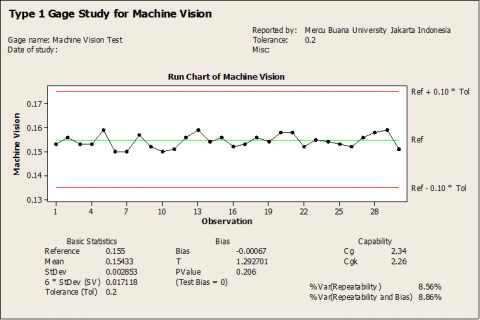
Figure 11. Gage study machine vision
Table 2. LoA identification
|
Task no |
Current (LoA) |
Future (LoA) |
LoA Matrix |
||
|
Mech |
Cogn |
Mech |
Cogn |
||
|
1.1. |
6 |
6 |
6 |
6 |
|
|
1.2. |
6 |
6 |
6 |
6 |
|
|
2.1. |
1 |
3 |
6 |
6 |
|
|
2.2. |
1 |
3 |
|||
|
3.1. |
1 |
3 |
|||
|
3.2. |
1 |
3 |
|||
|
4.1. |
1 |
3 |
|||
|
4.2. |
1 |
3 |
|||
|
5.1. |
1 |
3 |
|||
|
5.2. |
1 |
3 |
|||
|
5.3. |
1 |
3 |
|||
To ensure reliable inspection, the machine vision authors test the process’s capability to detect dimensional or geometric qualities using a statistical approach. Authors compare the results of measurements from machine vision and the results of the operator’s measurements using a measuring projector measuring instrument. Dynamic tests are performed to measure the machine vision process capability, with constant speed resulting from the material feeder. From the measurement data between machine vision and that performed by the operator, it is found that a strong correlation value is 0.924 with a p-value <0.05. While testing the repetition of machine vision, the values of Cg 2.34 and Cgk 2.26 are obtained, so it can be said that the machine vision process capability is excellent, as shown in Figure 11.
Then, after applying machine vision to activities 2.1 to 5.3, it increases from LoA cognitive three and LoA mechanical one to LoA cognitive six and LoA mechanical six. It can be said that some activities can be removed and replaced with machine vision. The level of automation can be increased by nine out of eleven activities or 81.8%, as shown in Table 2.
The application of machine vision was successfully implemented in the examination area of the assembly department. The machine vision process capability is excellent and reliable. The machine carries out the pure inspection process with better speed and repetitive work with a minimal failure rate. To get a clear and focused image, the selection of lights must be a point of concern. The amount of quality object detected is a consideration in selecting CCD cameras and lenses to fit the company and customers’ needs. Machine vision is designed robust against the interference of external factors (hardware). Machine vision focuses on one type of product type. Each product type change must be done by learning about the product detected by entering the system’s reference value. Machine vision is designed according to the needs of consumers and companies today. By decomposition of each activity, using the HTA is seen for the assessment using the LoA to be more objective. Not only is the Level of Automation increasing, but production output is increasing, quality is getting better, the amount of manpower is reduced, and operational production costs are down. In the examination activities in the assembly department, there is still an opportunity for improvement to the Level of LoA. This research is limited to several series products, so when it has to change with another series, it must be done the process of change over on machine vision to adjust to the product with other series, by setting bowl feeder or by replacing bowl feeder. The next study can be deepened back to the process of change over on machine vision.
[1] Parasuramen, R.S.T.B., Wickens, C.D. (2000). A model for types and levels of human interaction with automation. IEEE Transactions on Systems, Man, and Cybernetics–Part A: Systems and Humans, 30(3): 286-297. https://doi.org/10.1109/3468.844354
[2] Chinniah, Y., Bourbonniere, R. (2006). Occupational HazardsOccupational hazards automation safety assessing the risks and understanding safeguards. Prof. Saf., 51(12): 26.
[3] Flegel, H. (2006). Assuring the future of manufacturing in Europe. Manufuture Platform, 2006. [Online]. Available: http://www.manufuture.org/wp-content/uploads/Manufuture-SRA-web-version.pdf, accessed on 22-Nov-2020.
[4] Das, K., Wibowo, P., Chui, M., Agarwal, V., Lath, V. (2019). Automation and the Future of Work in Indonesia, Jobs Lost, Jobs Gained, Jobs Changed.
[5] Frohm, J., Lindström, V., Winroth, M., Stahre, J. (2008). Levels of automation in manufacturing. Ergonomia - International Journal of Ergonomics and Human Factors, 30(3): 181-207.
[6] Fasth, Å., Stahre, J., Dencker, K., Karwowski, W., Salvendy, G. (2010). Level of automation analysis in manufacturing systems. Advances in Human Factors, Ergonomics, and Safety in Manufacturing and Service Industries, 233-242. https://doi.org/10.1201/ebk1439834992-25
[7] Würschinger, H., Mühlbauer, M., Winter, M., Engelbrecht, M., Hanenkamp, N. (2020). Implementation and potentials of a machine vision system in a series production using deep learning and low-cost hardware. Procedia CIRP, 90: 611-616. https://doi.org/10.1016/j.procir.2020.01.121
[8] Zhao, R., Drouot, A., Griffin, J., Crossley, R., Ratchev, S. (2018). A low-cost automated fastener painting method based on machine vision. In International Precision Assembly Seminar, pp. 92-100. https://doi.org/10.1007/978-3-030-05931-6_9
[9] Kumar, D.P., Kannan, K. (2010). A roadmap for designing an automated visual inspection system. International Journal of Computer Applications, 1(19): 34-37. https://doi.org/10.5120/407-603
[10] Garcia, H.C., Villalobos, J.R., Runger, G.C. (2006). An automated feature selection method for visual inspection systems. IEEE Transactions on Automation Science and Engineering, 3(4): 394-406. https://doi.org/10.1109/TASE.2006.877399
[11] Louw, L., Droomer, M. (2019). Development of a low cost machine vision based quality control system for a learning factory. Procedia Manufacturing, 31: 264-269. https://doi.org/10.1016/j.promfg.2019.03.042
[12] Reynolds, M.R., Campana, C., Shetty, D. (2004). Design of machine vision systems for improving solder paste inspection. In ASME International Mechanical Engineering Congress and Exposition, 47136: 921-929. https://doi.org/10.1115/IMECE2004-62133
[13] Zancul, E., Martins, H.O., Lopes, F.P., da Silva Neto, F.A. (2020). Machine vision applications in a learning factory. Procedia Manufacturing, 45: 516-521. https://doi.org/10.1016/j.promfg.2020.04.069
[14] Williams, T.J., Li, H. (1998). PERA and GERAM—enterprise reference architectures in enterprise integration. In International Working Conference on the Design of Information Infrastructure Systems for Manufacturing, pp. 3-30. https://doi.org/10.1007/978-0-387-35385-2_1
[15] Fasth, Å., Bruch, J., Dencker, K., Stahre, J., Mårtensson, L., Lundholm, T. (2010). Designing proactive assembly systems (ProAct)-Criteria and interaction between automation, information, and competence. Asian International Journal of Science and Technology in production and manufacturing engineering (AIJSTPME), 2(4): 1-13.
[16] Chung, C.A. (1996). Human issues influencing the successful implementation of advanced manufacturing technology. Journal of Engineering and Technology Management, 13(3-4): 283-299. https://doi.org/10.1016/S0923-4748(96)01010-7
[17] Vagia, M., Transeth, A.A., Fjerdingen, S.A. (2016). A literature review on the levels of automation during the years. What are the different taxonomies that have been proposed? Applied Ergonomics, 53: 190-202. https://doi.org/10.1016/j.apergo.2015.09.013
[18] Mehta, A., Subramanian, M. (2019). Investigating the barriers to increase Levels of Automation: A case study in pre-assembly of tap changer assembly line. Engineering and Technology.
[19] Fast-Berglund, A., Stahre, J. (2013). Task allocation in production systems–measuring and analysing levels of automation. IFAC Proceedings Volumes, 46(15): 435-441. https://doi.org/10.3182/20130811-5-US-2037.00032
[20] Annett, J. (2003). Hierarchical task analysis. Handbook of Cognitive Task Design, 2: 17-35.
[21] Stanton, N.A. (2006). Hierarchical task analysis: Developments, applications, and extensions. Applied Ergonomics, 37(1): 55-79. https://doi.org/10.1016/j.apergo.2005.06.003
[22] Batchelor, B.G. (Ed.). (2012). Machine vision handbook, 801-870). London, UK: Springer.
[23] Osorio-Comparan, R., Vázquez, E.D.J., López-Juárez, I., Peña-Cabrera, M., Bustamante, M., Lefranc, G. (2018). Object detection algorithms and implementation in a robot of service. In 2018 IEEE International Conference on Automation/XXIII Congress of the Chilean Association of Automatic Control (ICA-ACCA), pp. 1-7. https://doi.org/10.1109/ICA-ACCA.2018.8609807
[24] Krüger, J., Nguyen, T.D. (2015). Automated vision-based live ergonomics analysis in assembly operations. CIRP Annals, 64(1): 9-12. https://doi.org/10.1016/j.cirp.2015.04.046
[25] Golnabi, H., Asadpour, A. (2007). Design and application of industrial machine vision systems. Robotics and Computer-Integrated Manufacturing, 23(6): 630-637. https://doi.org/10.1016/j.rcim.2007.02.005
[26] Tout, K. (2018). Automatic vision system for surface inspection and monitoring: Application to wheel inspection (Doctoral dissertation, Université de Technologie de Troyes-UTT).
[27] Lies, B.T., Cai, Y., Spahr, E., Lin, K., Qin, H. (2018). Machine vision assisted micro-filament detection for real-time monitoring of electrohydrodynamic inkjet printing. Procedia Manufacturing, 26: 29-39. https://doi.org/10.1016/j.promfg.2018.07.004
[28] Keyence (2019). Easy 3 Step Guide Selecting Your First Vision System.
[29] Fasth, Å., Stahre, J., Dencker, K. (2008). Measuring and analysing levels of Automation in an assembly system. In Manufacturing Systems and Technologies for the New Frontier, 169-172. https://doi.org/10.1007/978-1-84800-267-8
[30] Saryanto, S., Purba, H., Trimarjoko, A. (2020). Improve quality remanufacturing welding and machining process in Indonesia using six sigma methods. J. Eur. SystèMes Autom, 53: 377-384. https://doi.org/10.18280/jesa.530308
[31] Ikatrinasari, Z.F. (2018). Improving quality control process through value stream mapping. International Journal of Emerging Technologies in Learning, 7(2): 219-225. https://doi.org/10.14419/ijet.v7i2.29.13321
[32] Fasth, Å. (2012). Quantifying Levels of Automation-to enable competitive assembly systems. Chalmers University of Technology.
[33] Shorrock, S.T., Kirwan, B. (2002). Development and application of a human error identification tool for air traffic control. Applied Ergonomics, 33(4): 319-336. https://doi.org/10.1016/S0003-6870(02)00010-8
[34] Connolly, C. (2003). Using machine vision in assembly applications. Assembly Automation. https://doi.org/10.1108/01445150310486486