Vignesh Margabandu* | Ramanujam Radhakrishnan
© 2021 IIETA. This article is published by IIETA and is licensed under the CC BY 4.0 license (http://creativecommons.org/licenses/by/4.0/).
OPEN ACCESS
In the current study, hard turning of AISI H11 tool steel is done using TiAlN coated cutting tool. The workpiece is prepared by three different processing conditions (Solution treated, Heat treated, Cryogenic treated). The machining performance are studied by the input parameters; cutting speed (60, 90, 120 m/min) and feed rate (0.06, 0.12, 0.18 mm/rev) with a constant depth of cut of 0.5mm using Taguchi’s L9 design. The responses like, surface quality, wear on the tool, and forces generated for all three specimens are studied. The hardness of all three components is measured using Vicker’s micro-hardness tester. The experimental results proved that feed rate is the most influential parameter in deciding, surface roughness, cutting force and tool wear. The utility concept approach is applied and found, solution treated sample with 120 m/min of cutting speed and 0.06 mm/rev of feed rate produces optimal results in all three response criterion.
cryogenic, force, hardness, roughness, turning, Taguchi
In the industrial and research scenario, the hard turning of difficult-to-machine materials has gained higher interest among the people in order to overcome the grinding process of these materials with increased material removal, higher productivity along with better surface quality [1]. The surface quality depends on parameters like tool wear, the force generated during machining, the temperature generated at the machine-tool interface, stresses developed internally, etc. One such difficult-to-machine material is AISI H11 tool steel which has its utilization in the areas of high strength, high stress and increased temperature applications like, aircraft landing gears, helicopter rotor blades, shafts, etc. [2]. Because of its increased utilization, this material has attained the attention of many industrialists and researchers to explore more on its mechanical and machinability point of view. The machinability aspects like, measurement of force generated during machining, measurement of surface roughness (SR) after machining, wear propagation on the machining tool which further enhances the surface quality of the work material. Due to this mechanical machining, there are a lot of chances for stresses to get induced on the work material [3].
Fnides et al. [4] machined H11 tool steel using the ceramic tool for the measurement of cutting force. The investigation resulted that, depth of cut was the important parameter followed by feed rate in deciding the cutting force. While in case of SR criterion is concerned, the feed rate was the influencing parameter [5, 6]. Benlahmidi et al. used Cubic Boron Nitride (CBN7020) tools to machine H11 tool steel to measure the SR, cutting force (CF), tool wear (TW) and cutting power. Response surface methodology (RSM) is used for the conduct of experiments and analysis of variance (ANOVA) method is used to analyze the responses. Cutting speed is the most influencing parameter for deciding the cutting power during machining [7].
During machining of this material, a large amount of tool wear would get generated because of its increased hardness. As for the previous work and literature is concerned, all the researchers had used high hard ceramic tools for increased tool life. On the contrary, the tooling and machining cost of the process gets increased to a higher level, which is recommended. Dureja [8] studied tool wear criterion using TiN coated CBN tool. The optimization and mathematical modeling of the wear pattern are conducted to using RSM technique and found the main mode for wear occurrence is abrasion at the lower cutting speed [9]. In addition to the basic machinability characteristics, the formation of residual stresses within the material after the machining operation is studied by Saini et al. [1]. The results show that, depth of cut (DOC) contribution is more in deciding the tangential residual stresses followed by feed rate (FR), cutting speed and nose radius. While in circumferential residual stress, DOC and FR contributes more than cutting speed (CS) and nose radius. Hence, many researchers concentrated on studying these machinability parameters directly on the as-received solution treated the material. Another few groups of researchers [10-12] have concentrated on working on H11 material in the heat treated state. They studied the mechanical output parameters like hardness, impact strength, ultimate tensile strength, ductility, yield strength, etc. The authors’ results stated that there is some gradual improvement in the obtained mechanical properties when compared to as received solution treated H11 material.
From the detailed review of the literature of AISI H11 tool steel, most of the researchers have worked on the basic machinability study using ceramic and CBN cutting tools. The performance study using these tools was completely discussed in the solution treated material. But a limited number of work is performed on the treated (like heat treated, cryogenic treated) AISI H11 tool steel work material. This stands unique in comparison with the other previous studies conducted on machinability of H11 tool steel. There is no any comparison of results are so for reported on different process conditions of work material. Hence, in the present experimental study comparison of the machinability properties of the solution treated, heat treated and cryogenic treated material using TiAlN coated tool is performed. The complete machinability aspects like CF, SR and TW are studied in detail by conducting a full factorial experiment by varying CS and FR with a constant DOC of 0.5 mm. Mechanical property, micro-hardness is measured to study the variation of hardness due to various treatment procedures. The samples are subjected to three different procedures namely, as received condition (solution treated), heat treatment (includes annealing, Austenizing is conducted followed by tempering) and the last condition is the deep cryogenic treatment.
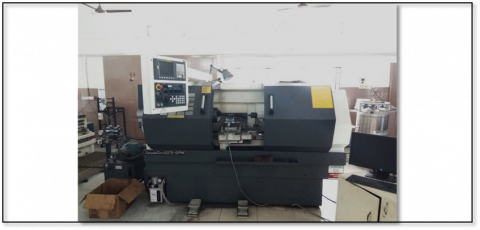
The work material chosen is AISI H11 tool steels which have very good applications in various industrial sectors like aerospace, medical, etc. The dimensions of the selected sample are 30 mm diameter and 300 mm length. The tool chosen for machining H11 steel is TiAlN coated carbide inserts of designation CNMG 120408. All the machining experiments are conducted on a CNC lathe (Make: ACE Micromatic) shown in Figure 1.
Figure 1. High-speed CNC lathe used for machining
The machinability of the material is studied by processing it at three different conditions say, solution treated, heat treated and cryogenic treated.
2.1 Steps in heat treatment
The received material is subjected to annealing, austenitizing and tempering processes. The steps involved in processing is given below.
(1) Annealing procedure consisted of preheating the sample in the furnace to a temperature of 200°C and holding the sample at that temperature for 15 min; followed by slow heating of the sample to 850°C; and again, holding it for 2 hr; followed by slow cooling to 480°C, and then brisk cooling the sample to room temperature.
(2) Austenizing includes preheating the sample in the furnace to a temperature of 260°C followed by slow heating to 815°C and then holding the sample at that temperature for 15 minutes and further slow heating it to 1010°C and it is maintained for 30 minutes.
(3) Followed the heating cycle, the furnace is shut down and sample cooling is carried out inside the furnace itself till it reaches the room temperature.
(4) Finally, the tempering process is conducted by holding the workpiece at 500°C for a period of 2 hours. Then, the sample is taken from the furnace and brought down to room temperature.
Through this process, the stresses remained in the material during material processing gets removed and the hardness of it gets improved due to this treatment process. The objective of the study is to compare the machinability of the work material produced through three different processing techniques. The comparison on machinability of AISI H11 components processed through three different techniques stands unique in this study. Very limited number of researchers reported previously on different materials but not in H11 tool steel. Hence, this study remains interesting for the researchers to explore more in this area.
2.2 Deep cryogenic treatment
Another sample is introduced for deep cryogenic treatment and the sequence of stages involved in Cryogenic treatment of AISI H11 tool steel is given in Figure 2.
The stages involved in cryogenic treatment and the explanation of the graph mentioned is given below,
(1) The samples are slowly cooled from room (ambient) temperature to -196°C using liquid nitrogen, without inducing any thermal stresses and it is held there for a period of 24 hrs and it heated back to room temperature slowly.
(2) This cooling and heating reduce thermal warpage during the process.
(3) During the process, the conversion of austenite to martensite takes place with proper carbon redistribution inside the material during the processing period.
(4) This is responsible for the increase in hardness, wear resistance and compressive residual stresses within the material [13]. Hence, the cryogenic treated sample is tempered to retrieve its properties back for effective utilization.
AISI H11 tool steel being a most utilized material in the area of aerospace application, has been less tested under cryogenic environment. Hence, in the present work, the study of H11 tool steel under the said environment is studied for its machinability performance and the results are compared with other processed conditions of the material.
Figure 2. Stages of cryogenic treatment [Source: Industrial Heating]
The effect of variation of machining conditions of work material processed by different techniques was analyzed, by studying the responses like hardness, SR, CF, and TW. The L9 experiments are conducted by varying CS and FR at three different levels for three types of work material types individually. The hardness measurement is conducted by measuring the samples after each processing technique through Vicker’s hardness tester. The surfaces of the machined samples are measured for its roughness using Mahr Surf (GD 120) surface profiler. The CF is measured using a Kistler 3-component force dynamometer and its data acquisition system. The TW obtained during machining of every trial is measured using an optical microscope.
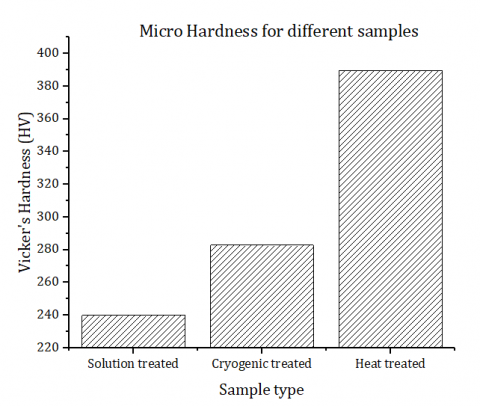
The machinability of the work piece at different treated conditions is studied in the aspects of hardness, CF, SR and TW. The hardness values obtained for all three samples are plotted and shown in Figure 3.
The variation of sample hardness treated at different conditions shows that the material internal property changes according to the treatment procedure. During material processing, the internal stresses developed during the work material fabrication gets eliminated. Also, due to the rise and drop of the temperature, the toughness of the material gets improved by carbide precipitation throughout the sample. This makes the material suitable for severe working condition applications [14]. Based on the plot it is evident that the cryogenic treated and heat treated sample out-performed solution treated sample in hardness criterion. This property is one of the important mechanical property, which defines the machinability of the component. But higher the hardness of the component, the machinability of it gets affected because of the carbide precipitation at the gain boundary. This affects the machinability and machining cost of it and in turn results in the poor surface quality of the component. The need and importance of this micro-hardness study is to know the influence of treatment procedures on hardness property evaluation. The solution treated sample shows 240 HV of micro-hardness, cryogenic treated sample shows 283 HV micro-hardness and heat treated samples shows higher micro-hardness of 390 HV, respectively. This material is introduced for other machinability studies in the upcoming sections to know its further machinability and tool wear performance [15]. The experimental machining conditions are given in Table 1.
Figure 3. Microhardness of different samples
Table 1. Experimental input parameters
|
Parameters |
Level 1 |
Level 2 |
Level 3 |
|
Specimen type |
Solution treated |
Cryogenic treated |
Heat treated |
|
Cutting speed (m/min) |
60 |
90 |
120 |
|
Feed rate (mm/rev) |
0.06 |
0.12 |
0.18 |
3.1 Influence of CS and FR on cutting force
During machining operation, CS and FR are the important parameters in deciding the machinability characteristics. During material processing of AISI H11 tool steel, the carbides get deposited throughout the material resulting in increased hardness, thus making the material to fall under the difficult-to-cut category. During machining of treated material, higher force generation takes place. This imparts increased CF on the work material and the cutting tool.
Figure 4. Effect of (a) CS and (b) FR on CF
The results from Figure 4(a) shows that, as the CF are higher at the lower CS for solution treated and cryogenic treated and it gets decreased at higher CS and it is vice-versa for heat treated samples. The lower cutting force of 122 N is obtained for solution treated sample 120 m/min of cutting speed. The theoretical reason for the reduced CF is, as the CS increases, the amount of force that is acted on the workpiece for material removal is found lower. It is because of the lesser tool contact time with the work material. In addition to this cutting speed, one more important parameter that decides the force generation on the work material is, the feed rate. As the FR increases, the CF generated or imparted on the workpiece material is found to be very higher and it works along with the CS. Figure 4(b) clearly shows that, the increased FR causes increased CF. The same pattern and condition are followed for all three types of samples. As in case of cutting speed criterion, in feed rate criterion also heat treated sample has the higher cutting force of 269.06 N. The least force generation is for solution treated sample of 59.85 N. The force generation criterion for heat treated sample is found to be opposite for both the parameters. In cutting speed criterion, the cutting force value keeps increasing, instead of getting decreased. In the feed rate criterion, at higher feed rate, the cutting force value is found higher (212 N) and at lesser feed rate the cutting force value is found lower (60 N). It is found to be in-line with the theoretical phenomenon of feed rate criterion. To know which parameter (CS or FR) contributes more in deciding output response is found out using ANOVA table.
3.2 ANOVA analysis for cutting force
ANOVA analysis is performed for all three rods by considering 95% confidence limit and data are tabulated in Table 2.
From the ANOVA analysis, it is seen that the FR is the most contributing factor in deciding the CF on the machined component (all three specimens). The percentage of contribution is more than 80% of the selected parameters. More the feed rate, more the tool instability during machining. This exerts more force on the tool, resulting in increased CF generation.
Table 2. ANOVA analysis for CF
|
Source |
DF |
SS |
MS |
F-Value |
P-Value |
% Contribution |
|
Solution annealed rod |
||||||
|
CS |
2 |
2532.0 |
1266.0 |
11.7 |
0.021 |
6.54 |
|
FR |
2 |
35736.7 |
17868.3 |
166.2 |
0.000 |
92.35 |
|
Error |
4 |
430.0 |
107.5 |
1.11 |
||
|
Total |
8 |
38698.6 |
100 |
|||
|
Cryogenically treated rod |
||||||
|
CS |
2 |
698.7 |
349.4 |
1.22 |
0.387 |
5.72 |
|
FR |
2 |
10358.9 |
5179.4 |
18.04 |
0.010 |
84.87 |
|
Error |
4 |
1148.6 |
287.1 |
|
|
9.41 |
|
Total |
8 |
12206.1 |
|
|
|
100 |
|
Heat treated rod |
||||||
|
CS |
2 |
9206 |
4603.2 |
4.82 |
0.086 |
12.47 |
|
FR |
2 |
60799 |
30399.3 |
31.84 |
0.003 |
82.36 |
|
Error |
4 |
3819 |
954.8 |
|
|
5.17 |
|
Total |
8 |
73824 |
|
|
|
100 |
Note: DF – Degrees of Freedom, SS – Sum of Squares, MS – Mean Square, F-Value – Fisher’s value, P-Value – Probability Value.
3.3 Influence of CS and FR on SR (Ra)
In addition to the CF generated during machining, the SR on the machined component plays a vital role in material quality. The surface quality on the machined component, CF, and wear on the tool are all interrelated. The output of each and every response depends on the contribution of all others. In general practice, as low as the SR, the surface finish of the component is found to be excellent. It is the motive of each and every researcher and machinist to produce a component with minimal SR. In the present discussion, the effect of input parameters (CS and FR) on SR is studied and the plots of it are shown in Figure 5.
From the plot shown in Figure 5(a), the effect of CS on SR is conducted and the results are plotted. The results showed that, as the CS is increased, the SR gets decreased in all the treated conditions of the rod. Similarly, the same pattern of decrease in the SR as the CS increases are observed. And also, the FR plot on SR is shown in Figure 5(b). The general theoretical concept says that as the feed rate increases the surface finish of the machined surface gets deteriorated. The plot shown above follows the same criteria irrespective of the work material [16]. The maximum SR obtained was 1.413 µm at the FR of 0.18 mm/rev. The least SR is observed as 0.34 µm at 0.06 mm/rev of FR. For the same observed data, ANOVA is performed to understand the most contributing factor in deciding SR on the machined surface. The ANOVA for the present analysis is shown in Table 3. The results of the ANOVA table show that once again the feed rate contributes more in deciding the SR on the machined component too. Thus, the result from experimentation and ANOVA analysis proves that feed rate is found to be the most dominant factor in deciding the surface finish of the component. More the tool instability, more the tool vibration leading too poor surface finish on the work material. This results in increased SR.
Figure 5. Effect of (a) CS and (b) FR on SR
Table 3. ANOVA analysis for SR
|
Source |
DF |
SS |
MS |
F-Value |
P-Value |
% Contribution |
|
Solution annealed rod |
||||||
|
CS |
2 |
0.0064 |
0.0032 |
0.37 |
0.711 |
0.35 |
|
FR |
2 |
1.7879 |
0.8939 |
102.71 |
0.000 |
97.74 |
|
Error |
4 |
0.0348 |
0.0087 |
|
|
1.90 |
|
Total |
8 |
1.8292 |
|
|
|
100 |
|
Cryogenically treated rod |
||||||
|
CS |
2 |
0.0217 |
0.0108 |
1.35 |
0.357 |
1.68 |
|
FR |
2 |
1.2387 |
0.6193 |
76.78 |
0.001 |
95.82 |
|
Error |
4 |
0.0322 |
0.0080 |
2.50 |
||
|
Total |
8 |
1.2927 |
|
|
|
100 |
|
Heat treated rod |
||||||
|
CS |
2 |
0.0860 |
0.0430 |
4.88 |
0.084 |
7.18 |
|
FR |
2 |
1.0770 |
0.5385 |
61.13 |
0.001 |
89.88 |
|
Error |
4 |
0.0352 |
0.0088 |
2.94 |
||
|
Total |
8 |
1.1983 |
100 |
|||
3.4 Influence of CS and FR on TW
In TW analysis, the finishing operation is considered. Hence the maximum tool wear limit that a tool can withstand before it said to be worn out is 0.3 mm (300 µm). As for as the results of tool wear on machining of AISI H11 tool steel processed at three different processing techniques is concerned, the maximum tool wear observed while machining of this material is 193.06 µm. The least tool wear observed was 96.83 µm at 0.06 mm/rev of FR. The wear pattern observed was (shown in Figure 6(a)), as the CS increases the TW drops and then increases gradually for all three treated rods. Out of these three specimens, the solution treated rod produces good results when compared to the other two. Whereas on the FR criterion (shown in Figure 6(b)), the tool wear increases are the FR increases and get decreased slowly. TW is the phenomenon that occurs due to the force that tool exerts on the work material for a removal action. As the force exerted is more, an increased heat gets generated at the work-tool interface resulting in deterioration of the tool material. This causes rapid TW and this, in turn, causes dimensional inaccuracies and poor surface finish on the machined work material surface.
The ANOVA analysis is performed for the results of the tool wear obtained, and its results showed that feed rate contributes high in deciding tool wear too (Table 4). More the force generation on the work material, higher the temperature generation, leading to increased tool wear. The increased force generation is also related to the increased feed rate during machining.
Figure 6. Effect of (a) CS and (b) FR on TW
Table 4. ANOVA analysis for TW
|
Source |
DF |
SS |
MS |
F-Value |
P-Value |
% Contribution |
|
Solution annealed rod |
||||||
|
CS |
2 |
151.2 |
75.62 |
0.54 |
0.619 |
7.34 |
|
FR |
2 |
1349.9 |
674.94 |
4.83 |
0.086 |
65.53 |
|
Error |
4 |
558.7 |
139.67 |
|
|
27.12 |
|
Total |
8 |
2059.8 |
|
|
|
100 |
|
Cryogenically treated rod |
||||||
|
CS |
2 |
2423 |
1738 |
0.46 |
0.684 |
8.25 |
|
FR |
2 |
19416 |
9708 |
2.58 |
0.280 |
66.09 |
|
Error |
4 |
7540 |
3770 |
|
|
25.66 |
|
Total |
8 |
29378 |
|
|
|
100 |
|
Heat treated rod |
||||||
|
CS |
2 |
285.3 |
192.8 |
0.58 |
0.613 |
1.61 |
|
FR |
2 |
16384.0 |
8192.0 |
24.57 |
0.014 |
92.72 |
|
Error |
4 |
1000.2 |
333.4 |
|
|
5.66 |
|
Total |
8 |
17669.5 |
|
|
|
100 |
The images of the machined tool are captured using an optical microscope (Make: Dinolite) and are shown in Figure 7. The images given below shows the crater wear pattern observed during machining. The Figure 7(a), shows the tool wear obtained for machining cryogenic treated sample at 90 m/min of cutting speed and 0.18 mm/rev of feed rate. Figure 7(b), shows the tool wear obtained for machining heat treated sample at 90 m/min of cutting speed and 0.18 mm/rev of feed rate. On comparison, it is evident that, heat treated sample possess increased tool wear when compared to cryogenic treated sample for the same machining conditions. The most predominant and commonly obtained wear pattern is flank wear [17].
Figure 7. Tool wear observations from optical microscope
In the previous sections, all the responses like, CF, SR and TW are analysed individually to study its parametric contributions for all the selected input parameters and the type of work material. Among the selected input conditions, FR is the most contributing factor in deciding the responses based on the ANOVA analysis. Among the work materials, solution treated work material produces better machining results. In that, which level of feed rate contributes more in deciding the responses are to be studied for its effective machining at the place of use. The obtained optimal level should be a common level for all three responses in deciding a better output. The results discussed previously is for the single response optimization and this finds difficult for the industrialists to select the better optimal level for the multiple responses. This gave rise to the introduction of multi response optimal study for obtaining a single optimal level for multiple responses. One such multi response optimal study is the Utility concept approach, which uses the preference number to determine the best optimal level. Based on the preference number, overall utility index is calculated. Highest overall utility index level is the better optimal level for the desired responses [18, 19]. The contribution of this technique is highly recommended for the present work, because of its capability of obtaining one particular optimal machining level.
4.1 Utility concept approach
Utility is defined as the usefulness of the process with respect to the expectations of the consumers or the customers. In order to meet or satisfy the consumer expectations, the overall performance of the multiple output quality characteristics need to be taken into account along with the relative contribution of selected individual factors. This overall composite index contributes to the overall utility. Hence, the utility refers to the satisfaction of consumers on all the selected attributes. Also, the utility theory works on the basis of utility maximization principle, where the highest satisfaction level is chosen as the best choice (optimal level) by the decision maker [20, 21].
Based on the obtained overall utility index, the best optimal level is chosen for getting the good result on all responses. According to Utility theory, if Xi is the effectiveness measurement of the output response ‘i’and there are ‘n’ responses measuring the output, then the joint utility function could be expressed as:
$\begin{array}{c}
U\left(X_{I}, X_{2}, \ldots, X_{n}\right)=f(\mathrm{U} 1(\mathrm{X} 1), \mathrm{U} 2(\mathrm{X} 2), \ldots . \mathrm{Un} \\
(\mathrm{Xn}))
\end{array}$ (1)
The overall utility function is the summation of individual utilities if the responses are independent and is given as,
$U=\sum_{i=1}^{n} P_{i}$ (2)
where, Pi is the preference number of individual responses.
The preference number could be expressed as follows:
$P_{i}=A^{*} \log \frac{X_{i}}{X_{i}^{\prime}}$ (3)
where, Xi is the value of quality characteristic, i, Xi’ is just acceptable value of quality characteristic, i, and A is a constant.
The value A is adopted by the condition, if Xi= X* (where X* is the optimal or best value), then Pi=9. Therefore,
$A=\frac{9}{\log \frac{X^{*}}{X_{i}^{\prime}}}$ (4)
The individual obtained utility number is used to obtain overall utility index (UI), through the summation of individual responses. The overall UI is considered as single response function for optimization. Among various quality characteristics proposed by Taguchi, the utility function considers larger-the-better characteristics. The overall utility index calculated for all the responses are shown in Table 5. Among the obtained overall UI values, the larger UI value level is found to be the best optimal level.
The table shows the overall UI calculated based on the formula given in equations 1 to 4. From the table, the highest utility index is 23.7895 and the least utility index is 4.1288. Always the highest utility index level, gives the best optimal level for getting good responses. On this criterion, trial number 7 has highest utility index of 23.7895. The corresponding experimental levels are solution treated sample, with 120 m/min of CS and 0.06 mm/rev of FR. Experimentally, in that particular level, the values obtained are found to be nominally low when compared to other machining conditions. The ANOVA is calculated for the obtained overall UI and the data are tabulated in Table 6.
The analysis of variance clearly shows that, even for overall utility index, the most contributing factor is found to be feed rate. The contribution percentage is found to be 91.20%., following which comes the error percentage contribution of 8.48%. The reason for higher feed rate contribution in deciding CF, SR and TW is, FR is inter-related in deciding all the selected responses. Higher the feed rate, more amount of force is required to remove the material, which in turn increases the TW. As the FR and TW is more, the SR is also found to be higher among the selected input conditions [22]. Hence, the FR is found to be the most influencing factor in deciding the machined sample quality.
Table 5. Overall utility index
|
Trial No. |
Preference number |
Overall Utility index |
||
|
CF (N) |
SR (microns) |
TW (microns) |
||
|
1 |
5.111 |
8.660 |
4.77 |
18.5429 |
|
2 |
2.492 |
4.263 |
6.37 |
13.1340 |
|
3 |
1.399 |
1.001 |
5.95 |
8.3538 |
|
4 |
5.449 |
9.000 |
5.64 |
20.0907 |
|
5 |
2.775 |
4.914 |
7.30 |
14.9961 |
|
6 |
1.803 |
0.000 |
6.22 |
8.0246 |
|
7 |
9.000 |
8.828 |
5.96 |
23.7895 |
|
8 |
3.059 |
4.744 |
6.94 |
14.7439 |
|
9 |
2.084 |
0.871 |
4.82 |
7.7808 |
|
10 |
2.779 |
8.186 |
5.72 |
16.6928 |
|
11 |
2.521 |
5.746 |
3.00 |
11.2752 |
|
12 |
1.463 |
2.212 |
2.17 |
5.8529 |
|
Trial No. |
Preference number |
Overall Utility index |
||
|
CF (N) |
SR (microns) |
TW (microns) |
||
|
13 |
2.552 |
8.498 |
8.70 |
19.7547 |
|
14 |
2.835 |
5.000 |
2.92 |
10.7562 |
|
15 |
1.581 |
0.744 |
2.07 |
4.3998 |
|
16 |
3.920 |
8.498 |
5.44 |
17.8642 |
|
17 |
2.693 |
5.846 |
2.99 |
11.5309 |
|
18 |
1.595 |
1.133 |
2.20 |
4.9311 |
|
19 |
7.564 |
5.178 |
7.22 |
19.9644 |
|
20 |
2.946 |
5.361 |
3.11 |
11.4232 |
|
21 |
1.515 |
0.341 |
2.27 |
4.1288 |
|
22 |
6.292 |
7.473 |
6.32 |
20.0893 |
|
23 |
2.495 |
5.089 |
3.72 |
11.3113 |
|
24 |
1.487 |
1.269 |
3.10 |
5.8660 |
|
25 |
4.141 |
7.084 |
9.00 |
20.2246 |
|
26 |
2.325 |
6.838 |
0.00 |
9.1624 |
|
27 |
0.000 |
2.159 |
3.55 |
5.7149 |
Table 6. ANOVA for the overall utility index
|
Source |
DF |
SS |
MS |
F-Value |
P-Value |
% contribution |
|
CS |
2 |
2.811 |
1.40 |
0.40 |
0.675 |
0.308 |
|
FR |
2 |
830.744 |
415.37 |
118.29 |
0.000 |
91.20 |
|
Error |
22 |
77.252 |
3.51 |
8.48 |
||
|
Lack-of-Fit |
4 |
5.538 |
1.38 |
0.35 |
0.842 |
|
|
Pure Error |
18 |
71.714 |
3.98 |
|
||
|
Total |
26 |
910.807 |
100 |
4.2 Regression equation
Overall Utility Index = 12.607 - 0.455 Cutting speed_60 + 0.202 Cutting speed_90 + 0.253 Cutting speed_120 + 7.061 Feed rate_0.06 - 0.570 Feed rate_0.12 - 6.490 Feed rate_0.18 (5)
Based on the analysis, the regression equation is formed to theoretically predict the responses without conducting the experimentation. The formulated regression equation is given in Eq. (5). The equation is formed based on the responses obtained through the conducted experiments.
The experimental investigation of AISI H11 tool steel processed by solution treated, heat treated and cryogenic treated condition by varying CS and FR at three different levels are studied. This being the novel approach for studying the performances of work material of different processing conditions. Similar kind of study was not reported by previous researchers. Based on the experimentation, the FR is found to be the most influencing factor in deciding all the responses. Out of all three work material, solution treated material performs well. Due to the increase and decrease of the temperature on the work material, the carbide formation takes place throughout the work material making the material difficult to machine. The highest hardness of 389.46 HV is obtained for the heat-treated sample, lower than that is a cryogenically treated sample of 282.8 HV. The least SR of 0.34 µm is obtained at 120 m/min of CS and 0.06 mm/rev of FR, least CF of 80.42 N is observed at 60 m/min of CS and 0.06 mm/rev of FR on solution treated sample and lower TW of 63.5 µm is obtained at 120 m/min of CS and 0.06 mm/rev of FR for cryogenically treated sample. The optimal level obtained are different for different responses and this gave rise to the introduction of multi objective optimization method. Utility concept based multi objective approach is used to identify one best optimal level for multiple responses. Based on the analysis, it was found that solution treated sample, at 120 m/min of CS and 0.06 mm/rev of FR produces better results for varying responses.
|
ANOVA |
Analysis of Variance |
|
CBN |
Cubic boron nitride |
|
CF |
Cutting force (N) |
|
CS |
Cutting speed (m/min) |
|
DOC |
Depth of Cut (mm) |
|
Pi |
Preference number |
|
RSM |
Response surface Methodology |
|
SR |
Surface roughness (microns) |
|
TiAlN |
Titanium Aluminium Nitride |
|
TiN |
Titanium nitride |
|
TW |
Tool wear (microns) |
|
UI |
Utility index |
|
Xi |
Value of quality characteristic |
[1] Saini, S., Ahuja, I.S., Sharma, V.S. (2012). Influence of cutting parameters on tool wear and surface roughness in hard turning of AISI H11 tool steel using ceramic tools. International Journal of Precision Engineering and Manufacturing, 13(8): 1295-1302. https://doi.org/10.1007/s12541-012-0172-6
[2] Vignesh, M., Ramanujam, R. (2018). Response optimisation in wire electrical discharge machining of AISI H11 tool steel using Taguchi-GRA approach. International Journal of Machining and Machinability of Materials, 20(5): 474-495. https://doi.org/10.1504/IJMMM.2018.096037
[3] Aouici, H., Yallese, M.A., Fnides, B., Chaoui, K., Mabrouki, T. (2011). Modeling and optimization of hard turning of X38CrMoV5-1 steel with CBN tool: Machining parameters effects on flank wear and surface roughness. Journal of Mechanical Science and Technology, 25(11): 2843-2851. https://doi.org/10.1007/s12206-011-0807-z
[4] Fnides, B., Yallese, M.A., Mabrouki, T., Rigal, J.F. (2011). Application of response surface methodology for determining cutting force model in turning hardened AISI H11 hot work tool steel. Sadhana, 36(1): 109-123. https://doi.org/10.1007/s12046-011-0007-7
[5] Fnides, B., Yallese, M.A. (2008). Cutting forces and surface roughness in hard turning of hot work steel X38CrMoV5-1 using mixed ceramic. Mechanics, 70(2): 73-78.
[6] Aouici, H., Fnides, B., Elbah, M., Benlahmidi, S., Bensouilah, H., Yallese, M. (2016). Surface roughness evaluation of various cutting materials in hard turning of AISI H11. International Journal of Industrial Engineering Computations, 7(2): 339-352. https://doi.org/10.5267/j.ijiec.2015.9.002
[7] Benlahmidi, S., Aouici, H., Boutaghane, F., Khellaf, A., Fnides, B., Yallese, M.A. (2017). Design optimization of cutting parameters when turning hardened AISI H11 steel (50 HRC) with CBN7020 tools. The International Journal of Advanced Manufacturing Technology, 89(1-4): 803-820. https://doi.org/10.1007/s00170-016-9121-3
[8] Dureja, J.S. (2012). Optimisation of tool wear during hard turning of AISI-H11 steel using TiN coated CBN-L tool. International Journal of Machining and Machinability of Materials 2, 12(1-2): 37-53. https://doi.org/10.1504/IJMMM.2012.048556
[9] Saini, S., Ahuja, I.S., Sharma, V.S. (2013). Modelling the effects of cutting parameters on residual stresses in hard turning of AISI H11 tool steel. The International Journal of Advanced Manufacturing Technology, 65(5-8): 667-678. https://doi.org/10.1007/s00170-012-4206-0
[10] Qamar, S.Z. (2009). Effect of heat treatment on mechanical properties of H11 tool steel. Journal of Achievements in Materials and Manufacturing Engineering, 35(2): 115-120.
[11] Podgornik, B., Puš, G., Žužek, B., Leskovšek, V., Godec, M. (2018). Heat treatment optimization and properties correlation for H11-type hot-work tool steel. Metallurgical and Materials Transactions A, 49(2): 455-462. https://doi.org/10.1007/s11661-017-4430-1
[12] Šebek, M., Falat, L., Kováč, F., Petryshynets, I., Horňak, P., Girman, V. (2017). The effects of laser surface hardening on microstructural characteristics and wear resistance of AISI H11 hot work tool steel. Archives of Metallurgy and Materials, 62(3): 1721-1726. https://doi.org/10.1515/amm-2017-0262
[13] Senthilkumar, D. (2016) Cryogenic treatment: Shallow and deep. Encycl. Iron, Steel and Their Alloy, 995-1007.
[14] Yugandhar, T., Krishnan, P.K., Rao, C.V.B., Kalidas, R. (2002). Cryogenic treatment and its effect on tool steel. 6th Int. Tool. Conf. 24, pp. 671-684.
[15] Aouici, H., Khellaf, A., Smaiah, S., Elbah, M., Fnides, B., Yallese, M.A. (2017). Comparative assessment of coated and uncoated ceramic tools on cutting force components and tool wear in hard turning of AISI H11 steel using Taguchi plan and RMS. Sādhanā, 42(12): 2157-2170. https://doi.org/10.1007/s12046-017-0746-1
[16] Khellaf, A., Aouici, H., Smaiah, S., Boutabba, S., Yallese, M.A., Elbah, M. (2017). Comparative assessment of two ceramic cutting tools on surface roughness in hard turning of AISI H11 steel: including 2D and 3D surface topography. The International Journal of Advanced Manufacturing Technology, 89(1-4): 333-354. https://doi.org/10.1007/s00170-016-9077-3
[17] Rathod, K.B., Lalwani, D.I. (2017) Experimental investigation of flank wear and surface roughness during hard turnign of AISI H11 steel with CBN tools. Indian Journal of Engineering and Materials Science, 24: 171-181.
[18] Nayak, B.B., Mahapatra, S.S. (2014). A utility concept approach for multi-objective optimization of taper cutting operation using WEDM. Procedia Engineering, 97: 469-478. https://doi.org/10.1016/j.proeng.2014.12.271
[19] Kansal, H.K., Singh, S., Kumar, P. (2006) Performance parameters optimization (multi-characteristics) of powder mixed electric discharge machining (PMEDM) through Taguchi’s method and utility concept. Indian Journal of Engineering and Materials Sciences, 13: 209-16.
[20] Routara, B.C., Mohanty, S.D., Datta, S., Bandyopadhyay, A., Mahapatra, S.S. (2010). Optimization in CNC end milling of UNS C34000 medimum leaded brass with multiple surface roughnesses characteristics. Sadhana, 35(5): 619-629. https://doi.org/10.1007/s12046-010-0041-x.
[21] Kumar, J., Khamba, J.S. (2010). Multi-response optimisation in ultrasonic machining of titanium using Taguchi’s approach and utility concept. International Journal of Manufacturing Research, 5: 139-160. https://doi.org/10.1504/IJMR.2010.031629
[22] Singh, P.K., Saini, P., Kumar, D. (2020). Multi response optimization of CNC end milling of AISI H11 alloy steel for rough and finish machining using TGRA. Materials Today: Proceedings, 26(2): 2564-2573. https://doi.org/10.1016/j.matpr.2020.02.544