Jingjing Huang
© 2020 IIETA. This article is published by IIETA and is licensed under the CC BY 4.0 license (http://creativecommons.org/licenses/by/4.0/).
OPEN ACCESS
This study conducts a vibration testing of a turbojet engine and explores the vibration causes. To this end, taking one certain turbojet engine as the research object, the power spectrum analysis (PSA) was performed on the collected vibration signals from the compressor casing and turbine casing of the engine under the rated condition of 0.8. Then, the state characteristic parameters of the rotating machinery were applied to the vibration diagnosis of the engine rotor system. Finally, corresponding vibration reducing measures were proposed. Studies have found that the vibration caused by the unbalanced mass of the main rotor of the turbojet engine is obvious; there is the misalignment of the rotor main shaft or the uneven radial stiffness of the rotor; turbine rotor seal may have dynamic and static rubbing faults. During the commissioning process of turbojet engine, the PSA is conductive to quickly identifying the type, location, and degree of rotor system faults, and relevant vibration reduction measures should be taken in time. The research findings lay the foundation for intelligent fault analysis of the engine.
turbojet engine, engine test, vibration testing, power spectrum analysis, fault diagnosis
Aero-engines are a class of machinery with low life, high cost, and proneness to failure. Due to the high complexity in their internal structure, the necessary fault diagnosis and monitoring intervention should be carried out regularly in the daily operation process, which is the key to its good technical performance. The daily maintenance and regular maintenance inspection of the engine often consumes a lot of manpower and material resources, but it still cannot avoid missing inspections [1, 2]. If the vibration testing of the whole machine can be performed synchronously with the engine test, that is, without the engine being decomposed, early detection and elimination of faults shall be performed based on the different characteristics of the vibration signals of the engine in different states, which have important engineering significance. However, the bearing casing of the engine mostly uses a complicated thin-walled structure with a low rigidity, and easily brings various non-linear interference factors. These factors lead to difficulties in the failure monitoring and analysis of the aero-engine rotor system. As more importance is attached by the aeronautical circle to the aviation engine fault diagnosis technology, the signal diagnosis has been the main implementation method in the process of aviation engine fault diagnosis in the past 20 years. Scholars at home and abroad have conducted a large number of researches on fault diagnosis based on vibration analysis [3-24].
Cheng et al. [3] built a certain type of turboprop engine vibration test system to fulfill the complete machine vibration testing on the factory bench and the field aircraft, and then determined the monitoring threshold of characteristic frequency band based on the fault characteristics. Xie and Wang [4] developed a turbine starter vibration test system, which can monitor the working status of the turbine starter, collect and analyze vibration information to determine the fault location, and provide a reliable experimental research platform for fault diagnosis of gas turbine starter [5]. Daponte et al. [11] proposed a test system for light vertical take-off and landing (VTOL) and remotely controlled aircraft system (RPAS), which detects aircraft-related faults by measuring the thrust module, power consumption and attitude stability of the aircraft under test. In view of the non-stationary characteristics of vibration signals of turboprop engine rotor systems, Ding et al. [14] presented a fault diagnosis method based on the empirical mode decomposition (EEMD) and neighborhood rough set (NRS); by eliminating a large number of redundant features, this method has the accuracy of fault diagnosis up to 97.5% using the sensitive feature set, and the analysis results have strong robustness. Khadersab and Shivakumar [16] experimentally studied bearing failures in rotating machinery and accurately evaluated the failure using various vibration analysis techniques (incl. time domain, frequency domain, and time-frequency domain). Dhamande and Chaudhari [20] performed vibration measurements under different speed and load conditions, and extracted new composite fault features from continuous and discrete wavelet transforms of vibration signals. However, the above studies rarely involve vibration testing and failure analysis of turbojet engines during the ground run. Also, they often focus on finding misalignment and collision failure, but less on how to eliminate the failure that has found.
In view of the above, this paper attempts to explore the vibration failures during the turbojet engine test using the PSA. For this, taking one certain turbojet engine as an example, it performs a real-time acquisition of the turbojet engine's test time-domain waveforms, and conducts the PSA for the main rotor and the accessory drive system of a dual-rotor turbojet engine. In addition, corresponding vibration reducing measures were proposed. This study lays the theoretical and technical foundation for improving the stability, safety and reliability of complex rotor systems.
This paper first introduces the relevant content of a turbojet engine vibration testing, including the engine structure, selection of the vibration measurement location and the vibration sensor, and then details the calculation method of the power spectrum. On this basis, the characteristic frequency was calculated. Finally, it compares the characteristic frequency and PAS results, to find the location and cause of vibration, provide vibration reduction measures, and complete the failure analysis research.
Before performing condition monitoring and fault diagnosis on the engine, it’s necessary to understand the basic structure of the tested engine, collect its vibration signals, and perform effective analysis.
2.1 Structure of a turbojet engine
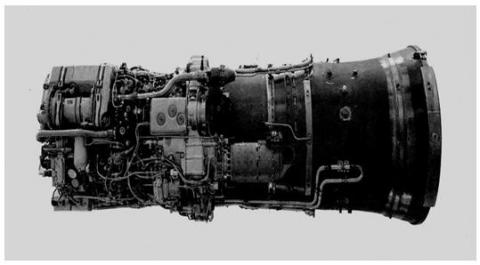
As shown in Figure 1, a dual-rotor turbojet engine with afterburner was selected as the research object. This engine is mainly composed of eight-stage axial flow compressor, tubo-annular combustion chamber, two-stage axial flow turbine and afterburner. In addition, it also includes fuel system, starting system, lubrication system, and electrical equipment system, etc. The high and low pressure rotors use concentric sleeve shafts, separated by front and rear intermediate bearings; the two rotors expand the stable working area of the compressor through automatic adjustment of the rotational speed during work. For the design state, the rotation frequency of the low-pressure rotor f1 was 186 Hz, and the rotation frequency of the high-pressure rotor f2 was 190 Hz; the entire rotor was supported on the front, middle and rear three rolling bearings. The radial and axial loads of the rotor were carried by the compressor casing and the turbine casing, respectively.
Figure 1. Physical diagram of a turbojet engine
In case of abnormality or malfunctions, the vibration of the rotating machinery will change, in terms of the vibration amplitude, frequency, phase, and direction. Therefore, this paper uses the state characteristic parameters of the rotating machinery for the fault diagnosis engine of rotor vibration during test run.
2.2 Selection of vibration measurement location
Under the combined action of mechanical load and aerodynamic load, the main rotor system of the turbojet engine produced various complicated vibration patterns, and became the main vibration source of the engine [25].
According to the technical specification of this engine, the maximum allowable vibration overload coefficient in the horizontal and vertical directions of the compressor casing does not exceed 3.5g under various operating conditions; that in the horizontal and vertical directions of the turbine casing does not exceed 4.5g. Therefore, four vibration measuring points were located respectively in the horizontal position and the vertical position of the compressor casing and the horizontal position and the vertical position of the turbine casing.
2.3 Selection of vibration sensor
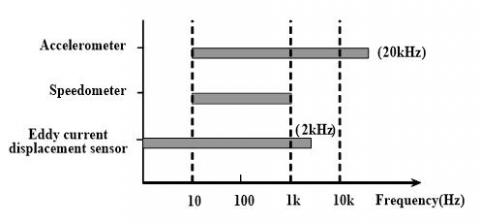
The appropriate sensor for signal acquisition was selected according to the engine test conditions and the frequency range of the measurement parameters. Figure 2 shows the frequency range of the accelerometer, speedometer, and displacement sensor.
Figure 2. Frequency range of three standard vibration sensors
Because the test bed of this turbojet engine cannot be installed with a vibration displacement sensor, the Z-4 magnetoelectric vibration speedometer with a sensitivity of 5(±20%) mV/mm/s was selected finally, which can ensure measuring the parameters in the most direct and reasonable way, and taking into account the vibration frequency range of the measurement point. This sensor is easy to install and requires no power. It is mostly used for engine vibration measurement.
In actual engineering applications, in addition to eliminating and reducing noise interference, it’s also necessary to extract the characteristics of signals through further signal processing for more effective state recognition and fault diagnosis. Based on mature theoretical research and many experimental verifications, the authors have known about some common fault characteristics, and found and confirmed the correspondence between certain characteristics and the state of the equipment or a certain fault.
3.1 Amplitude spectrum analysis
Amplitude spectrum analysis is to directly perform Fourier transform on the time-domain signal obtained by sampling and obtain the frequency composition information. It’s expressed as:
$X(f)=\int_{-\infty}^{+\infty} x(t) e^{-j 2 \pi f t} \mathrm{d} t$ (1)
where, x(t): Time-domain signal (functions using the time t as an independent variable, such as vibration acceleration, velocity or displacement)
X(f): Amplitude spectrum of the signal, i.e., a function of the amplitude with frequency as the independent variable.
For periodic signals, the amplitude spectrum |X(f)| obtained after Fourier transform is a discrete spectrum, that is, the frequency components of the signal are the fundamental wave and its harmonic components; while for non-periodic signals, the amplitude spectrum |X(f)| is a continuous spectrum, that is, the signal is continuously distributed in a certain frequency range. It should be noted that the frequencies calculated by the FFT values are all discrete spectra.
3.2 Power spectrum analysis
The power spectrum is a description of the signal energy or power distribution in the frequency domain. It is also called power spectral density, as a statistical result of the structure under random dynamic load excitation. The power spectrum includes the self-power spectrum and the cross-power spectrum. The self-power spectrum can be obtained from the Fourier transform of the correlation function, or from the amplitude spectrum.
(1) Calculate self-power spectral density function using the amplitude spectrum (periodogram method)
The amplitude spectrum X(f) and the self-power spectrum S(f) of the signal have the corresponding relationship:
$S(f)=\frac{X^{2}(f)}{T}$ (2)
Its discretized sampling is calculated as:
$S_{N}(f)=\frac{1}{N}\left|X_{N}(f)\right|^{2}$ (3)
where, N is the sampling length.
(2) Calculate the power spectrum using correlation functions (correlation diagram method)
With time history signals x(t) and y(t), their auto-correlation functions and cross-correlation functions are Rx(τ), Ry(τ), and Rxy(τ), respectively, which can be obtained by Wiener-Khintchine theorem
$S_{x}(f)=\int_{-\infty}^{\infty} R_{x}(\tau) e^{-2 \pi f \tau} \mathrm{d} \tau$ (4)
$S_{y}(f)=\int_{-\infty}^{\infty} R_{y}(\tau) e^{-2 \pi f \tau} \mathrm{d} \tau$ (5)
$S_{x y}(f)=\int_{-\infty}^{\infty} R_{x y}(\tau) e^{-2 \pi f \tau} \mathrm{d} \tau$ (6)
where, Sx(f) and Sy(f) are self-power spectral density functions, and Sxy(f) is cross-power spectral density function.
The frequency range defined by equations (4-6) was -∞~+∞, and there were spectrum diagrams on the positive and negative frequency axes, so they were two-sided spectra. Theoretical analysis and computational derivation is more convenient with two-sided spectra, but the negative frequency in engineering has no practical physical significance. Thus, one-sided spectra are mostly used:
$G_{x}(f)=2 S_{x}(f)=2 \int_{-\infty}^{\infty} R_{x}(\tau) e^{-2 \pi f \tau} \mathrm{d} \tau$ (7)
$G_{y}(f)=2 S_{y}(f)=2 \int_{-\infty}^{\infty} R_{y}(\tau) e^{-2 \pi f \tau} \mathrm{d} \tau$ (8)
$G_{x y}(f)=2 S_{x y}(f)=2 \int_{-\infty}^{\infty} R_{x y}(\tau) e^{-2 \pi f \tau} \mathrm{d} \tau$ (9)
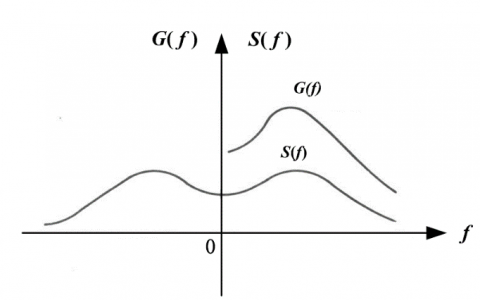
The frequency range of the one-sided spectrum was G(f); at the point of f≥0 and f=0, the relationship between the one-sided spectrum and the two-sided spectrum is shown in Figure 3.
Figure 3. One-sided spectrum and two-sided spectrum diagram
The autocorrelation function is a real even function, while the auto-spectral function is also a real even function, that is,
$S_{x}(-f)=S_{x}(f), S_{y}(-f)=S_{y}(f)$ (10)
$G_{x}(f)=2 S_{x}(f)=2 \int_{-\infty}^{\infty} R_{x}(\tau) e^{-2 \pi f \tau} \mathrm{d} \tau=4 \int_{0}^{\infty} R_{x}(\tau) \cos 2 \pi f \tau \mathrm{d} \tau$ (11)
Conversely, the autocorrelation function can also be expressed as:
$R_{x}(\tau)=\int_{-\infty}^{\infty} S_{x}(f) e^{2 \pi f \tau} \mathrm{d} f=\int_{-\infty}^{\infty} G_{x} \cos 2 \pi f \mathrm{d} f$ (12)
Similarly,
$R_{y}(\tau)=\int_{-\infty}^{\infty} S_{y}(f) e^{2 \pi f \tau} \mathrm{d} f=\int_{-\infty}^{\infty} G_{y} \cos 2 \pi f \mathrm{d} f$ (13)
This is another way to calculate the autocorrelation function, i.e., solve it by the inverse Fourier transform of the auto power density function. Thus, it’s concluded:
(1) In the mechanical system, if Xn is a displacement signal, X2n reflects the potential energy in the elastic body; if Xn is a speed signal, X2n represents the kinetic energy in the system. In the rotating machinery, the vibration failure of the system can be clearly and intuitively observed through the PSA.
(2) The autocorrelation function is the expected value operation of the signal x(t)'s own energy coupling in the time-shift domain (t). The concept of multi-sample averaging was introduced into the power spectrum calculation, suppressing the interference of some random signals in the vibration process and describing the vibration characteristics more stably.
(3) Ignore the influence of the rotor axis trajectory, and assume that the rotor adopts the form of simple harmonic vibration; the displacement S (mm), velocity V (mm/s), and vibration acceleration a (mm/s2) have the following relationships:
$V=2 \pi f S, a=(2 \pi f)^{2} S$ (14)
This realizes the conversion between dimensions in the frequency domain, and eliminates the need for differential integration in the time domain. PSA is mainly used for vibration analysis of rotors and blades.
Under the 0.8 rated condition, the low-speed rotor speed is 9,936 rpm, the high-pressure rotor speed is 10,698 rpm, and the fundamental frequencies of the two rotors are 165.6Hz and 178.3Hz, respectively. Then, 1/2 octave, 2nd harmonic, 3rd harmonic and 4th harmonic are obtained, as shown in Table 1.
Table 1. Vibration characteristic frequency of low and high pressure rotor of engine under 0.8 rated condition
|
|
Rotational frequency/Hz |
1/2 octave /Hz |
2nd harmonics/Hz |
3rd harmonics/Hz |
4th harmonics/Hz |
|
Low pressure |
f1=9936/60=165.6 |
1/2f1=82.8 |
2 f1=331.2 |
3 f1=496.8 |
4 f1=662.4 |
|
High pressure |
f2=10698/60=178.3 |
1/2f2=89.2 |
2 f2=356.6 |
3 f2=534.9 |
4 f2=713.2 |
Under the 0.8 rated condition, the vibration characteristic frequency of the transmission gear is shown in Table 2. The rotation frequency of the first-stage main drive gear is that of the high-pressure rotor, and the first-stage auxiliary drive frequency is that of the low-pressure rotor. The rpm of the other gears is calculated according to the gear transmission ratio.
Table 2. Characteristic frequency of drive gear under 0.8 rated conditions
|
Gear name |
Tooth number |
Rotational frequency (Hz) |
Engage frequency (Hz) |
|
1-stage main drive gear |
36 |
178.3 |
6418.8 |
|
1-stage auxiliary drive gear |
43 |
165.6 |
7122.1 |
|
2-stage main drive gear |
16 |
200.6 |
3209.4 |
|
2-stage auxiliary drive gear |
14 |
151.5 |
2121.5 |
|
Main fuel pump gear |
52 |
64.2 |
3337.5 |
|
Afterburner gear |
50 |
69.3 |
3466.2 |
|
Starter engine gear |
22 |
132.7 |
2918.6 |
Due to the complex structure of the turbojet engine, it is difficult to accurately calculate the vibration characteristics of the whole machine. Therefore, the vibration testing of the whole engine often requires some approximate assumptions and simplifications of the complex rotor structure, and ensures the least degree of freedom while the main vibration characteristics of actual engine remain unchanged; then, based on the manufacturability principle of the entire vibration parameter, it can perform the trend analysis for the rotor vibration of the same engine. This is still an effective method in the engineering application.
The imbalance of the rotor and the gas force are the main sources of vibration for the engine. The engine's vibration mainly refers to the vibration response in the engine casing, accessories (such as fuel regulator, fuel pump, valve, pipeline, etc.) and internal structure (such as the proper position of the main bearing) under all engine working conditions, including the working speed or every dangerous speed higher than idling speed, etc. If the vibration of the whole machine is too large, it may cause friction in the small gaps (e.g., seal and blade tip etc.) between the rotor and the stator, excessive bearing loads, too much vibration stress on accessories, discomfort for pilots and passengers, shaking of pointers on aircraft dashboard and so on. Generally, the imbalance mainly leads to fundamental frequency vibration. Misalignment of the rotor not only affects the fundamental frequency vibration, but also may cause high frequency vibrations such as 2 and 4 frequency multiplication. The friction between the rotor and the fixed parts will excite a wide range of vibrations, which may include the fundamental frequency, frequency multiplication, fractional frequency multiplication, and the natural frequency of the rotor components. The vibration frequency of the rotor component is mainly based on the fundamental frequency, maybe accompanied by the frequency multiplication, or fractional frequency multiplication such as n/2, n/3 (n is the rotor rotation frequency).
The vibration of the turbojet engine was tested on a test bed of a plant, and monitored in real time under a rated condition of 0.8. Besides, F-2G test vibration meter, Z-4 magneto-electrical vibration speedometer, PCI4516 four-channel data acquisition card with the highest sampling rate of 100K were used for vibration measurement.
Under the rated condition of 0.8, the sampling frequency of 2500Hz, and the sampling length of 8192, the time domain waveform and power spectrum at the compressor casing and the turbine casing are as follows:
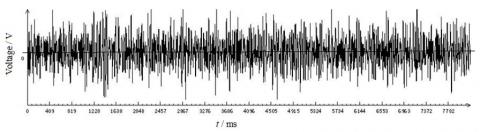
(1) In the rated condition of 0.8, the time-domain waveform diagram of the compressor casing is shown in Figure 4, and its power spectrum is shown in Figure 5.
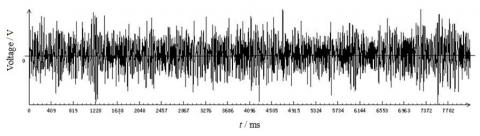
Figure 4. The time-domain waveform diagram of the compressor casing under 0.8 rated condition
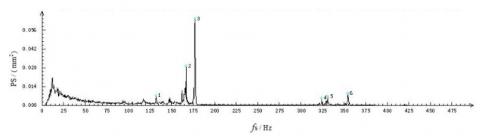
Figure 5. Power spectrum of the compressor casing under 0.8 rated condition
Figure 4 shows the time-domain waveform of the vibration data at the compressor casing under the 0.8 rated condition. It can be seen that the time-domain waveform was very chaotic, and no matter whether it is normal or abnormal, the fault information cannot be directly displayed, making it impossible to determine the fault location and fault level through the waveform. Thus, the PSA on the vibration data was required to transform the time domain waveform diagram into an intuitive and regular spectrum diagram, as shown in Figure 5. The frequency of wave crest 1 was 132.1Hz, which was equivalent to the rotation frequency of the starting generator gear (132.7Hz) under the rated condition of 0.8, indicating that the generator rotor is unbalanced; the frequency of wave crest 2 was 165.4Hz, near the frequency of low-pressure rotor rotation (165.6 Hz), indicating the imbalance of the low-pressure rotor; the frequency of wave 3 was 177.9 Hz, near the high-pressure rotor (178.3 Hz), indicating the imbalance of the high-pressure rotor; Wave crests 1, 2, and 3 all reflect the rotor imbalance caused by the eccentric mass of the rotor component or the defect of the rotor component. On-line dynamic balance correction can be performed on-site through dynamic balance systems and dynamic balance instruments. The frequency of crest 5 was 330.8Hz, near the 2nd harmonic of the low-pressure rotor (331.2Hz), which indicates the misalignment degree of the low-pressure rotor; the frequency of crest 6 was 354.8Hz, near the 2nd harmonic frequency of the high-pressure rotor (356.6Hz), indicating the misalignment degree of the high-pressure rotor or uneven radial stiffness of the rotor. Both crests 5 and 6 reflect the misalignment of the rotors, and the degree of inclination or offset between the axis of the two rotors and the centerline of the bearing to some extent. Rotor misalignment may be caused by factors such as installation errors, rotor manufacturing, and deformation after loading, and changes in ambient temperature. Because of the changes in the coupling's force, the poorly aligned shafting of the rotor can change the actual working position of the rotor journal and bearing. This not only changes the working condition of the bearing, but also reduces the natural frequency of the rotor shafting. Therefore, the rotor misalignment is an important cause of abnormal vibration of the rotor and early damage to the bearing, which requires special attention. Generally, high-precision main bearings can be used to reduce the face runout of the compressor and the turbine, and to increase the tightness of the fit between the compressor disk and the shaft, in order to reduce the effect of the 2nd harmonic component.
(2) In the 0.8 rated condition, the time domain waveform diagram at the turbine casing is shown in Figure 6, and its power spectrum is shown in Figure 7.
Figure 6. Time domain waveform of vibration at the turbine case under 0.8 rated condition
Figure 7. Power spectrum of vibration at the turbine case under 0.8 rated condition
Through the PSA, the time-domain waveform of vibration in Figure 6 was intuitively expressed as the signal frequency component and the energy content of each frequency component, as shown in Figure 7. It can be seen that the frequency of wave crest 1 was 132.1 Hz, equivalent to the fundamental frequency resonance frequency (132.7Hz) of the starter generator under the rated condition of 0.8, indicating the imbalance of the generator rotor; the frequency of crest 2 was 165.7Hz, near that of the low-pressure rotor (165.6 Hz), which indicates the imbalance of the low-pressure rotor; the frequency of crest 3 was 177.3Hz, near the high-pressure rotor (178.3Hz), which characterizes the imbalance of the high-pressure rotor; crest 8 was located at 354.3Hz, near the 2nd harmonic frequency (356.6Hz) of the high-pressure rotor, indicating the misalignment of the high-pressure rotor or unevenness of its radial rigidity; the crest 9 had a series of continuous frequencies (356.6Hz) that were approximately non-periodic signals around, and the center frequency was near the 4th harmonic (713.2 Hz) of the high-pressure rotor, but not reflected at the compressor casing. This is due to the dynamic and static rubbing faults at the seal teeth of the turbine rotor by the rotor's misalignment or the end-to-end deviation of the turbine rotor. It happens from time to time in the maximum state and afterburner of the engine.
This paper performs the PSA on the compressor casing and turbine casing of the selected turbojet engine respectively under the 0.8 rated condition. The conclusions have been drawn as follows:
(1) The vibration testing on the compressor casing found an obvious vibration component at the 1st harmonic of the high-pressure rotor for the engine, which indicates that the vibration caused by the unbalanced mass of the main rotor occupies the main position. To reduce this vibration value, it’s necessary to further improve the dynamic balance accuracy of the rotor system.
(2) The compressor casing and turbine casing are sensitive to the 2nd harmonic vibration components of the low-pressure rotor, indicating the misalignment of the rotor main shaft or uneven radial stiffness of the rotor. Measures such as increasing the accuracy of the main bearing or the tightness of the compressor disc shaft can be used to reduce the influence of the 2nd harmonic components.
(3) A large amount of vibration was measured near the 4th harmonic frequency of the rotating frequency at the turbine casing, but it was not reflected at the compressor casing. This may be due to the dynamic and static rubbing of the turbine rotor seal teeth caused by the rotor's misalignment or the face runout of the turbine. The dynamic and static rubbing faults can be solved by adjusting the concentricity of the rotor and the stator or the sealing teeth.
In summary, the power spectrum is characterized by the energy distribution of the signal, which suppresses the interference of other signals and describes the characteristics of vibration more stably and clearly. Because of its good real-time performance, this method has played an extremely unique role in the field of aero-engine fault diagnosis.
The authors wish to acknowledge the Scientific Research Program Funded by the Natural Science Foundation of Shaanxi Province of China (Program No. 2019JQ-462).
|
X(f) |
the amplitude spectrum |
|
x(t) |
time-history signal |
|
S(f) |
the amplitude spectrum |
|
N |
sampling length |
|
y(t) |
time-history signal |
|
Rx(τ) |
autocorrelation function |
|
Ry(τ) |
autocorrelation function |
|
Rxy(τ) |
cross-correlation function |
|
Sx(f) |
auto-power spectral density function |
|
Sy(f) |
auto-power spectral density function |
|
Sxy(f) |
cross-power spectral density function |
|
G(f) |
the frequency range of unilateral spectrum |
[1] Tao, C.H. (2000). Failure and Prevention of Turning Parts of Aeroengine. National Defense Industry Press.
[2] Zhang, C. (2015). Signal Feature Extraction and Diagnosis of Vibration Fault of an Engine Rotor. Shenyang Aerospace University.
[3] Cheng, L., Qu, K., Chen, W., Shang, B.L., Gao, J.Y. (2015). Vibration monitoring threshold of turboprop engine reducer. Journal of Vibration and Shock, 34(18): 136-141. https://doi.org/10.3969/j.issn.1671-833X.2010.01.020
[4] Xie, P., Wang, X.G. (2016). Realization of vibration testing system for Gas turbine starter. Chinese Hydraulic & Pneumatics, 2016(7): 89-94. https://doi.org/10.11832/j.issn.1000-4858.2016.07.017
[5] Avramchuk, V.S., Kazmin, V.P. (2016). Estimation of combustion engine rotation speed based on vibration signal analysis. Key Engineering Materials, 685: 436-440. https://doi.org/10.4028/www.scientific.net/KEM.685.436
[6] Nejad, A.R., Jiang, Z., Gao, Z., Moan, T. (2016, September). Drivetrain load effects in a 5-MW bottom-fixed wind turbine under blade-pitch fault condition and emergency shutdown. Journal of Physics: Conference Series, 753(11): 112011. https://doi.org/10.1088/1742-6596/753/11/112011
[7] Mehrjou, M.R., Mariun, N., Misron, N., Radzi, M.A.M. (2017). Analysis of statistical features based on start-up current envelope for broken rotor bar fault detection in line start permanent magnet synchronous motor. Electrical Engineering, 99(1): 187-201. https://doi.org/10.1007/s00202-016-0404-3
[8] Pezzani, C.M., Bossio, J.M., Castellino, A.M., Bossio, G.R., De Angelo, C.H. (2017). A PLL-based resampling technique for vibration analysis in variable-speed wind turbines with PMSG: A bearing fault case. Mechanical Systems and Signal Processing, 85: 354-366. https://doi.org/10.1016/j.ymssp.2016.08.010
[9] Moosavian, A., Najafi, G., Ghobadian, B., Mirsalim, M. (2017). The effect of piston scratching fault on the vibration behavior of an IC engine. Applied Acoustics, 126: 91-100. https://doi.org/10.1016/j.apacoust.2017.05.017
[10] Mishra, C., Samantaray, A.K., Chakraborty, G. (2017). Rolling element bearing fault diagnosis under slow speed operation using wavelet de-noising. Measurement, 103: 77-86. https://doi.org/10.1016/j.measurement.2017.02.033
[11] Daponte, P., Lamonaca, F., Picariello, F., Riccio, M., Pompetti, L., Pompetti, M. (2017). A measurement system for testing light remotely piloted aircraft. In 2017 IEEE International Workshop on Metrology for AeroSpace (MetroAeroSpace), 397-402. https://doi.org/10.1109/MetroAeroSpace.2017.7999605
[12] Abdellatif, S., Tahar, S., Boubakeur, Z. (2017). Dynamic analysis of the simultaneous mixed eccentricity and broken rotor bars in induction machine based on magnetic field diagnosis. Recent Advances in Electrical & Electronic Engineering (Formerly Recent Patents on Electrical & Electronic Engineering), 10(2): 101-109. https://doi.org/10.2174/2352096510666170425105816
[13] Bourogaoui, M., Sethom, H.B.A., Belkhodja, I.S. (2017). Real-time encoder faults detection and rotor position estimation for permanent magnet synchronous motor drives fault tolerant sensorless control using digital signal controller. Mathematics and Computers in Simulation, 131: 253-267. https://doi.org/10.1016/j.matcom.2015.09.010
[14] Ding, F., Li, X., Han, S. (2018). Application of EEMD and NRS in turboprop engine rotor fault diagnosis. Journal of Aerospace Power, 33(6): 1423-1431. https://doi.org/ 10.13224/j.cnki.jasp.2018.06.016
[15] Park, Y., Yang, C., Kim, J., Kim, H., Lee, S.B., Yang, C., Kim, J., Kim, H., Lee, S.B., Gyftakis, K.N., Panagiotou, P.A., Kia, S.H., Capolino, G.A. (2018). Stray flux monitoring for reliable detection of rotor faults under the influence of rotor axial air ducts. IEEE Transactions on Industrial Electronics, 66(10): 7561-7570. https://doi.org/10.1109/TIE.2018.2880670
[16] Khadersab, A., Shivakumar, S. (2018). Vibration analysis techniques for rotating machinery and its effect on bearing faults. Procedia Manufacturing, 20: 247-252. https://doi.org/10.1016/j.promfg.2018.02.036
[17] Reddy, M.S.P., Reddy, D.M., Devendiran, S., Mathew, A.T. (2018). Bearing fault diagnosis using empirical mode decomposition, entropy based features and data mining techniques. Mater. Today Proc, 5: 11460-11475. https://doi.org/10.1016/j.matpr.2018.02.114
[18] Praveenkumar, T., Sabhrish, B., Saimurugan, M., Ramachandran, K.I. (2018). Pattern recognition based on-line vibration monitoring system for fault diagnosis of automobile gearbox. Measurement, 114, 233-242. https://doi.org/10.1016/j.measurement.2017.09.041
[19] Singh, J., Darpe, A.K., Singh, S.P. (2018). Rolling element bearing fault diagnosis based on over-complete rational dilation wavelet transform and auto-correlation of analytic energy operator. Mechanical Systems and Signal Processing, 100: 662-693. https://doi.org/10.1016/j.ymssp.2017.06.040
[20] Dhamande, L.S., Chaudhari, M.B. (2018). Compound gear-bearing fault feature extraction using statistical features based on time-frequency method. Measurement, 125: 63-77. https://doi.org/10.1016/j.measurement.2018.04.059
[21] Peeters, C., Guillaume, P., Helsen, J. (2018). Vibration-based bearing fault detection for operations and maintenance cost reduction in wind energy. Renewable Energy, 116: 74-87. https://doi.org/10.1016/j.renene.2017.01.056
[22] Glowacz, A., Glowacz, W., Glowacz, Z., Kozik, J. (2018). Early fault diagnosis of bearing and stator faults of the single-phase induction motor using acoustic signals. Measurement, 113: 1-9. https://doi.org/10.1016/j.measurement.2017.08.036
[23] Taghizadeh-Alisaraei, A., Mahdavian, A. (2019). Fault detection of injectors in diesel engines using vibration time-frequency analysis. Applied Acoustics, 143: 48-58. https://doi.org/10.1016/j.apacoust.2018.09.002
[24] Klausen, A., Khang, H.V., Robbersmyr, K.G. (2020). Multi-band identification for enhancing bearing fault detection in variable speed conditions. Mechanical Systems and Signal Processing, 139: 106422. https://doi.org/10.1016/j.ymssp.2019.106422
[25] Zhong, B.L., Huang, R. (2007). Introduction to Machine Fault Diagnosis. Machinery Industry Press.