Yajun Wang* | Yong Li | Kun Li | Naidong Wang
© 2020 IIETA. This article is published by IIETA and is licensed under the CC BY 4.0 license (http://creativecommons.org/licenses/by/4.0/).
OPEN ACCESS
The traditional heating system in northern China faces various problems, such as energy waste, low efficiency and unreasonable metering. To solve these problems, this paper designs a remote meter reading system for residential heating, and describes the hardware, software and key functions of the system in details. The system consists of five parts: temperature controllers, on-off controllers, heat meters, building managers and a remote data center. Multiple cutting-edge tools were adopted in the system. For example, the Windows CE (Embedded Compact) was introduced to support data processing, the GPRS (General Packet Radio Service) Internet was employed to establish the communication between key modules, and the on-off time-area method was utilized to calculate allocated heat. Empirical results show that our system boasts high efficiency, stability and reliability, despite a simple structure.
on-off time-area method, building manager, remote meter reading, heat metering
The metering and charging of residential heating are critical to the energy efficiency of buildings [1-5]: both suppliers and users are encouraged to actively save energy, exerting huge social and economic benefits [6-10]. Heat metering is a relatively mature technology, as the earliest household measurement can be traced back to the 1920s in Europe [11-15].
The Chinese Ministry of Housing and Urban-Rural Development required all new residential communities in northern China to implement household heat metering since 2010. To fulfill the requirement, residential heating needs to be commercialized, and controlled and measured on a household basis [16-22]. In other words, each user should be enabled to adjust the heat, and the heating fee should be charged as per the amount of heat consumed.
Over the years, household heat metering has entered numerous households [24, 25], but most heating companies still rely on manual meter reading to measure heat consumption. Much effort is needed to enter and statistically analyze the manually collected data, due to the lack of a billing system that manages heat consumption data in a unified manner. This pushes up the labor cost and operating cost of heating companies. What is worse, errors inevitably occur in manual meter reading and statistical analysis. To overcome these drawbacks, it is necessary to develop a remote meter reading system to collect the data on heat consumption.
In light of the above, this paper develops a novel remote meter reading system for residential heating based on state-of-the-art tools like the GPRS (General Packet Radio Service) Internet, the M-Bus (Meter-Bus) and the on-off time-area method. The different parts, hardware design, and software design of our system were introduced in details. The effectiveness of our system was verified through practical applications.
The rest of this paper is organized as follows: Section 2 introduces the overall design of our remote meter reading system; Sections 3 and 4 details the hardware and software of our system, respectively; Section 5 puts forward the conclusions.
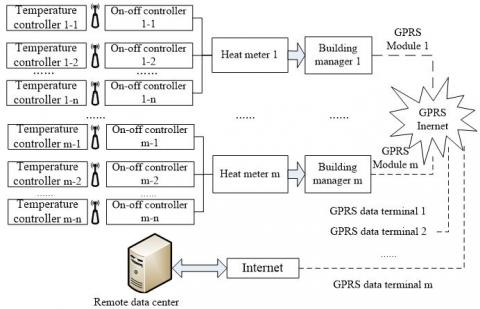
Our remote meter reading system reads the data on the heat meter of each user through wireless or wired mode by the remote data center. As shown in Figure 1, the system consists of five parts: temperature controllers, on-off controllers, heat meters, building managers and a remote data center. The remote data center is connected to the building managers via the GPRS Internet; each building manager is connected to heat meters and one-off controllers by the M-Bus; each on-off controller communicates with the corresponding temperature controller through wireless communication.
Each temperature controller is installed in the room of the corresponding user. The main functions of the controller include acquisition of room temperature, switch of remote control valve, and display of arrears notification. The temperature controller is connected wireless with the corresponding on-off controller to exchange information in real time.
Each on-off controller is installed outdoor and connected to a home valve on the heating pipeline. This controller regulates the room temperature by switching the on-off valve, and records the opening time of the specified valve cycle. Considering the non-heating period and room temperature setting, the on-off controller receives real-time commands from the building manager, and completes the following operations: data upload, clock calibration, and on-off valve regulation.
Each heat meter is installed in the heating pipeline of the building to measure the heat consumed by the building. The meter receives time commands from the building manager, and uploads various types of information to the building manager, such as heat value, inlet/outlet water temperature, and operating parameters.
Each building manager is connected to several on-off controllers and heat meters by the M-Bus. The manager uploads field heat data to the data center remotely across the GPRS Internet, sends reading commands to the controllers and meters, and collects data every 10min in polling mode. The collected data are saved by the manager to the database. The manager also receives and executes real-time commands from the data center. The functions of the manager lay the basis for real-time meter reading and emergency cut off of valves.
The remote data center manages the basic data and heating data of every user. The heating management system at the center has the following functions: real-time payment, data analysis, data maintenance, arrears notification and real-time meter reading.
Figure 1. The architecture of our remote meter reading instrument
3.1 Hardware design of building manager
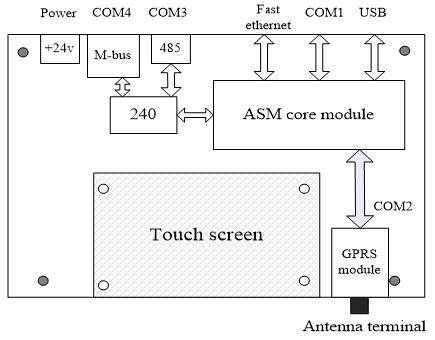
Building managers are the cornerstones of our remote meter reading system. Each building manager serves as a bridge between the corresponding heat meters and the remote data center. On the one hand, the manager forwards the commands from the remote data center to the heat meters and the corresponding on-off controllers; on the other hand, the manager collects information from the meters and the controllers, and uploads it to the remote data center. As shown in Figure 2, the building manager encompasses three key modules: the ASM core module, the M-Bus module and the GPRS module.
Figure 2. The hardware design of a building manager
The ASM core module is the computing and data processing module of the building manager. Running on Windows CE (Embedded Compact), the core module, equipped with the data acquisition software, is capable of issuing meter reading commands, processing the read data and scheduling the entire system. The hardware of the module includes a Samsung S3C2416 ASM9 processor (frequency: 400MHz), a 128MB DDR2 (Double Data Rate 2) memory, and a 1GB NAND flash memory. Empirical evidence shows that the hardware of the ASM core module can satisfy the data processing demand.
The M-Bus module links up the building manager (master) with the corresponding on-off controllers (slaves) and heat meters (slaves). This module forwards the meter reading commands from the master to the slaves, and feedbacks the responses from the slaves to the master. As a half-duplex bus, the M-Bus can provide remote power to the slaves, reduce the number of components, and lower the system cost.
The GPRS module enables the communication between the building manager and the remote data center, using the wireless wide area network (WWAN) IP assigned by the GPRS Internet. In this module, the collected data are packaged into TCP/IP packets and transmitted the remote data center via the GPRS Internet; meanwhile, the TCP/IP packets from the remote data center are received, and transmitted to the ASM core module under the RS232 protocol.
3.2 Data acquisition of building manager
3.2.1 Data acquisition hardware
Each building manager can be connected with up to 256 devices via the M-Bus. The manager collects data from the corresponding heat meters every 10min in polling mode. Other functions of the manager include the timing of on-off controllers, adjusting baud rate, and reading meters in real-time.
There are four serial ports on a building manager, namely, COM1, COM2, COM3 and COM4. Among them, COM1 is the port for system debugging, COM2 is the communication port for the GPRS module, COM3 is the port reserved for communication under the RS485 protocol, and COM4 is the communication port for the M-Bus module.
3.2.2 Data acquisition process
In the building manager, the meter reading commands from the data acquisition software, which are originally serial signals, are converted into M-Bus signals by the switching circuit and sent out through COM4, while the feedbacks from the on-off controllers and heat meters are transformed into serial signals by the M-Bus. Then, the serial signals are monitored by the data acquisition software, yielding accurate data from the heat meters. The data are also analyzed by the software, and stored in a special location, marking the end of data acquisition.
The signal transformation is affected by the voltage between the two buses of the M-Bus. This voltage is negatively correlated with the number of devices connected by the M-Bus. If there are too many connected devices, more communication errors may occur due to the excessively low voltage.
3.2.3 Format of information frame
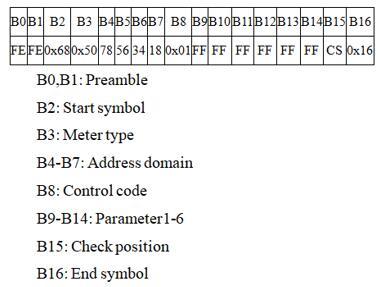
Figure 3. The format of information frame
During the communication of the building manager, each information frame (Figure 3) covers the preamble, the start symbol, the meter type, the address domain, the control code, the control parameters, the check position and the end symbol.
(1) Permeable
The preamble is a 16-bit binary string FEFE at the start of the information frame from the master or a slave.
(2) Start symbol
The start symbol 68H marks the start of the information frame.
(3) Meter type
The data from an on-off controller are marked 50H and those from a heat meter are marked 30H.
(4) Address domain
The unique address of each slave is expressed as a four two-bit binary-coded decimals (BCDs).
(5) Control code
The polling, arrears notification, online test of on-off controller, closing on-off controller, calibration time, baud rate adjustment and start/stop heating are denoted as 01H-07H, respectively.
(6) Control parameters
Each control code has a unique six-bit control parameter. For example, the control parameter for online test of on-off controller 180123152054 means the online test should start at 15:20:54, January 23, 2018.
(7) Check code
The check code is a one-bit reflecting the binary arithmetic accumulation of all the bits from the frame start to the control parameters, excluding the values greater than FFH.
(8) End symbol
The end symbol 16H indicates the end of the information frame.
The responses from slaves and the meter reading commands are both formatted as the six-bit control parameters.
3.3 GPRS wireless transmission
The heat data are transmitted from the building manager to the data center in two steps: the data are transferred from the data acquisition software to the GPRS Internet, and then transmitted via the GPRS Internet to the data center. This highlights the importance of the GPRS module.
To save cost and space, the embedded GPRS module was integrated easily to the building manager, in the light of its small volume and two-row needles. Figure 4 shows the typical wiring diagram of the GPRS module. The various pins in the circuit allow the building manager to exchange data with the GPRS module through serial communication.
Figure 4. The typical wiring diagram of the GPRS module
To establish the communication between the GPRS module and the remote data center, the IP of the remote data center should be configured in the GPRS module. If the remote data center does not have a static IP, the dynamic domain name should be configured instead. Here, the dynamic domain name is resolved by the software Oray. Besides, the SIM (subscriber identification module) card, the user information, the information of the remote data center, the operating parameters must be inserted or configured in the GPRS module, before connecting the module with the remote data center.
4.1 Design of data acquisition software
4.1.1 The workflow of data acquisition
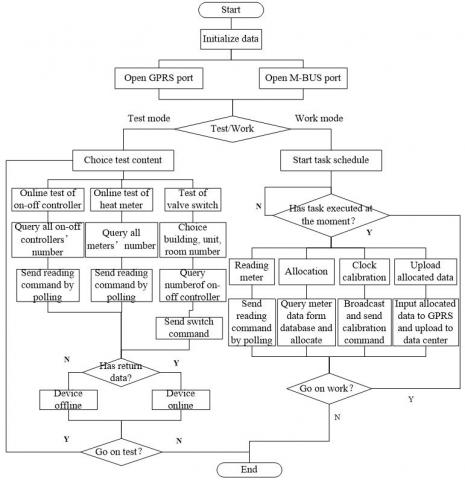
The data acquisition software, which is embedded in the building manager, is the core of the remote meter reading system. The workflow of data acquisition is explained in Figure 5 below.
Figure 5. The workflow of data acquisition
4.1.2 The key functions
The data acquisition software supports six key functions:
(1) Online test
The software tests whether the building manager communicates normally with the corresponding on-off controllers and heat meters, and also controls the valve opening/closing by issuing an opening/closing on/off valve command to on-off controllers.
(2) Timing of meter reading
The software checks if there is any task to be executed in real time. If not, the software will query the list of devices from the database, and send a meter reading command to each device, requiring each device to collect data every 10min in polling mode.
(3) Calculation of allocated heat
The allocated heat, the basic data of the remote meter reading system, is calculated by the software based on the on-off time-area once every hour. The calculation time is scheduled in real time, and the valve cycle is one hour. The total heat allocated Qi (kWh) to user i in the valve cycle can be computed by:
$\mathrm{Q}_{i}=\varepsilon_{i} \cdot S_{i} \cdot \frac{\mathrm{Q}}{\sum_{i=1}^{n} \varepsilon_{i} S_{i}}$ (1)
where, S is the floor area of user I (m2); Q is the total heat in the valve cycle (kWh); n is the number of heat users involved in heat allocation; εi=Δτ'/Δτ is the ratio of valve opening time Δτ' (h) to valve cycle Δτ (h) for user i.
Since the valve cycle Δτ remains constant at 1h, formula (1) can be simplified as:
$\mathrm{Q}_{i}=\frac{H_{i}}{\sum_{i=1}^{n} H_{i}} \cdot \mathrm{Q}, H_{i}=\Delta \tau^{\prime} S_{i}$.
Hence, the heat allocated to each user in each valve cycle was obtained by the above formula. The allocated heats in different cycles were added up to the total allocated heat to that user. Next, the heating cost of the user was derived by multiplying the total allocated heat with the heating coefficient and heat price.
(4) Data upload
The software uploads the allocated heat of each user and the alarm of devices in the last hour to the remote data center. The hourly uploads of user data are scheduled in real time to avoid conflicts with other tasks, while those of alarm data are carried out in real time. Once a field device fails, the heating company will send staff to repair at once.
(5) Query of historical data
Even if the remote data center is not running, the building manager can store offline data for 2 years, including all the allocated heats and the meter readings in the past three months. The stored data can be queried easily on the data acquisition software.
(6) Device replacement
If any on-off controller or heat meter is out of repair, the number of new devices should be inputted to the building manager. Then, the old device will be automatically disabled. This operation can be implemented remotely or on the site. If the remote data center is operating, the replacement can be completed on the configuration interface. If the remote data center is not operating, the replacement can be completed directly on the interface of the data acquisition software.
4.1.3 The import of basic data
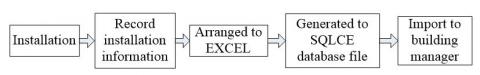
Figure 6 shows how the basic data are acquired and imported to the building manager. The basic data refer to the number of on-off controllers, the number of heat meters, the building number, the device number, the room number, the heating area, etc. Among them, the heating area is an important variable in the calculation of the allocated heat by the on-off time-area method. If it is difficult to measure at the installation, the heating area can be counted and configured remotely when the user opens an account.
Figure 6. The import of basic data
4.1.4 Analysis of meter readings
The building manager allows the addition of new protocols, and could differentiate between existing protocols: the protocol of on-off controllers, the protocol of ultrasonic pressure gauges, the protocol of 8-bit ultrasonic heat meter, and the protocols of heat meters of different brands. As mentioned before, the building manager can be connected to 256 devices and collect data every 10min.
In the data acquisition software, multiple protocols are unified as a single protocol, and big data are converted to a single data for processing. Instead of transmitting and receiving each piece of data, our scheme issues a command, receives the return code and processes the data, before issuing another command.
The poll period of each device was set to 1s. After the period, an error code will be generated if the data reception or processing has not completed. The building manager will remove the data of the device and start to poll another device. Thus, the success or failure of a poll does not affect the next poll, and the error code only impacts the results of the current processing.
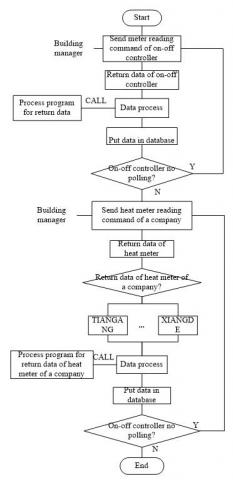
In addition, the data acquisition software adopts the custom event and triggers the meter reading commands after processing the returned data. The whole process is efficient and controllable (Figure 7).
Figure 7. The analysis of meter readings
4.2 Software design of GPRS server
The TCP/IP protocol is adopted for the communication between the GPRS module and the remote data center. The protocol requires a server to monitor IPs and ports, and a client to send data to the IP and port of the server. Taking the GPRS module as the client, a server software was developed for the TCP/IP communication.
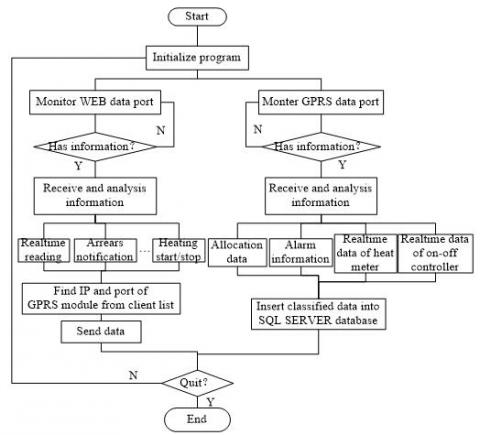
Figure 8. The workflow of GPRS server software
As shown in Figure 8, the GPRS server software is made up of two main modules. One module receives the data uploaded by the GPRS module, classifies the received data, and stores the classified data in the database. The other module forwards commands to the building manager.
The GPRS module uploads four kinds of data: allocated heat, alarms, real-time meter readings and real-time controller readings. To differentiate between these data, the messages were normalized to the following format: data type | building manager number | device number | device type | parameter | end symbol. The end symbol means the data has been processed, waiting to be uploaded; the device number helps to distinguish between real-time meter readings and real-time controller readings; the device type specifies the manufacturer of each device.
4.3 Software design of heating management system
4.3.1 General design
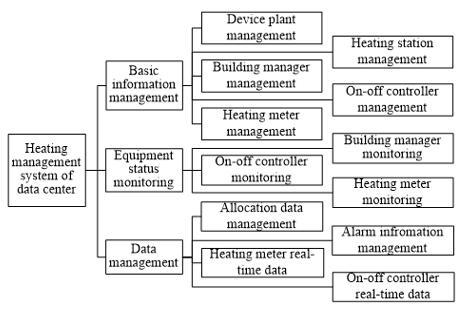
In the remote data center, the heating management system adopts the B/S (browser/server) structure. The users can access the system via the website installed on the server. As shown in Figure 9, the heating management system mainly has three modules: basic information management, device state monitoring and data management.
Figure 9. The components of heating management system
The data management module, as the core of the heating management system, queries the allocated heat to each user on an hourly basis. The real-time data from heat meters are uploaded by the building manager each hour, providing the heating company the actual state of the heating network. The real-time data of on-off controllers are not actively uploaded by the building manager. Any user in need of such data can have a copy of the data, using the reading function of the heating management system. Furthermore, the data management module supports the query of the historical data and alarms of all devices.
4.3.2 Key functions
The heating management system monitors the state of all building managers. If a manager is found offline, the system will notify operators to pay a field visit and check the devices, and to sync the clock of the manager with that of the remote data center. At the start or end of heating, the heating management system issues a start/stop heating command to stop or start the building managers.
The heating management system allows every user to query the allocated heats of all users in each residential community, and export the relevant data. Moreover, the user can query all the historical data of an on-off controller on the data management interface of the system, and export the data to Excel.
This paper puts forward a remote meter reading system for residential heating in northern China. There are five key parts of the system, namely, temperature controllers, on-off controllers, heat meters, building managers and a remote data center. Each part provides several useful functions. For instance, the temperature controllers support the acquisition of room temperature, switch of remote control valve, and display of arrears notification. The heating management system at the remote control center realizes real-time payment, data analysis, data maintenance, arrears notification and real-time meter reading. The building manager facilitates the timing of on-off controllers, adjusting baud rate, and reading meters in real-time.
Our system was successfully applied in many residential communities of Dalian, a port city in northern China. The application results show that our system boasts high efficiency, stability and reliability, despite a simple hardware structure, and that the on-off time-area method can compute allocated heat accurately. Besides, our system has been adopted by Thermo Electron, a major provider of analytical instruments and services, to realize modernized intelligent management of their heating system. To sum up, our system provides the real-time state of the heating system to heat users, heating company and heat meter manufacturers, and offers a good reference for the design of intelligent remote meter reading systems.
[1] Rashidi, H., Khorshidi, J. (2018). Exergy analysis and multiobjective optimization of a biomass gasification based multigeneration system. International Journal of Hydrogen Energy, 43(5): 2631-2644. https://doi.org/10.1016/j.ijhydene.2017.12.073
[2] Wei, D.J., Sun, B., Zhao, F. (2015). Multi-objective optimization design and operation analysis of a small biomass biogas combined cooling heating and power system. Automation of Electric Power Systems 39(12): 7-12. https://doi.org/10.7500/AEPS20141027001
[3] Wang, J.J., Mao, T.Z. (2015). Cost allocation and sensitivity analysis of multi-products from biomass gasification combined cooling heating and power system based on the exergoeconomic methodology. Energy conversion and management, 105: 230-239. https://doi.org/10.1016/j.enconman.2015.07.081
[4] Wen, C.X., Zhou, H.J., Zhang, J.F. (2015). Design of the remote monitoring system of vital sign based on smart phone and mobile Internet. Journal of Biomedical Engineering, 32(1): 86-92.
[5] Prakash, R., Girish, S.V., Ganesh, A.B. (2016). Real-time remote monitoring of human vital signs using internet of things (IoT) and GSM connectivity. In Proceedings of the International Conference on Soft Computing Systems, New Delhi, pp. 47-56. https://doi.org/10.1007/978-81-322-2674-1_5
[6] Girish, S.V., Prakash, R., Ganesh, A.B. (2016). Real-time remote monitoring of indoor air quality using internet of things (IoT) and GSM connectivity. In Artificial intelligence and evolutionary computations in engineering systems, New Delhi, pp. 527-533. https://doi.org/10.1007/978-81-322-2656-7_48
[7] Wang, B., Wu, C., Ge, T. (2014). On the survivability of self-repairing control system for a hybrid underwater vehicle. Journal of Harbin Institute of Technology (New Series), 21(1): 32-42. https://doi.org/10.3969/j.issn.1005-9113.2014.01.005
[8] Li, Y., Bartos, R. (2014). A survey of protocols for intermittently connected delay-tolerant wireless sensor networks. Journal of Network and Computer Applications, 41: 411-423. https://doi.org/10.1016/j.jnca.2013.10.003
[9] Aung, N., Zhang, W., Dhelim, S., Ai, Y. (2018). Accident prediction system based on hidden markov model for vehicular ad-hoc network in urban environments. Information, 9(12): 311-319. https://doi.org/10.3390/info9120311
[10] Qu, Z., Xing, Y., Song, Y. (2018). An image enhancement method based on non-subsampled shearlet transform and directional information measurement. Information, 9(12): 308-311. https://doi.org/10.3390/info9120308
[11] Awata, H., Yachi, T. (2016). Electric power leveling of the microgrid system with PV power generation estimation and power demand estimation. 2016 IEEE International Conference on Renewable Energy Research and Applications (ICRERA), Birmingham, pp. 353-357. https://doi.org/10.1109/ICRERA.2016.7884359
[12] Raju, H.S., Shenoy, S. (2016). Real-time remote monitoring and operation of industrial devices using IoT and cloud. 2016 2nd International Conference on Contemporary Computing and Informatics (IC3I), Noida, pp. 324-329. https://doi.org/10.1109/IC3I.2016.7917983
[13] Worighi, I., Geury, T., El Baghdadi, M., Van Mierlo, J., Hegazy, O., Maach, A. (2019). Optimal design of hybrid PV-Battery system in residential buildings: End-user economics, and PV penetration. Applied Sciences, 9(5): 1022-1041. https://doi.org/10.3390/app9051022
[14] Ferdik, M., Saxl, G., Jesacher, E., Ussmueller, T. (2019). Remote control system for battery-assisted devices with 16 nW standby consumption. Sensors, 19(4): 975-986. https://doi.org/10.3390/s19040975
[15] Lélis, C.A.S., Motta Goulart, R. (2018). A diabetes management information system with glucose prediction. Information, 9(12): 319-334. https://doi.org/10.3390/info9120319
[16] Lakshmanan, S., Kiruthika Devi, S., Nevetha, S.M., Krishnakumaran, V. (2017). Automatic meter reading using GSM via SMS. Proceedings of the International Conference on Intelligent Computing Systems (ICICS 2017–Dec 15th-16th 2017) organized by Sona College of Technology, Salem, Tamilnadu, India, pp. 728-734. https://doi.org/10.2139/ssrn.3141117
[17] Monika, J., Veni, M., Ananth, C. (2015). GSM based automatic electricity billing system. SSRN Electronic Journal, 2(7): 16-21. https://doi.org/10.2139/ssrn.3026891
[18] Mohan, V., Garcia, V.C., Frey, M.L., Ramesh, M.V., Devidas, A.R., Shibu, N.S., Mohan, R., Pokkiyarath, M. (2017). Assessing village power grid problems for development of quality and stable supplemental sustainable energy. 2017 IEEE Global Humanitarian Technology Conference (GHTC), San Jose, CA, pp. 1-10. https://doi.org/10.1109/GHTC.2017.8239299
[19] Thapa, S., Bansal, A.K., Panda, G.K. (2018). Adaptive thermal comfort in the residential buildings of north east India—An effect of difference in elevation. Building Simulation, 11(2): 245-267. https://doi.org/10.1007/s12273-017-0404-x
[20] Udrea, I., Croitoru, C., Nastase, I., Crutescu, R., Badescu, V. (2017). An adaptive thermal comfort model for the romanian climate. Mediterranean Green Buildings & Renewable Energy, 921-930. https://doi.org/10.1007/978-3-319-30746-6_72
[21] Shah, A.S., Nasir, H., Fayaz, M., Lajis, A., Shah, A. (2019). A review on energy consumption optimization techniques in IoT based smart building environments. Information, 10(3): 108-125. https://doi.org/10.3390/info10030108
[22] Talha, M., Saeed, M. S., Mohiuddin, G., Ahmad, M., Nazar, M.J., Javaid, N. (2017). Energy optimization in home energy management system using artificial fish swarm algorithm and genetic algorithm. International Conference on Intelligent Networking and Collaborative Systems, pp. 203-213. https://doi.org/10.1007/978-3-319-65636-6_18
[23] Roh, H.T., Lee, J.W. (2015). Residential demand response scheduling with multiclass appliances in the smart grid. IEEE Transactions on Smart Grid, 7(1): 94-104. https://doi.org/10.1109/TSG.2015.2445491
[24] Yang, J.G., Zhan, N.Y. (2014). The study of heat transfer between adjacent units on household heat metering. Applied Mechanics and Materials, 672: 1519-1523. https://doi.org/10.4028/www.scientific.net/AMM.672-674.1519
[25] Sagani, A., Vrettakos, G., Dedoussis, V. (2017). Viability assessment of a combined hybrid electricity and heat system for remote household applications. Solar Energy, 151: 33-47. https://doi.org/10.1016/j.solener.2017.05.011