Piergiulio Avanzini
OPEN ACCESS
The theory of Panergy states that, within a homogeneous socio-economic environment, for example a nation, there is a complete correspondence between the energy spent to make a product/service and its market price. Panergy is simple way to measure the energy incorporated in any product/system and it can be expressed in units of energy or currency alternately. This equivalence of energy and monetary value is the base to furtherly implement the concept and extend it to a more general equivalence between economy and thermodynamics. Following this attempt, in this document, we have found out that some (not all) economic dynamics follow the laws of thermodynamics exactly as energy systems do. Consequences are, for example, that not only energy can be considered as a currency, but also that the economic value of any object/activity behaves like a thermodynamic gas and that, like in a gas, thermodynamic transformations can describe the effects of economic actions among and inside the social communities. The document contains some references on the theory of Panergy previously published, the theoretical explanation of its generalization towards economy and first discussions on the application of thermodynamic approaches to monetary and economic dynamics.
Panergy, emergy, energy economy, monetary strategy, energetic currency
The Theory of Panergy was promoted by the author in several international conferences and articles. The most recent is reported in reference [1] and is recalled in what follows, but was early presented in the year 2008 [2]. A detailed description of the original discussion is reported in reference [3-4].
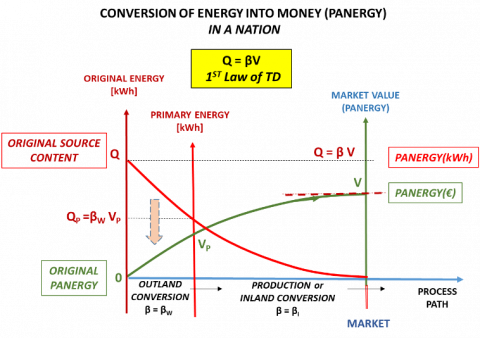
To understand the basics of the theory, refer to Figure 1. It is noted that the economic value of any human activity (production, processes, service or simply living the life) within a defined socio-economic community, at a given time and an actualized monetary value, consists of three main components: Energy directly used (P.E. Primary or usable energy), Intangible Services (I.S. Manpower, Services, Taxes) and Tangible Services (T.S. such as materials and all tangible purchases). As an example, if the object is a simple handicraft product, the three components are Energy, Manpower and Materials.
A second step of the analysis shows that both intangible and tangible contributions consist of three attributions: Again Direct energy (P.E.). Intangible Services (I.S.) and Tangible Services (T.S.). Bringing the reasoning to the extreme consequences (→ ∞) we get a complete equivalence between economic value and energy employed in the activity. The energy corresponding to the monetary value is encompassing of all forms of direct and indirect energy involved in the process. We call it Panerg.
Figure 1. Explication of the theory of Panergy
The energy/money conversion factor β (we call it Specific Panergy) is given by Eq. (1) where Q (expressed in energy units) is the expenditure of Primary Energy and V (expressed in monetary units) is the monetary expenditure in a defined socio-economic context. These two factors correspond to the overall energy consumption and the resulting money expenditure in a defined human context in the considered period.
β=Qv (1)
In more details, β is expressed by Eq. 2.
β=S+BP+F+D=⋅ENERGYEXPENDITURE−(kWh-or toe)MONETARY EXPENDITURE (€) (2)
S is the Primary Energy drown (in any form), B is the agri-food energy expenditure, P is the total cost for living, F are the financial costs and D is the eventual negative result of the overall economic operations; all the above parameters are referred to the community under review.
If the community is a Nation, in a period of a year, the expression for β is explained in Figure 2.
Figure 2. Structure of the Specific Panergy β
In previous works [3, 5-8] β was defined as the energy intensity (or the inverse of the price of primary energy charged to end users in the socio-economic environment in which the product is marketed). The new definition (Eq. 2 and Figure 2) is more extensive: in its dimensioning, contributions are introduced not taken into account in the classical statement of energy intensity. However, as we shall see in the following, the two definitions substantially coincide or differ for negligible quantities.
In official national statistics, TPES is expressed in energy units including import (payed in money, then in currency units). This circumstance facilitates the evaluation of the Specific Panergy β.
Immediate consequence from the considerations above is that knowing the amount of Panergy (in currency units) allows to determine, quickly, the overall embodied energy (not only the direct one) in a product/process/service once its market price is known.
A second relevant consequence is that (national) currency can be expressed in energy units (for example kWh) instead of monetary units (for example €). A currency of this kind is not subject to inflation.
The third very relevant consequence is that money is a form of potential energy (or a form of energy storage), not different from the thermal, mechanical or electrical one and its properties obey to the laws of thermodynamics.
In this work, we use kWh (or somewhere toe) as energy unit because it is more familiar to energy economists and € as currency unit because it is more familiar to the author.
2.1 Conversion of energy into money
The considerations reported above state that money is a form of energy and that the monetary value of a product/process/activity derives from the Panergy embodied during its deployment (see Figure 3).
Figure 3. Conversion of energy into Panergy in products or services
Figure 3 is referred to a conversion process at constant β (in general β is time dependent). Its value depends on the context where the process is exploited; it can be a Nation or a smaller community. In a Nation, the conversion at constant β makes sense because the parameters composing the Specific Panergy are updated every year and during the year β is considered constant. Figure 3 explains how to an Original Energy source (the one associated to fossil fuels stored in geological wells or to a radiant solar source impacting on a surface) initially, corresponds zero economic value because it is potential, then available but not usable; to become usable is necessary to spend energy in order to convert it into Primary Energy (usable). That is actuated, for example, by mining companies, refining industries or solar plant suppliers.
Once the original source is transformed into Primary Energy the process assumes the value of Primary Panergy, the in-house activity begins and Panergy is furtherly increased during the development of the activity, achieving a definitive market value (final Panergy). At the end of this process, the original energy is transformed into money completely. The corresponding Panergy (in monetary units) is usable integrally. In that, the process respects the 1st law of Thermodynamics.
Referring to conversions actuated in a national community, often, for certain sources, the phase of transformation from Original to Primary Energy is made abroad and the related βw is different from the domestic βi.
If is a business company to actuate the conversion, the process is almost the same. In that case β is the ratio between the Panergy consumption of the Business Unit (in kWh) and the sales revenues (in €) of the Unit itself and coincides with the Company productivity. The differences in market price of the products are justified by the different amounts of Panergy spent by any business unit in completing the product.
Figure 4. Conversion of energy to Panergy in business organizations
As a result, the business Specific Panergy βBi, as shown in Figure 4, is different from the context factor βi. The difference between the two values produces the business result.
It appears clear that conversions of Panergy into Money make sense also for pure financial activities.
2.2 Conversion of money into energy
Figure 5 shows, with an example, how Panergy embodied in a product can be picked out and transferred to the agents who use it. Use makes Panergy to degrade and its economic value to decrease. This mechanism of Panergy exchange is a very important property of the energy embodied in a product, otherwise considered not convertible.
Figure 5. Panergy exchanges in the use of consumer goods
Part of the original Panergy is transferred, to environment along the life cycle (energy waste). This is the tangible Panergy (losses, degrade, direct energy…), generally it is expressed in energy units. Another part, the intangible one, that can only be expressed in monetary units (taxes, interests, services and so on), is a transfer of money made available to users for further consumption. Even the loss of value due to deficiency of market demand should be considered inside intangible transfer.
This kind of process, reported on a diagram, is shown in Figure 6. It is an evident confirmation that the conversion of money into energy obeys to the 2nd law of thermodynamics since only a portion of the initial monetary Panergy can be reconverted into convertible new energy (other money).
Figure 6. 2nd law of thermodynamics in conversion of money to energy in a nation
Once the initial economic value V, in subsequent conversions, is spent and the product/service completely used, all the amount of Panergy is released to the environment, in form of waste, and further transformations of it are not allowed (loss of economic value).
That means that the conversion capacity associated to money (as energy) has achieved the maximum allowable potential. We call this property Pantropy since it is the equivalent of entropy in conventional thermodynamics.
In order to understand how Panergy processes behave, another typical example is that of an energy source devoted to the production of usable power (Energy Vector). The diagram of Figure 7, referred to a solar source, describes the Panergy exchanges along the transformation, from origin to production of usable power, and the same can be plotted for fossil sources.
Figure 7. Panergy exchanges in a renewable energy source
All the above considerations lead to conclude that economic dynamics of processes obey to the Laws of Thermodynamics. It could not be otherwise since we have demonstrated that money is a form of energy.
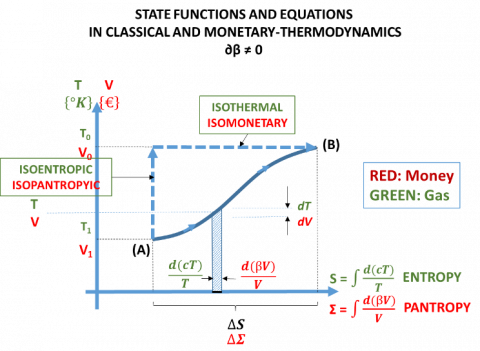
2.3 Panergy dynamics and classical thermodynamics
Looking deeper is possible to draw out a comparison between the quantities and relationships employed in conventional thermodynamics and those referred to Panergy thermodynamics.
In a confined system, the monetary value behaves like a thermodynamic gas. The currency value V is equivalent to the absolute temperature T; Embodied Panergy Q is equivalent to the Internal Energy U; the conversion factor β corresponds to the Specific Heat at constant pressure. Even Entropy has an equivalent in Pantropy.
Table 1. Classical and Panergy thermodynamics
|
Feature |
Classical TD |
Panergy TD |
|
Medium |
Perfect gas (per unit mass) |
Money (per community) |
|
Intensity index |
Abs. Temperature T (K) |
Market Price V (€) |
|
Energy content |
Internal Energy U (kWh) |
Embodied Panergy Q (kWh) |
|
Conversion factor |
Speci. heat cP (kWh/K/kg) |
Spec. Panergy β (kWh/€) |
|
Decay rate |
Heat losses rate dU/t |
Degradation rate dQ/Q |
|
Irreversibility ind. |
Entropy dS =d(cPT)/T (kWh/K) |
Pantropy dΣ=d(βV)/V (kWh/€) |
Figure 8. Equivalence of gas and currency thermodynamics
Figure 8 gives an idea on how a monetary transformation could be represented in a typical functional thermodynamic diagram and how functions can be compared.
Immediate applications of the Panergy methods, in engineering science, are the evaluation of embodied energy in energy products and processes in order to evaluate the ERoEI index (Energy Return on Energy Investment) ad of the residual life of any product or process. Examples of these applications are reported in reference [1].
3.1 National economy and monetary policy
Here we are discussing about a new and interesting application of the Panergy Thermodynamics to Macroeconomy and Monetary Policy.
Let us introduce the concept of thermodynamic currency. As previously seen the economic value of any product or activity can be expressed in energy units. In this sense energy is a currency unit. In an insulated community, if the local currency unit is expressed in terms of energy then Specific Panergy β = 1.
If, after a period of time (for example one year) results β ≠ 1 means that local economy, within the considered period of time has increased or decreased. If it has decreased politically correction have to be introduced to achieve a growth corresponding to the measured degrowth. If it has increased the purchasing power of the local currency has increased and probably no corrections are needed.
Figure 9 shows how, after having detected an economy decrease, measured by the β variation path, a correction strategy can be carried out with the aim to recover the original Panergy value V. It is easy to recognize that the efficiency limit of the complete economic cycle (VT-VA)/VT corresponds to the Carnot limit of efficiency in an equivalent thermodynamic cycle.
Figure 9. Efficiency of a monetary cycle
3.2 An interesting test on a group of EMU countries
Inside a non-homogeneous socio-economic community where partners use a common currency, the real (energetic) monetary value, is different among the various subjects, especially if they have different economy trends despite the currency unit is the same. Single real values can be quite different from the community official currency value assumed as common exchange tool. That is true, in particular, for the Countries of the European Monetary Union (EMU) which use EURO (€) as common currency unit. Table 3 shows the differences among four EMU countries calculated according to the Panergy method, based on official data and referred to the year 2016. The real exchange (thermodynamic) value is reported in the last column.
Table 2 puts in evidence the differences developed in 16 years (since the Maastrich treaty) in the different communities despite the efforts of the EU Commission and Central European Bank to maintain stable the monetary system.
To have monetary stability, real values must not differ too much from the official one (last line of the table). In fact, the UE monetary policy imposes Countries to comply some vital parameters in their annual budgets and to plan appropriate actions in their multi-annual economic forecasts (Fiscal Compact and Maastricht parameters).
Table 2. Real currency value among several EMU countries
|
Year 2016 |
GDP 109 €(2010) |
B 109 kWh |
F+D 109 €(2010) |
TPES 109 kWh |
Q TPES+B kWh |
V GDP +F+D 109 € |
β Q/V kWh/€ |
E βi/β* |
VTh (βiE) kWh |
|
Italy |
1671.6 |
56.40 |
39.28 |
1756.1 |
1812.4 |
1710.9 |
1.059 |
0.839 |
0.888 |
|
France |
2243.0 |
62.22 |
73.05 |
2841.2 |
2903.4 |
2316.0 |
1.253 |
0.993 |
1.244 |
|
Germany |
3130.1 |
76.65 |
3.65 |
3606.5 |
3682.5 |
3133.2 |
1.175 |
0.931 |
1.094 |
|
Spain |
1124.0 |
42.10 |
31.49 |
1393.3 |
1435.4 |
1155.5 |
1.242 |
0.984 |
1.222 |
|
UEM |
10728.0 |
317.30 |
193.5 |
13784.8 |
13784.8 |
10921.9 |
1.262 (β*) |
1.0 |
1.262 |
An Energetic currency value lower than the official one (last row) means less purchasing power compared to the average (you can buy and embody less primary energy per currency unit).
Employing Thermodynamic methodologies can help to evaluate the critical economic parameters year-by-year and Country by Country in order to set up appropriate corrections to the economy trend.
Of course, the thermodynamic method is not able to define how, in detail; the national strategies should be carried out in terms of the parameters on which to operate, as these are the responsibility of administrators and politicians. In fact, once the order of magnitude of the action to undertake is defined a relative weight and a priority must be marked to each parameter according to the perception of the socio-economic needs of the community in which the currency operates.
Anyway, Panergy and Thermodynamics can offer the indications of where parameters are positioned, and measure the single effects of the interventions.
Just for example, coming back to the case of Table 2, if a Country wants to align its real currency value to the official one, as described in Figure 9 (that corresponds to the goal of aligning its economy to those of the other countries), the task consists on the modification of the yearly βi value.
Starting from Eqns. (1) and (2) the expression for β variation is reported in Eq. (3).
∂β=1v[∂Q−β0∂V]=∂Σ−β0∂Vv (3)
Since β is a function of time and time is measured in years, in building up national budgets and in an “n” years forecast, the overall variation of the Specific Panergy is given by Eq. 4.
Δβ=∫n0∂β=|(Q=β0V)[1+ln1v]|n0 (4)
Eq.5 and Eq. 6 give the iso-Pantropic and iso-Monetary components of Eq.4 respectively.
Δβis0Σ=−β0[Vn(1+ln1vn)−V0(1+ln1V0)] (5)
ΔβisoV=ΔΣn0=Qn[1+ln1vn]−Q0[1+ln1V0] (6)
Eq. 7 gives the relative incisiveness of the different parameters of Eq. 2 in achieving ∆β
∂β=∂SV+∂BV−β0(∂pV+∂FV+∂DV) (7)
Table 3. Carnot and real economy growth in 2016 in the sample UEM countries
|
|
β0 (2015) |
β (2016) |
V0 (2015) |
V (2016) |
∆β/β0 |
∆Σ |
Carnot Growth % |
Real Growth % |
η |
|
UEM |
1.237 |
1.262 |
1.237 |
1.262 |
0.0202 |
0.025 |
3.09 |
2.06 |
0.67 |
|
Italy |
1.049 |
1.059 |
0.879 |
0.888 |
0.0095 |
0.010 |
1.25 |
0.93 |
0.74 |
|
France |
1.0234 |
1.253 |
1.225 |
1.244 |
0.0153 |
0.019 |
2.32 |
1.07 |
0.46 |
|
Germ. |
1.153 |
1.174 |
1.073 |
1.094 |
0.0191 |
0.022 |
2.36 |
1.74 |
0.74 |
|
Spain |
1.200 |
1.242 |
1.180 |
1.232 |
0.0350 |
0.042 |
4.95 |
3.43 |
0.69 |
Going back to our sample Countries, applying the above equations to what happened in the year 2016, starting from the values recorded at the end of 2015, one derives fraction of the Carnot economy growths of each Country. They are listed in the last column of Table 3.
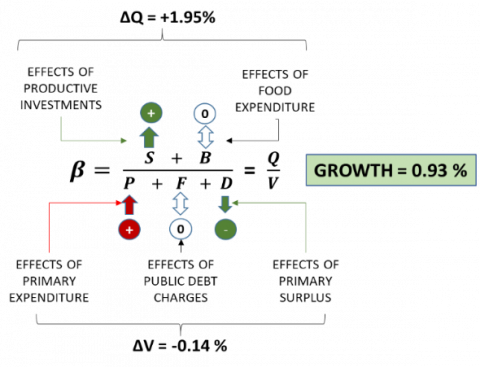
The resulted Growths of Countries are, of course, lower than those reported by official statistics. In addition to the differences among the objectives, even the effectiveness of the maneuvers is different across the Countries. If we look, in particular, at Italy, which is the Country more affected by the 2008 world financial crisis and came from a very low growth in previous year; we can interpret how the maneuver to correct the economy trend has been deployed. The overall transformation can be represented by the succession of two phases: the first one iso-Pantropic and the second one iso-Monetary, as shown in Figure 10. Dotted line represents the real transformation.
As shown in Figure 11, the Growth was achieved by an increase of productive investments while the increase of primary expenditure was balanced by the decrease of financial charges. The primary surplus was slightly positive or near zero.
It is worthwhile to repeat that the thermodynamic method can help, in designing a monetary plan, only to describe the overall process. Decisions on what role have to play parameters, whether they have to be increased or not, what are the economic multipliers of any intervention are the responsibility of the national politicians.
Figure 10. β transform in Italy in 2016
Figure 11. Effects of interventions on Parameters in the economic maneuver in Italy 2016
The title of this chapter probably will be considered as utopia or science fiction and that could be true, but let us leave our fantasy free.
Imagine a global currency based on its energy content. It will not suffer inflation, no devaluation, no exchanges-based speculation.
The Theory of Panergy states that, to objects that have undergone human manipulation, and to each human activity, completed or in progress, correspond an incorporated energy content (Panergy). Part of it (Emergy) can be measured directly during production processes; another part is conferred indirectly through interactions with activities related to the processes themselves. This remaining part can be measured only through the economic value (expressed in energy units) of these interactions. The expansion of the Theory, reported in this work, explains that Panergy can be transformed into money and money is a form of energy storage. When money is spent, Panergy is transferred to the actors of human activities and generate new (less) fresh money and waste energy that can no longer be transformed. That is a classical Thermodynamic behaviour. Therefore, we can conclude that the deployment of the theory of Panergy demonstrates the behavioural equivalence of money and energy. Consequences are:
|
B D ERoEI F GDP P Q S t V |
Agri-food supply/consumption, kWh Budget Deficit, € Ener. Return on Ener.Invest., fraction Financial charge, € Gross Domestic Product, € Product/expenditure of a community, € Total Energy supply/consumption, kWh Primary Energy Supply, kWh Time, y Economic Value/Panergy, € |
|
Greek symbols |
|
|
b |
Specific Panergy, kWh/€ |
|
Σ |
Pantropy or Monetary entropy, kWh/€ |
|
Subscripts |
|
|
isoΣ |
Constant Pantropy |
|
isoV n B T 0 I w |
Constant Economic Value Number of years Business Target Initial Value Inland value Outland value |
[1] Avanzini, P. (2019). A view on economy through thermodynamic glasses (the thermodynamic currency). Tecnica Italiana-Italian Journal of Engineering Science, 63(2-4): 284-290.
[2] Avanzini, P. (2009). Assessment of power generation systems through a novel tool: Panergy. International Journal of Heath and Technology, 27(1): 157-161. https://doi.org/10.18280/ijht.270122
[3] Odum, H.T. (1996). Environmental Accounting: Emergy and Environmental decision making, John Whiley, New York, pp. 370.
[4] Avanzini, P. (2010). Power Generation Technologies Assessment with an Economic Empirical Approach: Panergy. 33rd IAEE int.l Conference - paper 22 - Rio de Janeiro - Brazil.
[5] Avanzini, P. (2010). Energy scenarios and technologies for the 21TH century - Claudio Bertoli Editor - CNR DET - Current Status and Future Trends of Scientific Research 2nd Edition, pp. 3-30. Rome.
[6] ENEA - Efficienza Energetica - Rapporto Annuale - RAEE 2017
[7] IEA - Key World Energy Statistics - 2018
[8] EUROSTAT 2018. databasehttps://ec.europa.eu/eurostat/data/database