
Priyanka R. Gulhane* | Himangi Pande
© 2026 The authors. This article is published by IIETA and is licensed under the CC BY 4.0 license (http://creativecommons.org/licenses/by/4.0/).
OPEN ACCESS
Age-related macular degeneration (ARMD) is a leading cause of irreversible vision impairment among older adults, and optical coherence tomography (OCT) has become an essential imaging modality for retinal assessment. However, manual interpretation of OCT images is time-consuming and subject to inter-observer variability. This study proposes a hybrid Convolutional Neural Network (CNN)-Transformer framework for automated binary classification of OCT images into ARMD and normal categories. The proposed model integrates a ResNet-50 backbone for hierarchical retinal feature extraction with a lightweight Transformer encoder for feature interaction modeling. Experiments were conducted on a private anonymized clinical dataset containing 8,353 OCT images, including 3,061 ARMD images and 5,292 normal images. To address class imbalance and improve training stability, weighted sampling, class-weighted loss, data augmentation, and early stopping strategies were applied. The proposed eight-token Transformer configuration achieved an accuracy of 99.76%, Receiver Operating Characteristic-Area Under the Curve (ROC-AUC) of 0.9999, Matthews Correlation Coefficient (MCC) of 0.9947, sensitivity of 99.65%, and specificity of 99.82% on the held-out test set. Ablation experiments demonstrated that multi-token Transformer refinement provided improved class discrimination compared with the CNN-only baseline. Gradient-weighted Class Activation Mapping (Grad-CAM) visualization further indicated that the model focused mainly on retinal regions associated with classification decisions. Nevertheless, the findings represent image-level performance from a single-center dataset, and further patient-level and external multi-center validation are required before clinical deployment. This study provides a hybrid deep learning (DL) approach for OCT-based ARMD classification and highlights important considerations for reliable evaluation of medical imaging models.
optical coherence tomography, age-related macular degeneration, deep learning, hybrid Convolutional Neural Network-Transformer, medical image classification, retinal imaging
Age-related macular degeneration (ARMD) is a leading cause of irreversible central vision loss in most of the population over the age of 50, creating a substantial socio-economic and quality-of-life burden worldwide. The disease progressively affects the macula, the central part of the retina responsible for sharp, detailed vision, and it appears in two main forms: dry (non-exudative) ARMD, which is associated with drusen deposits and geographic atrophy, and wet (exudative) ARMD, which is characterized by choroidal neovascularization and fluid buildup beneath the retina. Therefore, early and accurate detection of ARMD is essential for timely treatment and to reduce the risk of permanent vision loss.
Optical coherence tomography (OCT) is a non-invasive imaging method that generates high-resolution cross-sectional (B-scan) and three-dimensional images of the retina with micrometer-level precision. OCT is widely used in clinical ophthalmology for the diagnosis and monitoring of ARMD. It enables clinicians to visualize drusen deposits, changes in the retinal pigment epithelium (RPE), and fluid within or beneath the retina. Manual interpretation of OCT images is time-consuming and prone to variability between observers, which makes efficient analysis challenging. This has motivated the development of automated, deep learning (DL)-based analysis systems.
DL has significantly advanced medical image analysis [1]. Convolutional Neural Networks (CNNs), particularly residual networks (ResNets) [2], have demonstrated high performance across various image recognition tasks by learning hierarchical, spatially localized features. Vision Transformers (ViTs), proposed by Dosovitskiy et al. [3], apply the self-attention mechanism originally developed for sequence modeling to image recognition. This approach enables the models to capture the long-range relationships across image patches. A hybrid architecture is built on these advancements and combines convolutional feature extraction with Transformer-based global context modeling. This hybrid architecture has emerged as a promising approach and often works better than using only CNN or only Transformer models in medical imaging tasks.
In retinal OCT analysis, Kermany et al. [4] demonstrated that DL models could classify OCT images into multiple disease categories with good performance, which is close to that of expert clinicians. Similarly, Schlegl et al. [5] demonstrated automated detection and quantification of macular fluid using fully convolutional DL approaches. More recently, Yang et al. [6] proposed an ensemble DL architecture for dry ARMD classification from OCT images, demonstrating the continued development of automated ARMD-specific OCT classification methods. Considering this prior work and leveraging the complementary strengths of CNNs and Transformers, this study proposes and evaluates a hybrid CNN-Transformer model for automated binary classification of OCT images into ARMD and Normal categories.
The main contributions of this study are as follows. First, a lightweight hybrid CNN-Transformer architecture is proposed for binary ARMD classification from OCT images, where ResNet-50 extracts discriminative retinal features and a Transformer encoder refines the learned feature-token relationships. Second, the model is evaluated using clinically relevant metrics including sensitivity, specificity, MCC, Receiver Operating Characteristic-Area Under the Curve (ROC-AUC), PR-AUC, and balanced accuracy. Third, class imbalance is addressed using training-set-only normalization, weighted sampling, and class-weighted loss while preventing validation and test augmentation leakage. Finally, the study discusses practical deployment limitations, including single-center data, scanner variability, patient-wise validation, and the need for external multi-center testing.
2.1 Retinal optical coherence tomography image analysis using deep learning techniques
With continuously growing research in this field, DL techniques have been widely studied and used for the analysis of retinal OCT images. Kermany et al. [4] showed that the InceptionV3 model was able to classify OCT images into multiple disease categories, including choroidal neovascularization, diabetic macular edema, drusen, and normal cases. The model achieved an accuracy of exceeding 96% using thousands of labeled images, demonstrating performance comparable to expert-level clinical assessment. This study showed the feasibility of automated OCT diagnostic systems and motivated research in this domain.
Schlegl et al. [5] introduced a fully automated method for detection and quantification of macular fluid in OCT images. This approach achieved high performance on fluid segmentation tasks. This study demonstrated that DL methods can be applied not only to classification tasks but also to segmentation tasks and to the extraction of quantitative biomarkers from OCT volumes.
Subsequent studies have applied DL methods to OCT analysis for tasks including retinal-layer segmentation, drusen detection, geographic-atrophy measurement, and choroidal-thickness mapping. These applications have consistently shown good performance comparable to those of trained retinal specialists.
Recent studies have further strengthened the application of DL in retinal disease diagnosis. Tayal et al. [7] proposed a DL-CNN-based framework integrated with image preprocessing techniques for retinal disease classification. Their approach demonstrated that combining conventional image enhancement methods with deep convolutional methods improves feature representation and classification. Similarly, Sotoudeh-Paima et al. [8] introduced a multi-scale convolutional neural network for automated ARMD classification using retinal OCT images. By extracting features at different spatial resolutions, their model effectively captured subtle pathological patterns and achieved robust performance in distinguishing ARMD from normal retinal cases. These works reinforce the effectiveness of CNN-based architectures in retinal OCT analysis while also highlighting the importance of multi-scale feature learning.
2.2 Convolutional neural networks: ResNet and variants
He et al. [2] presented deep residual learning for image recognition, proposing the ResNet architecture. This addressed the vanishing gradient problem in very deep networks through skip connections (shortcut paths) that allow information to pass directly across layers. ResNet showed that networks with over 100 layers can be trained successfully and achieved state-of-the-art performance on ImageNet classification. The 50-layer ResNet architecture, created with bottleneck residual blocks, is commonly used in medical image analysis. It is popular for transfer learning because it offers a good balance between model depth, computational efficiency, and the ability to learn important and meaningful features.
Transfer learning with ImageNet pre-trained ResNet backbones has proved effective in medical imaging contexts where labelled training data is not sufficient. As ResNet models are first trained on millions of everyday images, they already learn useful patterns. So, when these pre-trained models are adapted to smaller medical datasets, they can still perform well, even if the medical data is limited.
2.3 Vision Transformers and self-attention
Previous studies [3, 9] introduced the Vision Transformer (ViT). They showed that a Transformer model, which was originally developed for language processing, could also be used for image recognition tasks by dividing images into smaller patches and analyzing them as a sequence. When working with large amounts of data, this approach outperformed older CNN-based methods. The self-attention mechanism in Transformers helps the model to understand relationships between different parts of an image. CNNs are good at capturing fine details, which mainly focus on nearby regions. So, together, CNNs and Transformers help the model to capture both local details and overall context more effectively.
Unlike CNN-based models, pure ViT models require very large pretraining datasets (e.g., JFT-300M) to perform well. In medical imaging, such large annotated datasets are rarely available, which makes using standalone ViT models less practical. To overcome this limitation, a hybrid model was developed that combines the strengths of both methods. CNN feature extraction is used for local pattern recognition, and Transformer layers are used for global context understanding.
2.4 Hybrid Convolutional Neural Network-Transformer architectures in medical imaging
Li et al. [10] provided an overview of CNN-Transformer models used in medical imaging. This study highlighted that combining these two approaches has resulted in improved performance across various tasks such as chest X-ray classification, histopathology image analysis, cardiac Magnetic Resonance Imaging (MRI) segmentation, and retinal image evaluation.
Zhang et al. [11] introduced TranSegNet, combining a lightweight ViT with an enhanced U-Net for retinal OCT segmentation. Jiang et al. [12] proposed HyFormer, which integrates parallel convolutional and Transformer encoders to improve multi-class segmentation performance.
Hemalakshmi et al. [13] developed a SqueezeNet-Vision Transformer (SViT) framework for OCT disease classification, achieving high accuracy with reduced computational complexity. Laouarem et al. [14] presented HTC-Retina, a hybrid CNN-ViT model for multi-label retinal disease classification, demonstrating strong generalization across multiple datasets. Ali et al. [15] introduced ARMDNet23, combining CNNs and recurrent networks for ARMD detection in fundus imagery.
Many researchers have recently developed several models that combine CNNs and Transformers, such as TranSegNet, HyFormer, and HTC-Net. These combined approaches perform better than models that rely only on CNNs or only on Transformers, particularly in tasks like retinal layer segmentation and lesion detection. In many such architectures, CNN layers are used to extract local visual features, after which the resulting representations are provided to Transformer layers to model broader feature interactions. The extracted feature maps are then converted into a sequence format and passed to the Transformer encoder layers. The Transformer helps the model to understand broader relationships across the image and allows it to capture global contextual information more effectively.
Beyond hybrid segmentation frameworks, several studies have explored ensemble and optimization-based strategies to enhance medical image classification.
2.5 Advanced transformer architectures
Recent innovations include Swin-based and hierarchical Transformers designed for efficient vision tasks. He et al. [16] proposed the Swin-Poly Transformer, achieving high classification accuracy through shifted window attention and optimized loss functions. Chen et al. [17] introduced TransUNet, which effectively combines Transformers and U-Net architectures for medical image segmentation. Other notable contributions include UTNet [18] and H2Former [19], both demonstrating improved performance with reduced computational overhead.
2.6 Class imbalance and clinical dataset challenges
In medical imaging, class imbalance is very common, since certain disease conditions are rarer compared to healthy cases in the general population. Class imbalance may result in biased models that achieve high overall accuracy by predominantly predicting the majority class while performing poorly on the minority class. Several approaches can be used to address this imbalance. One method is to assign higher penalties to mistakes made on the minority class by using class-weighted loss functions. Another approach is to increase the samples of the minority class, either by oversampling, for example, using techniques like WeightedRandomSampler in PyTorch, or by reducing the number of samples from the majority class. Additionally, synthetic data augmentation can also be applied to artificially expand the minority class by generating modified versions of existing samples.
The present dataset used in this study contains 3,061 ARMD and 5,292 Normal images, i.e., approximately a 1:1.73 class ratio. To address this imbalance, we applied class-weighted cross-entropy loss along with a WeightedRandomSampler during training. This approach helps to ensure that both classes are represented sufficiently in each batch; this reduces the model’s tendency to bias toward the majority class. As a result, the model is well optimized for clinically important metrics such as sensitivity and specificity.
Recent studies have further investigated DL approaches specifically for ARMD classification using OCT images. Yang et al. [6] proposed an ensemble DL architecture combining ResNet50, EfficientNetB4, MobileNetV3, and Xception for dry ARMD classification from OCT images. Their study demonstrated the potential of combining complementary convolutional architectures for improving ARMD classification performance. A comparative summary of representative OCT-based retinal disease classification studies is presented in Table 1.
Table 1. Comparative summary of related optical coherence tomography (OCT) classification studies
|
Study |
Model |
Task |
Main Contribution |
Limitation |
|
Kermany et al. [4] |
InceptionV3 |
Multi-class retinal disease classification |
Large-scale OCT classification |
Limited explainability |
|
Sotoudeh-Paima et al. [8] |
Multi-scale CNN |
ARMD classification |
Multi-scale feature extraction |
CNN-only architecture |
|
Hemalakshmi et al. [13] |
SViT |
Retinal disease classification |
Hybrid Transformer model |
Limited binary ARMD-specific analysis |
|
Laouarem et al. [14] |
Hybrid CNN-ViT |
Retinal disease classification |
CNN-Transformer fusion |
Multi-label focus |
|
Proposed study |
ResNet-50 + multi-token Transformer |
Binary ARMD classification |
Lightweight feature-token Transformer refinement |
Single-center validation |
3.1 Dataset description
In this study, we used a retrospective clinical dataset collected from a private hospital in Maharashtra, India. The dataset comprised 8,353 anonymized OCT images, including 3,061 ARMD images and 5,292 Normal images. The diagnostic labels associated with the OCT images were based on clinical assessments made by ophthalmologists at the hospital. The dataset predominantly represents patients from Maharashtra.
The presence of bilateral eye images does not imply that both eyes had the same diagnostic status; however, the two images may still share patient-specific characteristics. Therefore, the total number of OCT images does not represent the number of unique patients. Since the dataset was anonymized before the present study and patient identifiers were unavailable, the exact number of unique patients and detailed patient-level demographic information could not be determined.
The OCT images were acquired using an OCT imaging device used as part of routine clinical practice at the hospital. However, detailed information regarding the device manufacturer, model, acquisition protocol, and scanning parameters was not available in the anonymized dataset. These details therefore could not be reliably reported.
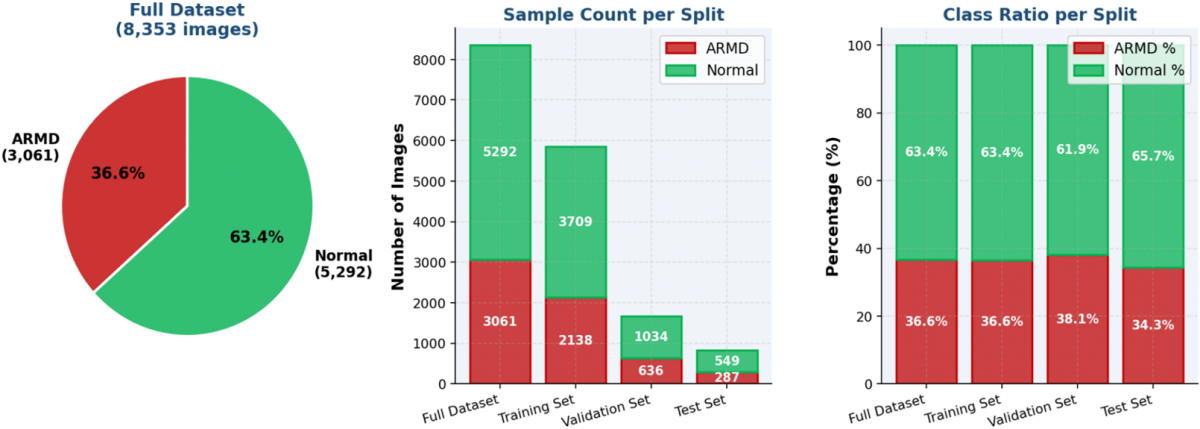
The dataset contained two categories: ARMD and Normal. It included 3,061 ARMD images and 5,292 Normal images, corresponding to a class imbalance ratio of approximately 1:1.73, with a greater number of Normal images, as shown in Figure 1.
Figure 1. Dataset class distribution across splits
Raw OCT frames were stored with dimensions of 875 × 385 pixels. As explained in Section 3.3, the images were first preprocessed and resized to 224 × 224 pixels before being provided to the model for training and evaluation. The dataset was divided into training (70%), validation (20%), and test (10%) sets. The training set included 2,138 ARMD images and 3,709 normal images. The validation set contained 636 ARMD cases and 1,034 normal cases, while the test set consisted of 287 ARMD images and 549 normal images.
To reduce data leakage, normalization statistics were calculated only from the training subset and then applied to validation and test subsets. Data augmentation was applied only during training, while validation and test images used deterministic resizing, center cropping, and normalization. Because OCT images from both the left and right eyes were available for a number of patients, images from the same patient may be present in different dataset splits. Although the two eyes represent distinct anatomical images and may have different disease statuses, they may still share patient-specific characteristics. Since patient identifiers were unavailable after anonymization, patient-wise separation could not be verified. Therefore, the reported results should be interpreted as image-level performance, and the possibility of patient-level correlations across dataset splits cannot be excluded.
Future studies will use patient-level splitting to ensure that images from the same individual are assigned exclusively to one dataset partition.
3.2 Data statistics and augmentation
Per-channel pixel intensity statistics were computed exclusively from the training subset to prevent data leakage into validation and test sets. The computed per-channel means were [0.21867, 0.21869, 0.21866] and standard deviations were [0.13989, 0.13988, 0.13989] across the RGB channels. The near-identical values across channels reflect the grayscale-like nature of OCT imagery.
Training data augmentation was applied to improve generalization and model robustness:
•RandomResizedCrop (output size 224 × 224) to introduce scale and spatial variability.
•RandomHorizontalFlip to introduce spatial variability during training.
•ColorJitter (random perturbations of brightness, contrast, saturation, and hue) to simulate acquisition variability.
•RandomRotation (±15°) to tolerate minor rotational misalignment.
•RandomAffine with translation up to 10% to improve spatial robustness.
Validation and test sets employed deterministic transforms only: Resize (256) followed by CenterCrop (224), and normalization using the training-set statistics. This ensured that validation and test performance were evaluated without stochastic augmentation effects.
3.3 Model architecture: Hybrid Convolutional Neural Network-Transformer
The proposed hybrid CNN-Transformer consists of three sequential components: a CNN backbone for local feature extraction, a Transformer encoder for global context modeling, and a classification head.
3.3.1 CNN backbone (ResNet-50)
The backbone employs a ResNet-50 pre-trained on ImageNet (ResNet50_Weights.DEFAULT), with the original final fully connected layer replaced by an identity mapping. This configuration outputs a 2,048-dimensional feature vector per input image, encoding hierarchical representations of local structural patterns from the retinal OCT frame. The ResNet-50 backbone was fine-tuned end-to-end during training.
3.3.2 Transformer encoder
The resulting 2,048-dimensional feature vector was projected through a learned linear layer and reshaped into a sequence of eight feature tokens, each with 256 dimensions. This produced an input representation of shape (batch size, 8, 256) for the Transformer encoder. To investigate the effect of Transformer tokenization, we performed an additional ablation study by varying the number of Transformer input tokens while keeping the remaining training settings unchanged. Specifically, four tokenization configurations (1, 4, 8, and 16 tokens) were evaluated using the same training, validation, and test datasets. Among these configurations, the eight-token model was selected as the final configuration based on its overall validation and test performance.
Unlike a single-token Transformer representation, the multi-token design allows the self-attention mechanism to model dependencies among different subspaces of the extracted CNN feature representation. The Transformer encoder consisted of four encoder layers, eight attention heads, a feed-forward dimension of 512, and dropout of 0.3. The encoded tokens were flattened and passed to the final classification layer for binary ARMD/Normal prediction.
3.3.3 Classification head
The eight encoded tokens, each with 256 dimensions, were flattened to form a 2,048-dimensional representation. This representation was passed to a linear classification layer producing two logits corresponding to the ARMD and Normal classes. During training, class-weighted CrossEntropyLoss was applied using inverse frequency weighting computed from the training class distribution to further mitigate class imbalance.
3.4 Training protocol and hyperparameters
All experiments were conducted on a CPU-only computing environment (no GPU available). Training hyperparameters were configured as follows:
•Optimizer: Adam with learning rate lr = 1 × 10⁻⁵ and weight decay = 1 × 10⁻⁵.
•Learning rate scheduler: StepLR with step_size = 3 epochs and decay factor gamma = 0.1 (LR reduced at epochs 3, 6, 9, 12, ...).
•Batch size: 32.
•Maximum epochs: 15 with early stopping (patience = 5) monitoring validation loss.
•Class balancing: WeightedRandomSampler used during training to oversample the ARMD minority class.
•Class-weighted loss: CrossEntropyLoss with inverse frequency weights (USE_CLASS_WEIGHTS = True).
•Reproducibility: The primary experiment used a fixed random seed of 42 for reproducibility. In addition, the final eight-token configuration was evaluated across five random seeds (7, 21, 42, 100, and 123) to assess performance stability.
Early stopping monitored the validation loss and saved model weights corresponding to the lowest validation loss encountered (best_model.pth). At the end of training, the best weights were restored for evaluation, ensuring the reported performance corresponds to the optimal checkpoint rather than the final training epoch.
To measure the performance of the proposed hybrid CNN-Transformer model, multiple evaluation metrics were employed. Since medical diagnosis involves clinical risk considerations, relying solely on accuracy is insufficient. Therefore, additional performance indicators were used to evaluate classification reliability, class balance, and robustness.
4.1 Accuracy
Accuracy measures the proportion of correctly classified samples among all predictions:
$\text { Accuracy }=\frac{\text { Correct Predictions }}{\text { Total Predictions }}$
Although accuracy provides a general performance estimate, it may be misleading in imbalanced datasets, where a model can achieve high accuracy by favoring the majority class.
4.2 Precision, recall, and F1-score
Precision quantifies the proportion of correctly predicted positive cases among all predicted positives, while recall (sensitivity) measures the proportion of correctly identified positive cases among all actual positives.
$\text { F1 }- \text { Score }=2 \times \frac{\text { Precision × Recall }}{\text { Precision }+ \text { Recall }}$
The F1-score represents the harmonic mean of precision and recall, providing a balanced measure when class distribution is uneven. In medical diagnosis tasks such as ARMD detection, the F1-score is particularly important because it reflects the trade-off between false positives and false negatives.
4.3 Sensitivity (recall)
Sensitivity measures the ability of the model to correctly identify ARMD cases:
$\text { Sensitivity }=\frac{T P}{T P+F N}$
High sensitivity is critical in clinical screening systems, as missing a diseased case (false negative) may delay treatment.
4.4 Specificity
Specificity evaluates the model’s ability to correctly identify normal cases:
$\text { Specificity }=\frac{T N}{T N+F P}$
A high specificity ensures that healthy patients are not incorrectly diagnosed as diseased, reducing unnecessary follow-up procedures.
4.5 Balanced accuracy
Balanced accuracy is defined as the average of sensitivity and specificity:
$\text { Balanced accuracy }=\frac{\text { Sensitivity }+ \text { Specificity }}{2}$
This metric compensates for class imbalance and provides a more reliable estimate of classification performance when class distribution is skewed.
4.6 Matthews Correlation Coefficient
The MCC is a robust metric that considers true and false positives and negatives. It provides a correlation value between predicted and actual classes, ranging from −1 (complete disagreement) to +1 (perfect prediction). MCC is particularly suitable for imbalanced datasets and is widely recommended for medical classification tasks.
4.7 Receiver Operating Characteristic-Area Under the Curve
The ROC-AUC evaluates the model’s ability to discriminate between classes across various threshold values. A value close to 1 indicates excellent separability between ARMD and normal cases.
4.8 Precision-Recall Area Under the Curve
The Precision-Recall Area Under the Curve (PR-AUC) focuses on performance for the positive class and is especially useful in imbalanced datasets where the minority class is clinically significant.
4.9 Weighted cross-entropy loss
To address class imbalance during training, a weighted cross-entropy loss function was used:
$\mathcal{L}_{C E}=-\frac{1}{N} \sum_{i=1}^N w_{y_i} \log \mathrm{p}\left(y_i \mid x_i\right)$
where,
N is the total number of samples,
$w_{y_i}$ is the weight assigned to class $y_i$,
$p\left(y_i \mid x_i\right)$ is the predicted probability for the true class.
By assigning higher weights to the minority class (ARMD), the model is penalized more heavily for misclassifying clinically important cases, leading to improved sensitivity and balanced performance.
5.1 Training dynamics
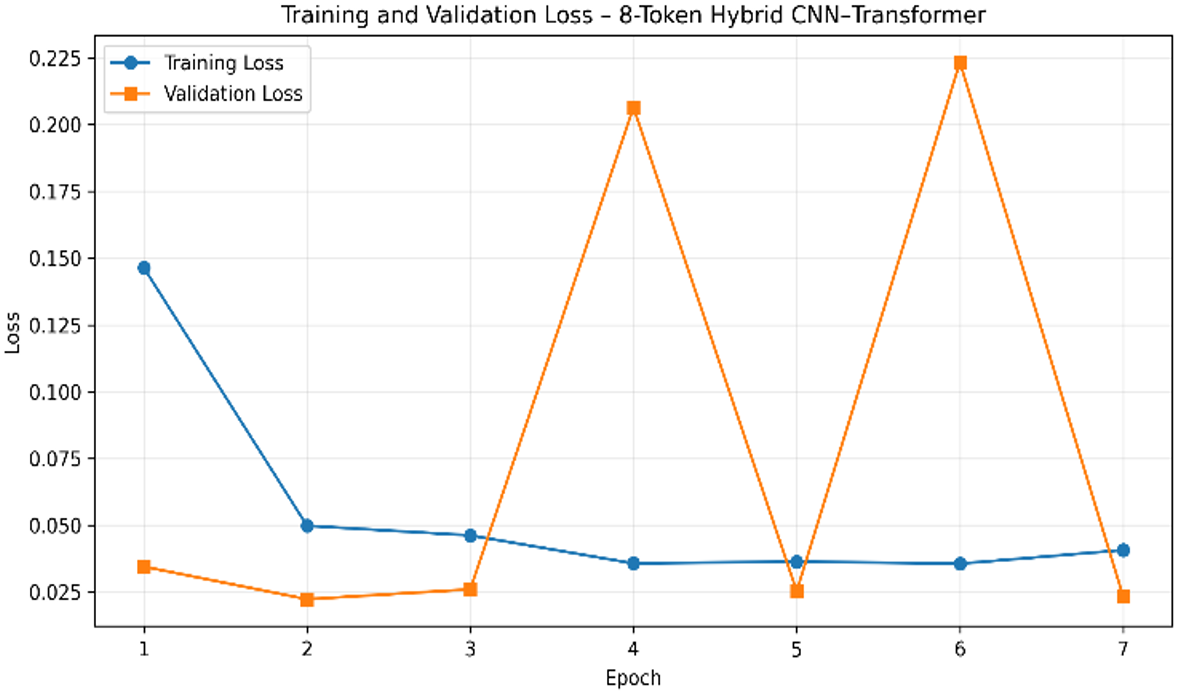
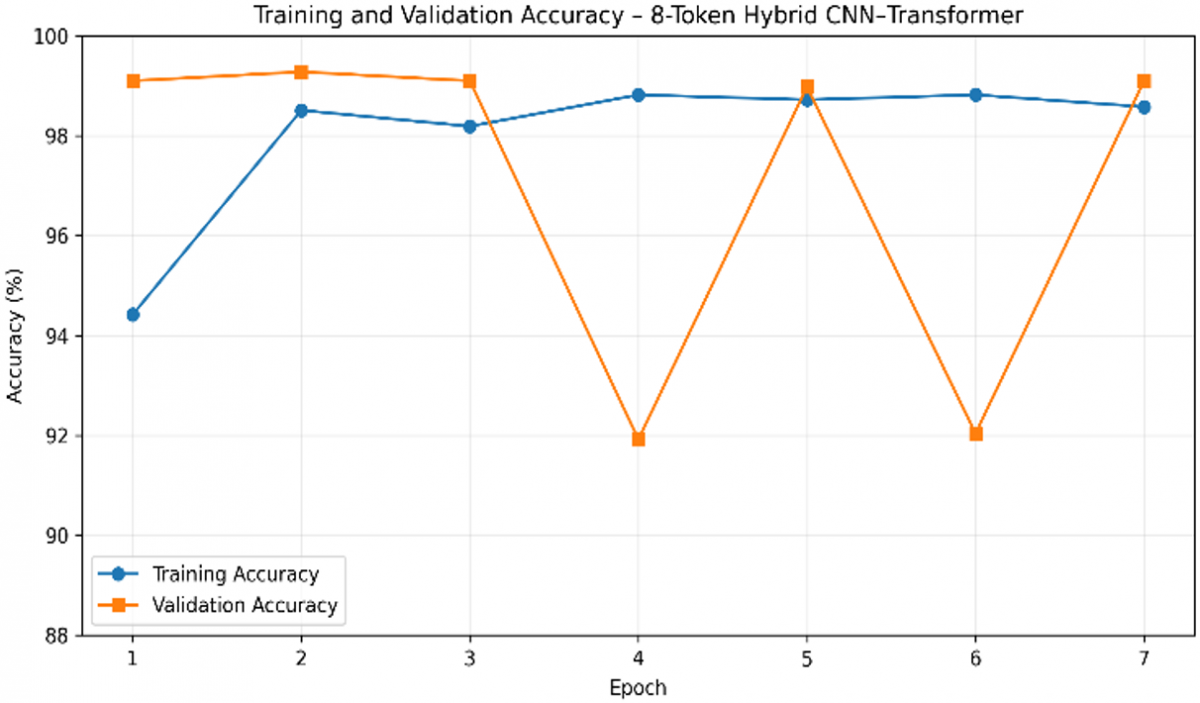
The model was trained for a maximum of 15 epochs, with early stopping used to limit overfitting. Training terminated at epoch 7. As shown in Figure 2 and Figure 3, the lowest validation loss of 0.0223 and the corresponding validation accuracy of 99.28% were achieved at Epoch 2. Although temporary increases in validation loss were observed at Epochs 4 and 6, the validation performance recovered in the subsequent epochs. Early stopping was triggered at Epoch 7, and the model parameters from Epoch 2 were restored for final evaluation. The restored checkpoint was then evaluated on the held-out test set.
The comprehensive performance results of the final eight-token hybrid CNN-Transformer are presented in Table 2. The model achieved a test accuracy of 99.76%, balanced accuracy of 99.73%, MCC of 0.9947, ROC-AUC of 0.9999, sensitivity of 99.65%, and specificity of 99.82%. These results represent the final experimental configuration used for the main performance evaluation. The multi-token representation was adopted to provide multiple feature tokens for self-attention rather than relying on a single feature token.
Figure 2. Eight-token training and validation loss
Figure 3. Eight-token training and validation accuracy over epochs
Table 2. Comprehensive model performance of revised multi-token hybrid CNN-Transformer
|
Metric |
Validation Set |
Test Set |
|
Accuracy |
0.9928 |
0.9976 |
|
ROC-AUC |
0.9997 |
0.9999 |
|
PR-AUC |
0.9998 |
1.0000 |
|
Sensitivity |
0.9874 |
0.9965 |
|
Specificity |
0.9961 |
0.9982 |
|
F1-Score Macro |
0.9924 |
0.9973 |
|
Balanced Accuracy |
0.9918 |
0.9973 |
|
MCC |
0.9848 |
0.9947 |
|
Loss |
0.0223 |
0.0134 |
5.2 Effect of Transformer tokenization
The influence of Transformer tokenization was evaluated by varying the number of learned feature tokens while keeping the CNN backbone, Transformer depth, optimizer, and training protocol unchanged. The comparative results for the four tokenization configurations are presented in Table 3. The experimental results indicate that increasing the number of tokens from one to eight improved classification performance, while further increasing the number of tokens to sixteen did not provide additional improvement.
The single-token configuration produced the lowest test accuracy (99.40%). Because only one token is provided to the encoder, the opportunity for self-attention to model interactions among multiple feature tokens is inherently limited. Increasing the number of tokens to four improved the classification performance (99.52%), while the proposed eight-token configuration achieved the highest overall balance between accuracy, MCC, sensitivity, and specificity.
Although the sixteen-token configuration achieved the same overall test accuracy (99.76%), it did not produce meaningful improvement over the proposed eight-token design while introducing additional computational complexity. Therefore, the eight-token configuration was selected as the final architecture because it provides an effective trade-off between model complexity and classification performance.
Table 3. Performance comparison across token configurations
|
Tokens |
Validation Accuracy |
Test Accuracy |
MCC |
ROC-AUC |
|
1 |
0.9910 |
0.9940 |
0.9868 |
0.9999 |
|
4 |
0.9946 |
0.9952 |
0.9894 |
0.9999 |
|
8 (Proposed) |
0.9928 |
0.9976 |
0.9947 |
0.9999 |
|
16 |
0.9934 |
0.9976 |
0.9947 |
1.0000 |
5.3 Confusion metrics
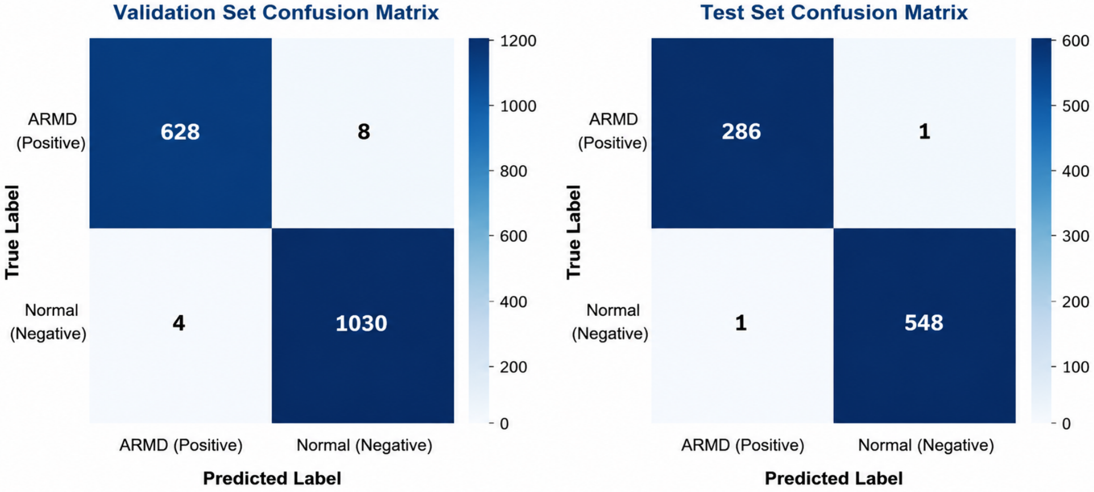
As shown in Figure 4, the revised multi-token hybrid CNN-Transformer model produced strong classification performance on both validation and test sets. On the validation set, the model correctly classified 628 ARMD cases and 1,030 Normal cases, with 8 ARMD cases misclassified as Normal and 4 Normal cases misclassified as ARMD. On the held-out test set, the model correctly classified 286 ARMD cases and 548 Normal cases, with only one misclassification in each class.
Figure 4. Confusion matrices: validation set (left) and test set (right)
5.4 Explainability analysis using Gradient-weighted Class Activation Mapping
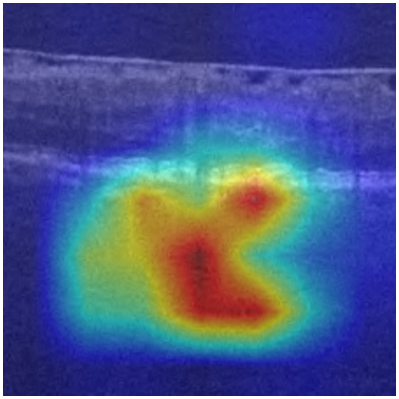
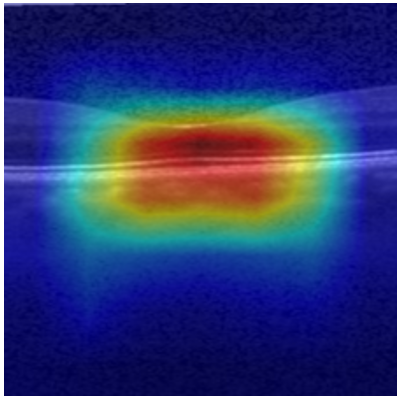
To investigate the interpretability of the proposed model, Gradient-weighted Class Activation Mapping (Grad-CAM) [20] was applied to representative OCT images using the ResNet-50 feature extraction backbone. The resulting heatmaps provide a qualitative indication of the image regions that contributed most strongly to the model's classification decisions. Representative Grad-CAM visualizations for ARMD and Normal OCT images are presented in Figures 5 and 6, respectively. In the representative examples, the highlighted regions are predominantly located around retinal and macular structures rather than image-background regions. These observations provide qualitative evidence that the model uses anatomically relevant image regions for its predictions. However, the Grad-CAM analysis was not independently assessed by ophthalmologists. Therefore, these visualizations should be interpreted as qualitative interpretability evidence rather than formal clinical validation.
5.5 Architectural ablation study
To evaluate the contribution of the proposed Transformer-based refinement mechanism, an architectural ablation study was conducted by comparing the revised hybrid CNN-Transformer model with a ResNet-50-only baseline under identical preprocessing, augmentation, balancing, and training conditions. The comparative results are presented in Table 4. The ResNet-only baseline replaced the Transformer encoder with a standard fully connected classification layer while preserving the same ResNet-50 feature extractor.
The proposed eight-token hybrid CNN-Transformer achieved slightly higher test accuracy than the ResNet-50-only baseline. Although both models achieved strong classification accuracy, the Transformer-enhanced architecture achieved higher MCC than the ResNet-50-only baseline, indicating a modest improvement in class-wise discrimination. These findings indicate that the multi-token Transformer primarily provides additional feature refinement and contextual interaction beyond the CNN representation rather than producing a substantial increase in overall accuracy.
Table 4. Architectural ablation table
|
Tokens |
Validation Accuracy |
Test Accuracy |
MCC |
ROC-AUC |
|
ResNet-50 (CNN-only) |
0.9898 |
0.9964 |
0.9921 |
1.0000 |
|
Hybrid (1 token) |
0.9910 |
0.9940 |
0.9868 |
0.9999 |
|
Hybrid (4 tokens) |
0.9946 |
0.9952 |
0.9894 |
0.9999 |
|
Hybrid (8 tokens) |
0.9928 |
0.9976 |
0.9947 |
0.9999 |
|
Hybrid (16 tokens) |
0.9934 |
0.9976 |
0.9947 |
1.0000 |
5.6 Statistical validation across random seeds
To evaluate the robustness of the proposed hybrid CNN-Transformer model, five independent training experiments were performed using different random seeds (7, 21, 42, 100, and 123), while maintaining an identical dataset split and training protocol. Only stochastic training components, including parameter initialization, data shuffling, and augmentation randomness, were varied. The test-set performance obtained for each random seed is presented in Table 5. These experiments assess training variability under a fixed image-level data partition and should not be interpreted as cross-validation, patient-level validation, or external validation.
Table 5. Performance obtained with different training random seeds
|
Seed |
Accuracy |
Balanced Accuracy |
MCC |
ROC-AUC |
|
7 |
0.9952 |
0.9964 |
0.9895 |
0.9999 |
|
21 |
0.9988 |
0.9991 |
0.9974 |
1.0000 |
|
42 |
0.9940 |
0.9938 |
0.9867 |
0.9998 |
|
100 |
0.9988 |
0.9991 |
0.9974 |
0.9999 |
|
123 |
0.9976 |
0.9973 |
0.9947 |
0.9999 |
Table 6. Statistical summary across five random seeds table
|
Metric |
Mean |
SD |
95%CI |
|
Accuracy |
0.9969 |
0.0022 |
(0.9942, 0.9996) |
|
Balanced Accuracy |
0.9971 |
0.0022 |
(0.9944, 0.9999) |
|
MCC |
0.9931 |
0.0048 |
(0.9872, 0.9991) |
|
ROC-AUC |
1.0000 |
0.0001 |
(0.9999, 1.0000) |
The proposed model demonstrated relatively consistent performance across the five random seeds. The mean test accuracy was 99.69% (SD = 0.22%), while the mean balanced accuracy reached 99.71% (SD = 0.22%). Similarly, the MCC remained consistently high (0.9931 ± 0.0048), and ROC-AUC remained at approximately 1.0 across the five experiments. The corresponding 95% confidence intervals across the five seed-level estimates are reported in Table 6. The relatively small variability across random seeds indicates consistent optimization behavior under the fixed dataset partition. However, these results do not assess variability across patient populations, independent data partitions, or external datasets.
6.1 Interpretation of results
The hybrid CNN-Transformer model achieved high performance on both the validation and test sets, demonstrating the effectiveness of the proposed architecture for OCT-based ARMD detection. The validation accuracy of 0.9928 and ROC-AUC of 0.9997 indicate strong discrimination on unseen validation data, with only 12 misclassifications out of 1,670 validation samples. For ARMD as the positive class, the validation sensitivity was 0.9874, while the specificity was 0.9961. On the held-out test set, the model achieved an accuracy of 0.9976 and ROC-AUC of 0.9999, with ARMD sensitivity of 0.9965 and specificity of 0.9982. The high image-level sensitivity observed in this dataset indicates that the model missed relatively few ARMD images. However, because the study was conducted at the image level without verified patient-wise separation, this result should not be interpreted as evidence of clinical screening sensitivity.
Though the test results show good performance across all evaluation metrics, these findings should be interpreted with care. A more detailed analysis is provided in the next section. The observed performance is consistent with the complementary roles of convolutional feature extraction and Transformer-based feature interaction, with the CNN capturing local retinal structures and the multi-token Transformer modeling relationships among different feature subspaces.
The revised multi-token Transformer representation improved the theoretical validity of the self-attention mechanism compared to the earlier single-token design. By dividing the CNN feature embedding into multiple learned tokens, the Transformer encoder was able to model relationships across different feature subspaces rather than acting only as a projection layer. The experimental results indicate that the revised architecture maintained strong classification performance while providing a more meaningful Transformer-based contextual refinement mechanism.
In addition, repeated experiments using five different random seeds showed low performance variation under the same image-level dataset partition, indicating relatively consistent training behavior. However, this analysis does not substitute for cross-validation, patient-level validation, or external validation.
Furthermore, the architectural ablation experiments indicate that the multi-token representation contributes to the observed performance differences among the evaluated configurations. Compared with the single-token configuration, the proposed eight-token architecture consistently achieved higher accuracy and MCC, indicating that self-attention becomes more effective when multiple learned feature tokens are available. Increasing the number of tokens beyond eight produced only marginal improvement, suggesting that the proposed configuration provides a suitable balance between representational capacity and computational complexity.
6.2 Clinical relevance
The proposed model achieved very high sensitivity (0.9874 on validation and 0.9965 on the test set), showing that it was able to correctly identify the majority of ARMD images. High sensitivity is desirable in screening-oriented applications because missed disease cases can have important clinical consequences. However, the present study did not evaluate clinical screening performance. The specificity values (ranging from 0.9961 to 0.9982) were also consistently high. The high specificity indicates a low false-positive rate within the evaluated image-level test set. However, the impact of this performance on clinical workload or referral decisions was not evaluated in the present study.
Within the scope of the present dataset, the model demonstrated strong image-level classification performance for distinguishing ARMD from Normal OCT images. However, its suitability as a clinical screening tool cannot be established from the current study because patient-wise separation and external clinical validation were not performed. The model may serve as a basis for future investigation of automated OCT image classification; however, its clinical utility, generalizability, and patient-level diagnostic performance require evaluation on independently collected, patient-level and multi-center datasets before any clinical application can be considered.
Although the proposed model achieved very high test performance, including near-perfect classification on the held-out test set, these results should be interpreted cautiously. The dataset was collected retrospectively from a single private hospital and predominantly represents patients from Maharashtra, India. OCT images from both eyes were available for a number of patients, while patient identifiers were unavailable because of anonymization. Therefore, patient-wise separation could not be verified, and images from the same patient may have been distributed across different splits. In addition, detailed information regarding patient demographics and the specific OCT device model and acquisition parameters was unavailable. External validation using independent datasets from different patient populations, institutions, OCT devices, and acquisition protocols was not performed. Therefore, the reported results represent internal image-level classification performance and should not be interpreted as evidence of patient-level clinical generalizability.
The proposed work demonstrates strong image-level classification performance using a hybrid architecture combining ResNet-50 with a multi-token Transformer encoder for binary classification of OCT images into ARMD and Normal categories. During the training process, class balancing, data augmentation, and the use of weighted loss functions were implemented to address dataset imbalance. To reduce model overfitting and enhance the generalization of the model, early stopping was implemented.
The architectural ablation study showed that the eight-token configuration achieved improved performance relative to the single-token configuration and a modest improvement over the CNN-only baseline. The experimental comparison of 1, 4, 8, and 16-token configurations indicates that the proposed eight-token design achieves an effective balance between classification performance and model complexity.
The final eight-token hybrid CNN–Transformer achieved an accuracy of 0.9928 and ROC-AUC of 0.9997 on the validation set, while achieving an accuracy of 0.9976, ROC-AUC of 0.9999, MCC of 0.9947, sensitivity of 0.9965, and specificity of 0.9982 on the held-out test set. The results indicate that the eight-token CNN-Transformer configuration can provide strong image-level ARMD classification performance, while offering additional feature refinement over the CNN-only representation. Further evaluation on independent, multi-center datasets is necessary before considering clinical deployment.
To improve the model’s reliability, this research can be further expanded based on the results obtained in this study.
8.1 External validation and multi-center studies
Testing the model on OCT images obtained from multiple hospitals, patient populations, and imaging devices will help assess performance variability associated with institutional, population, and acquisition differences. This type of evaluation is necessary to understand the model’s accuracy across diverse populations and imaging systems.
8.2 Multi-class and severity grading
This work can also be extended to multi-class disease classification and to identify the severity grading of disease, such as early, intermediate, and late ARMD, which will enhance its clinical value. Developing such a model would allow detection of ARMD along with its progression level. In the future, we plan to develop models that will be capable of identifying ARMD and also estimating its severity stage, using detailed clinical labels obtained from ophthalmology specialists.
8.3 3D volume-level classification
In clinical practice, OCT scans are generally acquired as three-dimensional datasets consisting of a series of B-scan slices. Current models analyze the individual 2D OCT images, which may overlook important structural relationships between adjacent slices of images. In the future, more advanced models can be designed to process complete 3D OCT volumes instead of only 2D images. Full 3D volume analysis will allow the model to capture structural continuity across images and improve the reliability of diagnosis. Additionally, application of an attention mechanism across sequential B-scans may help to identify gradual retinal changes that are commonly associated with the progression of ARMD.
8.4 Expert-validated explainability
Future work will extend the current qualitative Grad-CAM analysis through expert evaluation by ophthalmologists. Expert-annotated retinal and pathological regions can be used to quantitatively assess the spatial agreement between model-generated explanations and clinically relevant structures. Such evaluation would provide stronger evidence regarding the clinical interpretability and reliability of the proposed model.
[1] Litjens, G., Kooi, T., Bejnordi, B.E., et al. (2017). A survey on deep learning in medical image analysis. Medical Image Analysis, 42: 60-88. https://doi.org/10.1016/j.media.2017.07.005
[2] He, K.M., Zhang, X.Y., Ren, S.Q., Sun, J. (2016). Deep residual learning for image recognition. In 2016 IEEE Conference on Computer Vision and Pattern Recognition (CVPR), Las Vegas, NV, USA, pp. 770-778. https://doi.org/10.1109/CVPR.2016.90
[3] Dosovitskiy, A., Beyer, L., Kolesnikov, A., et al. (2020). An image is worth 16×16 words: Transformers for image recognition at scale. arXiv preprint arXiv:2010.11929. https://doi.org/10.48550/arXiv.2010.11929
[4] Kermany, D.S., Goldbaum, M., Cai, W.J., et al. (2018). Identifying medical diagnoses and treatable diseases by image-based deep learning. Cell, 172(5): 1122-1131. https://doi.org/10.1016/j.cell.2018.02.010
[5] Schlegl, T., Waldstein, S.M., Bogunovic, H., et al. (2018). Fully automated detection and quantification of macular fluid in OCT using deep learning. Ophthalmology, 125(4): 549-558. https://doi.org/10.1016/j.ophtha.2017.10.031
[6] Yang, J.K., Wu, B., Wang, J., et al. (2024). Dry age-related macular degeneration classification from optical coherence tomography images based on ensemble deep learning architecture. Frontiers in Medicine, 11: 1438768. https://doi.org/10.3389/fmed.2024.1438768
[7] Tayal, A., Gupta, J., Solanki, A., Bisht, K., Nayyar, A., Masud, M. (2023). Correction to: DL-CNN-based approach with image processing techniques for diagnosis of retinal diseases. Multimedia Systems, 29: 3971. https://doi.org/10.1007/s00530-021-00791-9
[8] Sotoudeh-Paima, S., Jodeiri, A., Hajizadeh, F., Soltanian-Zadeh, H. (2022). Multi-scale convolutional neural network for automated AMD classification using retinal OCT images. Computers in Biology and Medicine, 144: 105368. https://doi.org/10.1016/j.compbiomed.2022.105368
[9] Vaswani, A., Shazeer, N., Parmar, N., et al. (2017). Attention is all you need. In 31st Conference on Neural Information Processing Systems (NIPS 2017), Long Beach, CA, USA, pp. 1-11. https://proceedings.neurips.cc/paper_files/paper/2017/file/3f5ee243547dee91fbd053c1c4a845aa-Paper.pdf.
[10] Li, J., Chen, J.Y., Tang, Y.C., Wang, C., Landman, B.A., Zhou, S.K. (2023). Transforming medical imaging with Transformers? A comparative review of key properties, current progresses, and future perspectives. Medical Image Analysis, 85: 102762. https://doi.org/10.1016/j.media.2023.102762
[11] Zhang, Y.H., Li, Z.L., Nan, N., Wang, X.Z. (2023). TranSegNet: Hybrid CNN-Vision Transformers encoder for retina segmentation of optical coherence tomography. Life, 13(4): 976. https://doi.org/10.3390/life13040976
[12] Jiang, Q.X., Fan, Y., Li, M.H., et al. (2024). HyFormer: A hybrid transformer-CNN architecture for retinal OCT image segmentation. Biomedical Optics Express, 15(11): 6156-6170. https://doi.org/10.1364/BOE.538959
[13] Hemalakshmi, G.R., Murugappan, M., Sikkandar, M.Y., Begum, S.S., Prakash, N.B. (2024). Automated retinal disease classification using hybrid transformer model (SViT) using optical coherence tomography images. Neural Computing and Applications, 36: 9171-9188. https://doi.org/10.1007/s00521-024-09564-7
[14] Laouarem, A., Kara-Mohamed, C., Bourennane, E.B., Hamdi-Cherif, A. (2024). HTC-retina: A hybrid retinal diseases classification model using transformer-Convolutional Neural Network from optical coherence tomography images. Computers in Biology and Medicine, 178: 108726. https://doi.org/10.1016/j.compbiomed.2024.108726
[15] Ali, M.A., Hossain, M.S., Hossain, M.K., Sikder, S.S., Khushbu, S.A., Islam, M. (2024). AMDNet23: Hybrid CNN-LSTM deep learning approach with enhanced preprocessing for age-related macular degeneration (AMD) detection. Intelligent Systems with Applications, 21: 200334. https://doi.org/10.1016/j.iswa.2024.200334
[16] He, J.Z., Wang, J.X., Han, Z.Y., Ma, J., Wang, C.J., Qi, M. (2023). An interpretable transformer network for retinal disease classification using optical coherence tomography. Scientific Reports, 13: 3637. https://doi.org/10.1038/s41598-023-30853-z
[17] Chen, J.N., Lu, Y.Y., Yu, Q.H., et al. (2021). TransUNet: Transformers make strong encoders for medical image segmentation. arXiv preprint arXiv:2102.04306. https://doi.org/10.48550/arXiv.2102.04306
[18] Gao, Y., Zhou, M., Metaxas, D.N. (2021). UTNet: A hybrid transformer architecture for medical image segmentation. Lecture Notes in Computer Science, 12903: 61-71. https://doi.org/10.1007/978-3-030-87199-4_6
[19] He, A., Wang, K., Li, T., Du, C.K., Xia, S., Fu, H.Z. (2023). H2Former: An efficient hierarchical hybrid transformer for medical image segmentation. IEEE Transactions on Medical Imaging, 42(9): 2763-2775. https://doi.org/10.1109/TMI.2023.3264513
[20] Selvaraju, R.R., Cogswell, M., Das, A., Vedantam, R., Parikh, D., Batra, D. (2017). Grad-CAM: Visual explanations from deep networks via gradient-based localization. In Proceedings of the IEEE International Conference on Computer Vision (ICCV), Venice, Italy, pp. 618-626. https://doi.org/10.1109/ICCV.2017.74