
Armedy Ronny Hasugian | Achmad Shidiq | Rini Sasanti | Hilal H. Nuha* | Bagus Setyoboedi | Ernie Setyawati | Yusri Dianne Jurnalis | Ade Rachmat Yudiyanto | Nuraini Irma Susanti | Irwan Priyanto | Hassan Rizky Putra Sailellah | Harimat Hendarwan
© 2026 The authors. This article is published by IIETA and is licensed under the CC BY 4.0 license (http://creativecommons.org/licenses/by/4.0/).
OPEN ACCESS
Acute hepatitis of unknown aetiology (AHUA) represents a challenging condition for retrospective machine-learning analysis because confirmed cases are rare and routinely collected clinical data are incomplete. This study performed an exploratory multicentre evaluation of machine-learning models for classifying probable AHUA among paediatric patients in Indonesia. A total of 289 retrospective records from five hospitals were analyzed, including five probable AHUA cases, 163 hepatitis cases, and 121 non-hepatitis cases. A leakage-controlled preprocessing pipeline was applied, excluding administrative and outcome-related variables, removing highly incomplete features, and restricting Synthetic Minority Over-sampling Technique for Nominal and Continuous (SMOTENC) application to training folds only. Six classifiers were compared using stratified five-fold cross-validation, repeated partition analysis, and site-held-out robustness assessment. Random Forest achieved the highest overall point estimates, with an accuracy of 85.12% and macro F1-score of 57.25%; however, all models failed to identify the five probable AHUA cases, resulting in 0% target sensitivity. Repeated evaluations demonstrated unstable model rankings across different data partitions, while site-held-out analysis reduced Random Forest accuracy to 69.90%. Probability-based evaluation further indicated insufficient reliability for estimating target-class risk. SHapley Additive exPlanations (SHAP) analysis was therefore interpreted only as a description of model behaviour rather than evidence of clinical determinants. These findings highlight the limitations of machine-learning modelling under extreme rare-event conditions and emphasise the need for larger prospectively adjudicated cohorts and independent external validation before clinical application.
acute hepatitis of unknown aetiology, machine learning, rare-event classification, paediatric patients, clinical prediction modelling, retrospective multicentre study
Acute hepatitis of unknown aetiology (AHUA) was reported internationally in 2022 as acute non-A-E hepatitis with markedly increased aminotransferases in children after exclusion of established causes [1]. By 26 May 2022, the World Health Organization had received reports of 650 probable cases from 33 countries [2], while Indonesia reported 18 suspected cases across several provinces [3]. Early clinical series showed heterogeneous presentations and, in a minority of children, severe liver injury requiring intensive care or liver transplantation [4, 5].
The aetiology remains incompletely resolved. Clinical updates and paediatric hepatology guidance emphasise the need for careful exclusion of established causes and uniform documentation of virology, biochemical abnormalities, symptoms, and outcomes [6, 7]. Molecular investigations have reported associations with adeno-associated virus 2, adenovirus, helper-virus coinfection, and host susceptibility, but these findings do not provide a simple retrospective classification rule [8-10].
Machine-learning analysis of rare clinical outcomes is methodologically difficult because small event counts limit the stability of training, validation, and interpretation [11, 12]. In clinical prediction research, small samples, incomplete-data handling, and inadequate validation are common sources of bias [13], while probability calibration is essential if predicted probabilities are interpreted as risks [14]. Moreover, retrospective in silico evaluation should not be conflated with live clinical evaluation of an AI decision-support system [15]. Recent studies provide useful methodological examples of explainability and imbalance handling [16, 17], but they are not clinical evidence for acute hepatitis.
This study does not claim a new learning algorithm or a validated clinical decision-support system. Its contribution is an exploratory retrospective investigation that: (1) analyses a multicentre Indonesian paediatric cohort with expert-assigned labels; (2) compares six classifiers using leakage-free evaluation; (3) examines the instability created by only five target cases using repeated cross-validation and site-held-out robustness analysis; (4) evaluates out-of-fold probability reliability; and (5) uses SHapley Additive exPlanations (SHAP) only as a post-hoc description of model behaviour. Reporting was revised with reference to TRIPOD+AI and PROBAST+AI principles [18, 19].
Clinical reports of paediatric AHUA describe gastrointestinal symptoms, jaundice, marked aminotransferase elevation, and variable progression to acute liver failure [4-7]. Molecular studies suggest that the 2022 syndrome may be heterogeneous rather than a single aetiological entity [8-10]. Consequently, a retrospective model trained on routinely documented hospital records should be regarded as an exploratory classification experiment rather than an aetiological or clinically validated screening model.
Extreme Gradient Boosting (XGBoost) is effective for nonlinear tabular data because sequentially fitted trees minimise a regularised objective [20]. SMOTE and its mixed-data extension, Synthetic Minority Over-sampling Technique for Nominal and Continuous (SMOTENC), generate minority samples from neighbouring observations [21], but synthetic balance cannot create the biological diversity that is absent from a very small target cohort. SHAP can describe how a fitted model uses recorded variables, but it does not establish clinical causation [22]. Appropriate validation requires clear separation between internal assessment, site-held-out robustness checks, and independent external validation [23]. Trustworthy clinical deployment would additionally require prospective evaluation, monitoring, and governance beyond the scope of this retrospective study [15, 24].
3.1 Study design and data source
This retrospective multicentre study used 289 records of patients with hepatitis or suspected hepatitis collected from Fatmawati General Hospital, Sulianti Saroso Infectious Disease Hospital, H. Adam Malik General Hospital, Dr Soetomo General Academic Hospital, and Dr M. Djamil Hospital. Records were identified using hepatitis-related ICD-10 codes. The original extraction criteria included age below 18 years and jaundice or an AST/ALT increase exceeding three times the local upper reference limit. Records with liver cancer, hepatic cirrhosis, hepatic coma, drug-induced hepatitis, or materially incomplete diagnostic documentation were excluded. The available variables covered demographics, symptoms, physical findings, hospitalization, complete blood counts, aminotransferases, bilirubin fractions, albumin, renal function, and electrolytes. Appendix Table A1 defines every extracted field, its coding or unit, and its modelling role. Appendix Table A2 reports the outcome distribution by hospital.
3.2 Outcome definition and ground truth
Ground-truth annotation was performed directly by the authoring health-expert team. The team comprised health-domain specialists from the National Research and Innovation Agency of Indonesia (BRIN) together with clinical representatives from each of the five participating hospitals, all of whom had relevant expertise in evaluating paediatric hepatitis and related clinical presentations. Labels were assigned retrospectively from the available medical records by considering the recorded final diagnosis together with demographic, clinical, and laboratory findings. Three final categories were used: probable AHUA, hepatitis, and non-hepatitis. The distribution of clinical outcome classes in the original cohort is presented in Table 1. The five records in the target category therefore represent expert-assigned clinical labels rather than labels generated by the machine-learning procedure.
The labels were established before model development and remained unchanged throughout preprocessing, over-sampling, training, and evaluation. The WHO outbreak definition [1] was used as clinical context rather than a claim that every retrospectively labelled record satisfied every prospective surveillance element. The study did not employ a prospectively predefined blinded duplicate-rating protocol, and formal inter-rater agreement statistics were not recorded; this is acknowledged as an important limitation because only five records belong to the target class.
Table 1. Outcome-class distribution in the original cohort
|
Outcome Class |
n |
% |
|
Probable unknown hepatitis |
5 |
1.73 |
|
Hepatitis |
163 |
56.40 |
|
Non-hepatitis |
121 |
41.87 |
|
Total |
289 |
100.00 |
3.3 Data preparation and leakage control
Patient identifier, hospital, and final diagnosis were excluded from the predictor matrix. Four variables with more than 80% missingness (band neutrophils, segmented neutrophils, prothrombin time, and globulin) were removed, leaving 59 candidate predictors. Non-numeric laboratory tokens were converted to missing values. Within each training fold, numeric values were median-imputed, and categorical values were mode-imputed. Categorical levels were encoded from the training data only; unseen test categories were retained as unknown levels. Scaling was applied only to algorithms that required it.
3.4 Class imbalance and model comparison
The original study centred on XGBoost. In the corrected exploratory comparison, XGBoost was retained alongside five alternative classifiers. At boosting iteration t, a tree ft is added by minimising the regularised objective [20]:
$\begin{gathered}\mathcal{L}^{(\mathrm{t})}=\Sigma_{\mathrm{i}} \ell\left(y_{\mathrm{i}}, \hat{y}_{\mathrm{i}}^{(\mathrm{t}-1)}+f_{\mathrm{t}}\left(x_{\mathrm{i}}\right)\right)+\Omega\left(f_{\mathrm{t}}\right), \\ \Omega\left(f_{\mathrm{t}}\right)=\gamma T+1 / 2 \lambda \Sigma_{\mathrm{i}} w_{\mathrm{i}}^2\end{gathered}$ (1)
For the three-class outcome, the data-fitting term was multiclass logarithmic loss, where $y_{i c}$ is the indicator for class $c$ and $p_{i c}$ is the corresponding predicted probability:
$\operatorname{LogLoss}=-(1 / N) \sum_{\mathrm{i}} \sum y_{\mathrm{i}} \log \left(p_{\mathrm{i}}\right)$ (2)
Class imbalance was handled with SMOTENC [21]. For numerical components, a synthetic observation is generated between minority sample $x_i$ and one of its nearest minority neighbours $x_z$:
$x_{\mathrm{ne}} w=x_{\mathrm{i}}+\delta\left(x_{\mathrm{z}}-x_i\right), 0 \leq \delta \leq 1$ (3)
Categorical components were handled by SMOTENC rather than interpolated as continuous values. The controlled comparison additionally included Random Forest and Gradient Boosting as tree-ensemble alternatives, an RBF support-vector machine and logistic regression as nonlinear-margin and linear baselines, and distance-weighted K-Nearest Neighbors (KNN). KNN used Euclidean distance:
$d\left(x_{\mathrm{i}}, x_{\mathrm{j}}\right)=\sqrt{ }\left[\Sigma_{\mathrm{m}}\left(x_{\mathrm{im}}-x_{\mathrm{jm}}\right)^2\right]$ (4)
Table 2. Model configurations used in the controlled comparison
|
Model |
Configuration |
|
Random Forest |
200 trees; max depth 6; minimum leaf 2 |
|
Gradient Boosting |
100 trees; learning rate 0.05; max depth 2 |
|
XGBoost |
200 trees; learning rate 0.05; max depth 3; min child weight 2; subsample and column sample 0.8; L1 0.1; L2 1 |
|
SVM |
RBF kernel; C = 1; gamma = scale |
|
Logistic regression |
C = 1; L-BFGS; maximum 3,000 iterations |
|
KNN |
k = 5; distance weighting; Euclidean distance |
Note: XGBoost = Extreme Gradient Boosting, KNN = K-Nearest Neighbors, SVM = Support Vector Machine.
SMOTENC was applied only to the training portion of each fold, with k_neighbors = 2, sampling_strategy = "not majority", and fold-specific random states. Each training fold contained four probable unknown cases. SMOTENC increased this class from four to 130 or 131 records, producing 126–127 synthetic unknown-class observations per fold; the non-hepatitis class received 33–35 synthetic observations. Test folds contained original patients only. Six classifiers were evaluated on the same folds and preprocessing outputs. The fixed configurations in Table 2 were chosen to provide a controlled comparison rather than an exhaustive search on a very small minority class.
3.5 Validation and evaluation
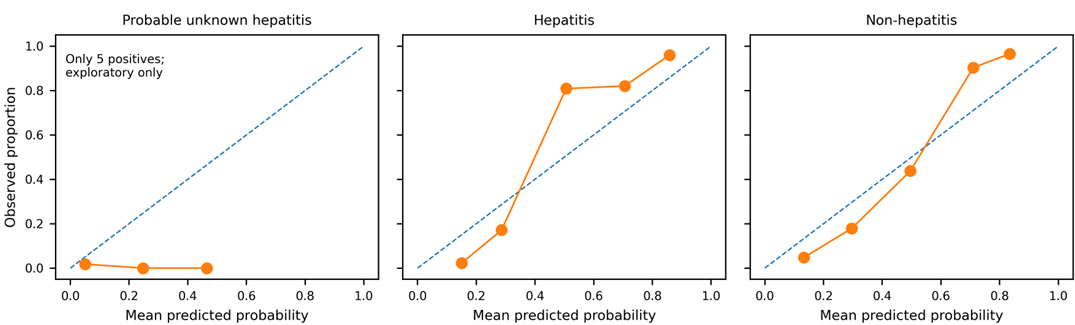
Primary evaluation used stratified five-fold cross-validation with shuffling and random_state = 42. Because there were exactly five probable unknown cases, each test fold contained only one target case. Out-of-fold predictions were pooled so that every patient contributed once to the primary confusion matrix. The five individual folds were also reported to show variability. To examine partition sensitivity, the complete five-fold procedure was repeated five times using different shuffle seeds. These repeated analyses were used descriptively; model ordering was not treated as evidence of superiority. A leave-one-hospital-out site-held-out robustness analysis was performed separately and was explicitly not interpreted as external validation [23]. Probability reliability for the three tree-based models was assessed from out-of-fold predicted probabilities using multiclass Brier score and multiclass log loss [14]. Exploratory one-vs-rest reliability plots for Random Forest are shown in Figure 1.
Because conventional accuracy is dominated by the two common classes, balanced accuracy and macro F1 were treated as principal discrimination summaries. Class-specific precision $P_c$ and sensitivity $R_c$ were also reported. For probability reliability, the multiclass Brier score was calculated as $B S=\frac{1}{N} \sum_{i=1}^N \sum_{c=1}^C\left(p_{i c}-y_{i c}\right)^2$, where $p_{i c}$ is the predicted probability and $y_{i c}$ is the one-hot outcome indicator; lower values indicate smaller squared probability error. With only five target events, target-class calibration was considered too sparse for reliable calibration slope or intercept estimation.
$P_c=\frac{T P_c}{T P_c+F P_c}, \quad R_c=\frac{T P_c}{T P_c+F N_c}$ (5)
Balanced Accuracy $=\frac{1}{C} \sum_{c=1}^C R_C$ (6)
Macro F1 $=\frac{1}{C} \sum_{c=1}^C \frac{2 P_c R_c}{P_c+R_c}$ (7)
3.6 Post-hoc model-behavior analysis
For post-hoc model-behavior analysis, TreeSHAP values were calculated from a Random Forest refitted to the complete cleaned dataset. One-hot feature contributions were aggregated to their source variables. Because the fitted models had 0% sensitivity for the target class, SHAP values were not interpreted as explanations of probable unknown hepatitis and were not presented as clinical biomarkers. They were used only to describe how the fitted model behaved across the full three-class dataset, which was dominated by hepatitis and non-hepatitis records.
TreeSHAP represents an individual model output as an additive feature-attribution model, where φ₀ is the baseline output, and φⱼ is the contribution assigned to feature j [22]:
$g\left(z^{\prime}\right)=\varphi_0+\Sigma_{\mathrm{j}=1}{ }^{\mathrm{M}} \varphi_{\mathrm{j}} z_{\mathrm{j}}^{\prime}$ (8)
4.1 Descriptive five-fold evaluation
Table 3 presents pooled out-of-fold point estimates from the primary five-fold split. Random Forest had the highest accuracy (85.12%), balanced accuracy (57.55%), macro F1 (57.25%), and weighted F1 (84.67%), followed by Gradient Boosting and XGBoost on several overall metrics. These values are descriptive and should not be interpreted as evidence that Random Forest is clinically superior, because every model had 0% sensitivity for the target class and each test fold contained only one target case.
Table 3. Five-fold out-of-fold performance (%)
|
Model |
Accuracy |
Balanced Accuracy |
Macro F1 |
Weighted F1 |
Target Sensitivity |
|
Random Forest |
85.12 |
57.55 |
57.25 |
84.67 |
0.00 |
|
Gradient Boosting |
82.70 |
56.12 |
55.87 |
82.58 |
0.00 |
|
XGBoost |
82.35 |
55.84 |
55.51 |
82.10 |
0.00 |
|
SVM |
79.24 |
53.22 |
53.44 |
79.15 |
0.00 |
|
Logistic Regression |
74.74 |
50.49 |
50.96 |
75.40 |
0.00 |
|
KNN |
68.51 |
45.74 |
48.82 |
72.41 |
0.00 |
Note: XGBoost = Extreme Gradient Boosting, KNN = K-Nearest Neighbors, SVM = Support Vector Machine.
4.2 Cross-validation stability
Across the five primary folds, Random Forest accuracy ranged from 79.31% to 91.38% and macro F1 from 53.83% to 61.40%; every fold contained one target case, and the target sensitivity was 0% in every fold. Repeating the complete five-fold procedure five times produced the summary in Table 4. Random Forest had the highest macro F1 in three repetitions and XGBoost in two, showing that model ordering was not invariant to the partition seed. More importantly, target sensitivity remained 0% for every model across all repeated evaluations.
Table 4. Repeated five-fold stability analysis across five partition seeds
|
Model |
Accuracy Mean ± Standard Deviation (%) |
Macro F1 Mean ± Standard Deviation (%) |
Target Sensitivity (%) |
|
Random Forest |
84.08 ± 0.88 |
56.45 ± 0.55 |
0.00 |
|
Gradient Boosting |
83.11 ± 1.05 |
55.94 ± 0.68 |
0.00 |
|
XGBoost |
81.52 ± 1.06 |
54.98 ± 0.70 |
0.00 |
|
SVM |
78.06 ± 2.26 |
53.04 ± 1.31 |
0.00 |
|
Logistic Regression |
75.43 ± 2.38 |
51.23 ± 1.63 |
0.00 |
|
KNN |
68.65 ± 2.43 |
49.58 ± 1.32 |
0.00 |
Note: XGBoost = Extreme Gradient Boosting, KNN = K-Nearest Neighbors, SVM = Support Vector Machine.
4.3 Class-specific performance
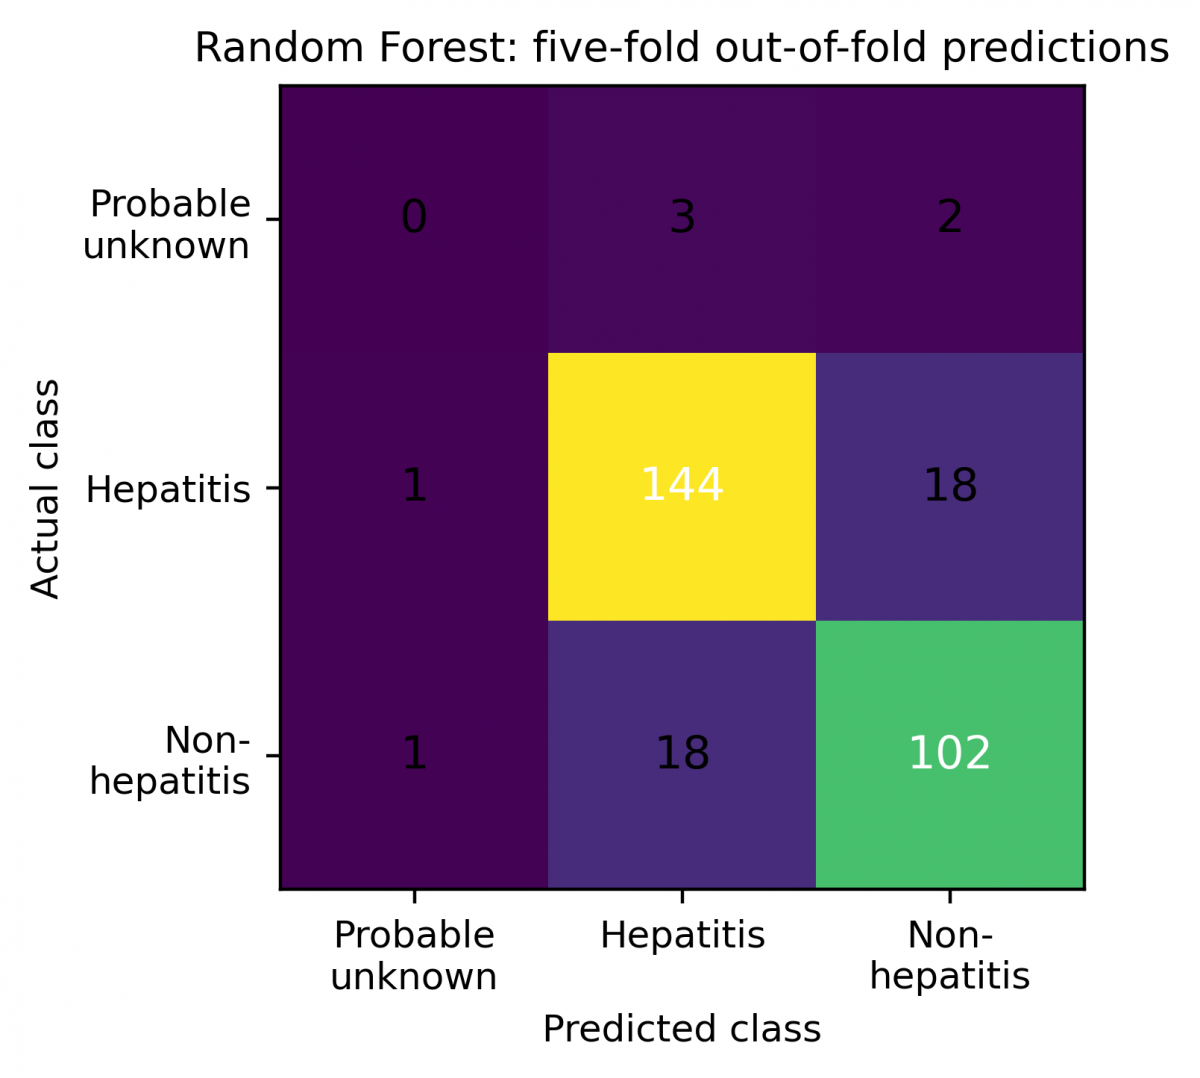
For the primary split, Random Forest correctly classified 144 of 163 hepatitis records and 102 of 121 non-hepatitis records, but none of the five probable unknown cases (Figure 2). Three target cases were classified as hepatitis and two as non-hepatitis. Sensitivity was 88.34% (95% CI 82.40–92.83%) for hepatitis and 84.30% (95% CI 76.57–90.27%) for non-hepatitis. For the probable unknown class, precision, sensitivity, and F1 were all 0%; the exact 95% confidence interval for sensitivity was 0–52.18%. The wide interval and one-positive-per-fold structure make the target sensitivity estimate intrinsically unstable, although all five target records were missed when held out.
Figure 2. Random Forest out-of-fold confusion matrix for the primary five-fold split
4.4 Probability reliability
Out-of-fold probability metrics are reported in Table 5. The three tree models had lower overall multiclass Brier scores and log loss than a prevalence-only baseline; however, all had a worse target-class Brier score than the prevalence-only target probability. For Random Forest, the mean predicted probability of the target class was 3.40% among the five actual target cases and 6.13% among non-target cases. Figure 1 similarly shows that the target-class reliability curve is too sparse for meaningful calibration inference. These probabilities must not be interpreted as clinically calibrated risk estimates.
Table 5. Exploratory out-of-fold probability reliability
|
Model |
Multiclass Brier |
Log Loss |
Target-Class Brier |
|
XGBoost |
0.2600 |
0.4946 |
0.0244 |
|
Gradient Boosting |
0.2708 |
0.5028 |
0.0281 |
|
Random Forest |
0.2775 |
0.5159 |
0.0239 |
|
Prevalence-only baseline |
0.5063 |
0.7577 |
0.0170 |
Note: XGBoost = Extreme Gradient Boosting.
4.5 Site-held-out robustness analysis
When each hospital was held out in turn, Random Forest accuracy decreased to 69.90%, balanced accuracy to 45.99%, and macro F1 to 45.77%. No target case was detected. Two hospitals contained no probable unknown cases, and the remaining three contained only one or two. All hospitals were from the same Indonesian healthcare context. Accordingly, this analysis is reported only as a site-held-out robustness check and not as external validation or evidence of transportability to other healthcare systems.
4.6 Post-hoc model-behavior analysis
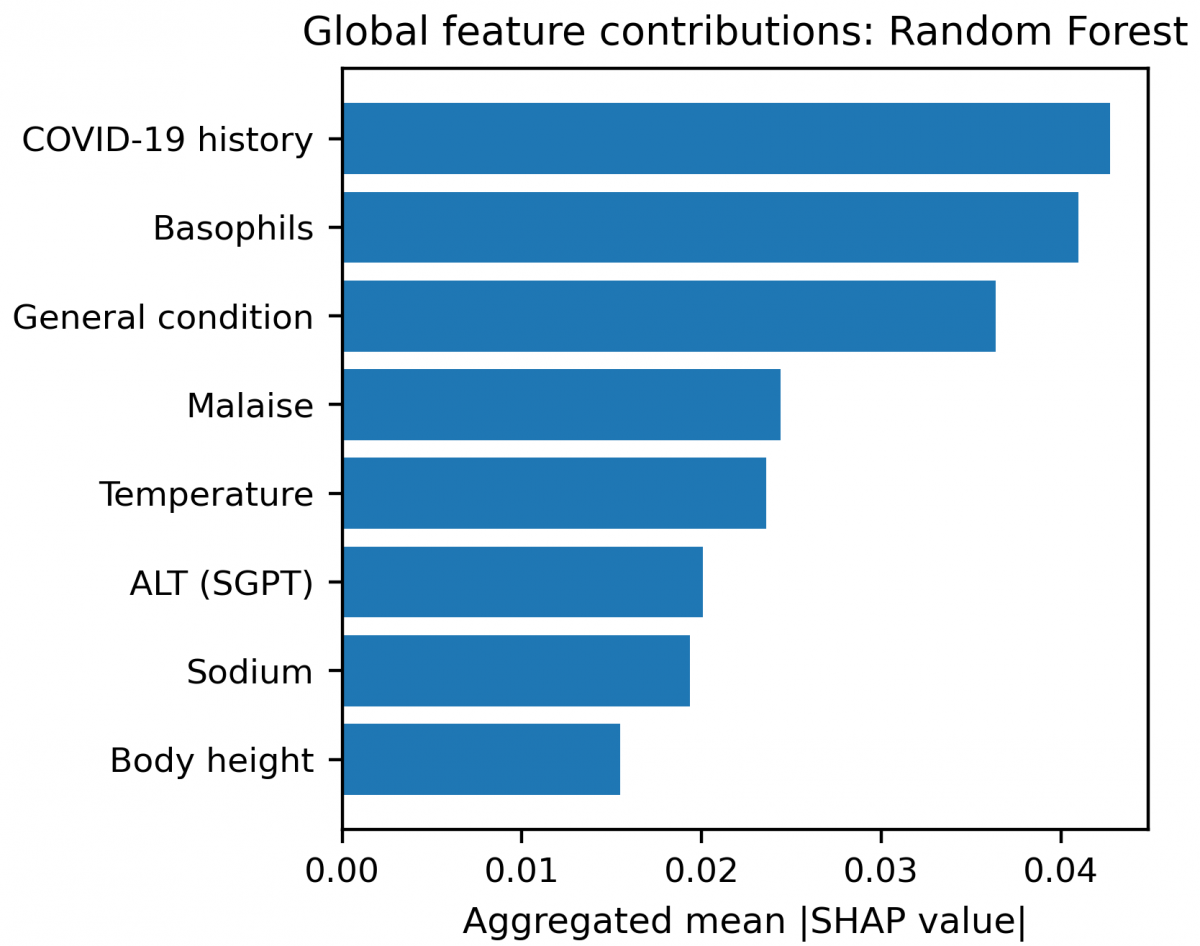
Figure 3 summarizes the global SHAP profile of the refitted Random Forest. Recorded COVID-19 history, basophil percentage, general condition, malaise, temperature, ALT (SGPT), sodium, and body height had the largest aggregated mean absolute contributions. Because the model failed to identify any target case, these rankings should not be interpreted as determinants of probable unknown hepatitis. Features such as COVID-19 history, basophils, and body height may reflect site composition, documentation patterns, missingness, or correlations with other variables. The figure therefore describes model behavior in this dataset rather than clinically meaningful causal relationships.
The second-round analyses reinforce that this study is an exploratory investigation of modelling limitations rather than a demonstration of screening capability. Overall discrimination was acceptable for the two common classes, but no model identified any of the five probable unknown cases. The primary fold-level Random Forest accuracy ranged from 79.31% to 91.38% and macro F1 from 53.83% to 61.40%, while repeated five-fold analysis showed that the highest macro-F1 model was not invariant across partition seeds. Thus, small differences in aggregate model metrics should not be interpreted as a reliable ranking.
The main explanation is event scarcity. Probable unknown hepatitis represented only 1.73% of the cohort, leaving four genuine target cases in each training fold. SMOTENC generated more than 120 synthetic target observations from that narrow empirical base, but over-sampling cannot replace genuine clinical diversity [11, 12]. Probability reliability was also inadequate for the target class: all three tree models had a worse target-class Brier score than the prevalence-only baseline, and Random Forest assigned a mean target probability of only 3.40% to the five actual target cases compared with 6.13% to non-target cases. These outputs therefore cannot be interpreted as clinically meaningful risk estimates [14].
The SHAP analysis must be interpreted within the same constraints. Because target sensitivity was 0%, the global SHAP profile primarily reflects separation of hepatitis and non-hepatitis in this retrospective cohort; it does not reveal biomarkers of AHUA. The current contribution is therefore methodological: transparent expert-label description, leakage control, rare-event validation diagnostics, probability-reliability assessment, and explicit separation between retrospective in-silico analysis and future clinical evaluation. Recent studies remain methodological examples [16, 17], while clinical interpretation is grounded in paediatric hepatitis literature [4-10].
5.1 Limitations and future work
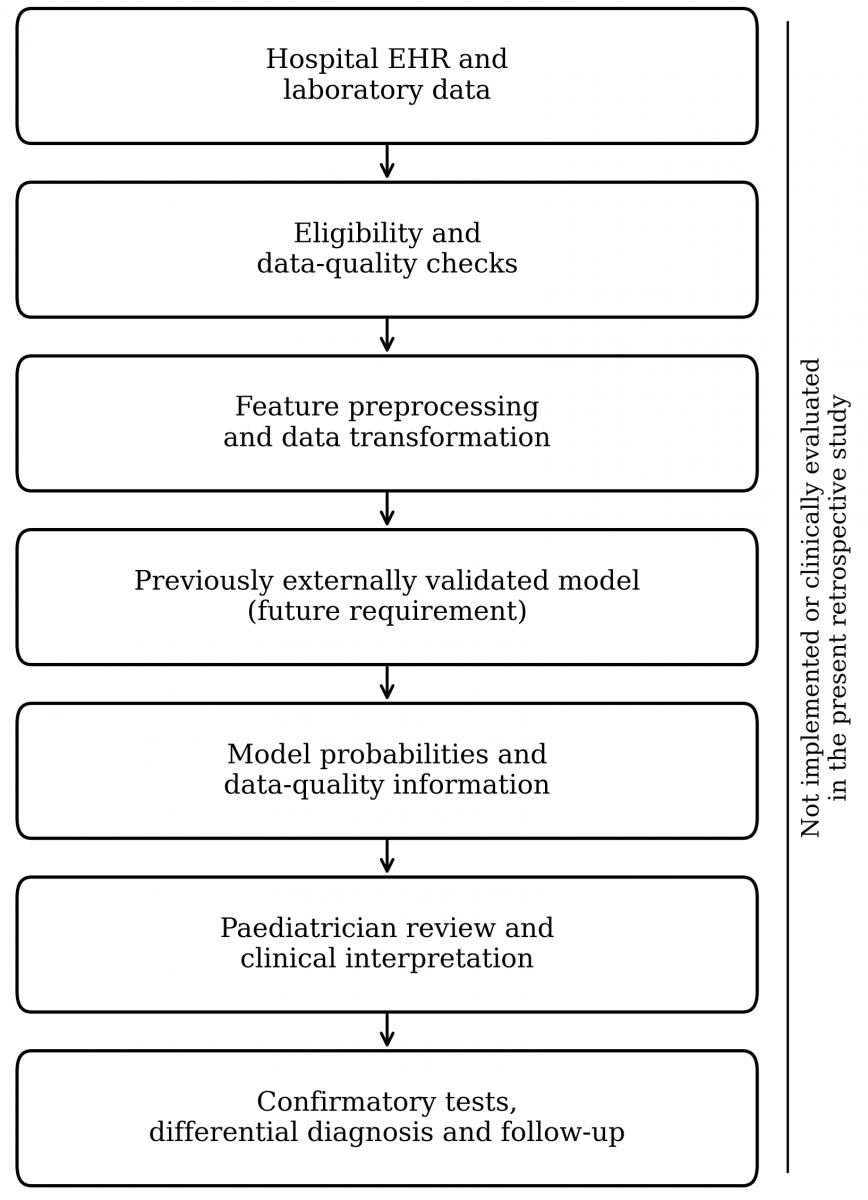
The main limitation is the availability of only five probable unknown cases. The retrospective expert annotation was performed by BRIN health specialists and knowledgeable hospital representatives, but a prospectively predefined blinded duplicate-rating protocol and formal inter-rater agreement were not available. No independent external dataset or prospective clinical evaluation was performed. The site-held-out robustness analysis cannot establish external validity because all sites were within one national healthcare context and target events were sparse. SHAP was post-hoc, and probability calibration for the target class could not be estimated reliably. Future work should prospectively recruit substantially more target cases, use predefined adjudication criteria with duplicate review where feasible, perform independent external validation, assess calibration and clinically justified thresholds, and only then evaluate an AI-assisted workflow in a live clinical environment in accordance with early clinical AI evaluation and deployment guidance [15, 24]. Figure 4 illustrates such a future integration pathway; it was not implemented or evaluated in the present study.
This exploratory retrospective multicenter study evaluated the feasibility and limitations of machine-learning classification for probable AHUA. Leakage-free analyses produced reasonable aggregate performance for the common classes but 0% sensitivity for all five target cases. Repeated partitioning, site-held-out analysis, and probability-reliability assessment further showed that the available data do not support a stable model ranking, calibrated target-class risk estimation, external validity, or clinical deployment. The study should therefore be interpreted as evidence of current data and validation requirements, not as a clinically validated screening or decision-support system. Larger prospectively adjudicated cohorts and independent external validation are required before clinical evaluation can be justified.
The authors thank the participating hospitals for their institutional and clinical support. This work was supported by the National Research and Innovation Agency of Indonesia (BRIN) under Research Grant No. B-231/III.9/PR.03.08/1/2023 and by Telkom University.
This study received ethical clearance from the National Research and Innovation Agency of Indonesia (BRIN) (approval No. 017/KE.03/SK/03/2023). The study used data originating from human participants. All data provided to the research team had been anonymized prior to analysis, and no personally identifiable information was included in the dataset. The requirement for informed consent was addressed in accordance with the original data collection protocol and the requirements of the approving ethics committee.
The data and code supporting the findings of this study are openly available in GitHub at https://github.com/hilalnuha/hepa_hybrid.
Appendix A. Data dictionary and site distribution
Table A1 provides the corrected data dictionary using the field names in the anonymized dataset and distinguishes administrative fields, the ground-truth outcome, retained predictors, and variables removed for high missingness.
Probable unknown cases were contributed by only three hospitals, and no participating site contained more than two such cases. This distribution explains why the leave-one-hospital-out analysis is reported only as a site-held-out robustness check and cannot substitute for independent external validation.
Table A1. Dataset variables, definitions, units, and modelling status
|
Dataset Field |
Clinical Description / Coding |
Dataset Field |
Clinical Description / Coding |
|
ID |
Anonymised patient-record identifier† |
Hospital |
Source hospital; grouping variable for internal-external validation† |
|
Final Diagnosis |
Expert-assigned outcome: 1 = probable unknown, 2 = hepatitis, 3 = non-hepatitis‡ |
Covid |
COVID-19 history/status (Yes/No) |
|
Sex |
Biological sex (Male/Female) |
Imunization history |
Immunisation history (Yes/No) |
|
Family Disease History |
Family history of disease (Yes/No) |
Allergen History |
Allergy history (Yes/No) |
|
Cough |
Cough (Yes/No) |
Nausea |
Nausea (Yes/No) |
|
Vomit |
Vomiting (Yes/No) |
Acute Diare |
Acute diarrhoea (Yes/No) |
|
Kotoran BAB Pucat |
Pale stools (Yes/No) |
Urine seperti teh/pekat |
Tea-coloured/dark urine, history field (Yes/No) |
|
Abdominalpain |
Reported abdominal pain (Yes/No) |
Malaise |
Malaise (Yes/No) |
|
Icteric |
Icterus (Yes/No) |
Pruritus |
Pruritus (Yes/No) |
|
Myalgia |
Myalgia (Yes/No) |
Common Cold |
Coryza/common cold (Yes/No) |
|
Fever History |
History of fever (Yes/No) |
General Condition |
General condition (Good/Fair/Poor) |
|
Icteric/sclera |
Scleral icterus (Yes/No) |
Jaundice |
Jaundice (Yes/No) |
|
PainAbdominalPD |
Abdominal pain on physical examination (Yes/No) |
Hepatomegali |
Hepatomegaly (Yes/No) |
|
Splenomegali |
Splenomegaly (Yes/No) |
Urine berwarna seperti teh / pekat |
Second recorded field for tea-coloured/dark urine (Yes/No) |
|
Age |
Age (years) |
Body Weight |
Body weight (kg) |
|
Temp |
Body temperature (°C) |
Body Height |
Body height (cm) |
|
Hb |
Haemoglobin (g/dL) |
Eritrosite |
Erythrocyte count (10⁶/µL) |
|
WBC |
White blood-cell count (10³/µL) |
Trombosit |
Platelet count (10³/µL) |
|
Hematokrit |
Haematocrit (%) |
LED |
Erythrocyte sedimentation rate (mm/h) |
|
VER |
Mean corpuscular volume, MCV (fL) |
HER |
Mean corpuscular haemoglobin, MCH (pg) |
|
KHER |
Mean corpuscular haemoglobin concentration, MCHC (g/dL) |
RDW |
Red-cell distribution width (%) |
|
Basofil |
Basophils (%) |
Neutrofil |
Neutrophils (%) |
|
Eosinofil |
Eosinophils (%) |
Batang |
Band neutrophils (%); removed, 86.85% missing* |
|
Segmen |
Segmented neutrophils (%); removed, 86.51% missing* |
Limfosit |
Lymphocytes (%) |
|
Glucose |
Glucose (mg/dL) |
SGOT |
Aspartate aminotransferase, AST (U/L) |
|
SGPT |
Alanine aminotransferase, ALT (U/L) |
Protrombine Time |
Prothrombin time (s); removed, 82.35% missing* |
|
Bilirubin Total |
Total bilirubin (mg/dL) |
Bilirubin Indirect |
Indirect bilirubin (mg/dL) |
|
Bilirubin Direct |
Direct bilirubin (mg/dL) |
Gamma GT |
Gamma-glutamyl transferase (U/L) |
|
Albumin |
Albumin (g/dL) |
Globulin |
Globulin (g/dL); removed, 94.46% missing* |
|
Creatinine |
Creatinine (mg/dL) |
Ureum |
Urea (mg/dL) |
|
Natrium |
Sodium (mEq/L) |
Kalium |
Potassium (mEq/L) |
|
clinical symptom history |
Duration of clinical symptoms (days) |
Day of fever history |
Duration of fever (days) |
|
Chlorida |
Chloride (mEq/L) |
Hospitalization |
Duration of hospitalization (days) |
Notes: † administrative or grouping field, excluded from the predictor matrix; ‡ ground-truth outcome, excluded from the predictor matrix; * removed before modelling because more than 80% of observations were missing. All other fields were candidate predictors. The two dark-urine fields were retained as separate source fields because they appeared separately in the retrospective dataset.
Table A2. Outcome distribution by participating hospital
|
Hospital |
Probable Unknown |
Hepatitis |
Non-Hepatitis |
Total |
|
RSUP Fatmawati |
2 |
116 |
23 |
141 |
|
RSPI Sulianti Saroso |
0 |
3 |
73 |
76 |
|
RSUP Adam Malik |
1 |
9 |
18 |
28 |
|
RSUD Soetomo |
2 |
24 |
5 |
31 |
|
RSUP M. Djamil |
0 |
11 |
2 |
13 |
|
Total |
5 |
163 |
121 |
289 |
[1] Mücke, M.M., Zeuzem, S. (2022). The recent outbreak of acute severe hepatitis in children of unknown origin - what is known so far. Journal of Hepatology, 77(1): 237-242. https://doi.org/10.1016/j.jhep.2022.05.001
[2] World Health Organization. (2022). Acute hepatitis of unknown aetiology in children - Multi-country. Disease Outbreak News. https://www.who.int/emergencies/disease-outbreak-news/item/DON-389.
[3] Ministry of Health of the Republic of Indonesia. (2022). The Ministry of Health (Kemenkes) found 18 suspected cases of acute hepatitis. https://www.kemkes.go.id/eng/kemenkes-temukan-18-orang-dugaan-kasus-hepatitis-akut.
[4] Marsh, K., Tayler, R., Pollock, L., et al. (2022). Investigation into cases of hepatitis of unknown aetiology among young children, Scotland, 1 January 2022 to 12 April 2022. Eurosurveillance, 27(15): 2200318. https://doi.org/10.2807/1560-7917.ES.2022.27.15.2200318
[5] Kelgeri, C., Couper, M., Gupte, G.L., et al. (2022). Clinical spectrum of children with acute hepatitis of unknown cause. The New England Journal of Medicine, 387(7): 611-619. https://doi.org/10.1056/NEJMoa2206704
[6] Vimalesvaran, S., Verma, A., Kyrana, E., Deheragoda, M., Dhawan, A. (2023). Acute hepatitis of unknown aetiology in children: A clinical update on the recent outbreak with mechanistic insights. Clinical and Experimental Immunology, 212(1): 29-31. https://doi.org/10.1093/cei/uxad023
[7] Indolfi, G., Czubkowski, P., Fitzpatrick, E., et al. (2022). Acute hepatitis of unknown etiology among young children: Research agenda by the ESPGHAN Hepatology Committee. Journal of Pediatric Gastroenterology and Nutrition, 75(4): 543-548. https://doi.org/10.1097/MPG.0000000000003567
[8] Servellita, V., Sotomayor Gonzalez, A., Lamson, D.M., et al. (2023). Adeno-associated virus type 2 in US children with acute severe hepatitis. Nature, 617: 574-580. https://doi.org/10.1038/s41586-023-05949-1
[9] Ho, A., Orton, R., Tayler, R., et al. (2023). Adeno-associated virus 2 infection in children with non-A-E hepatitis. Nature, 617: 555-563. https://doi.org/10.1038/s41586-023-05948-2
[10] Morfopoulou, S., Buddle, S., Torres Montaguth, O.E., et al. (2023). Genomic investigations of unexplained acute hepatitis in children. Nature, 617: 564-573. https://doi.org/10.1038/s41586-023-06003-w
[11] Banerjee, J., Taroni, J.N., Allaway, R.J., Prasad, D.V., Guinney, J., Greene, C. (2023). Machine learning in rare disease. Nature Methods, 20: 803-814. https://doi.org/10.1038/s41592-023-01886-z
[12] Schaefer, J., Lehne, M., Schepers, J., Prasser, F., Thun, S. (2020). The use of machine learning in rare diseases: A scoping review. Orphanet Journal of Rare Diseases, 15: 145. https://doi.org/10.1186/s13023-020-01424-6
[13] Andaur Navarro, C.L., Damen, J.A.A., Takada, T., et al. (2021). Risk of bias in studies on prediction models developed using supervised machine learning techniques: Systematic review. BMJ, 375: n2281. https://doi.org/10.1136/bmj.n2281
[14] Van Calster, B., McLernon, D.J., van Smeden, M., Wynants, L., Steyerberg, E.W. (2019). Calibration: The Achilles heel of predictive analytics. BMC Medicine, 17: 230. https://doi.org/10.1186/s12916-019-1466-7
[15] Vasey, B., Nagendran, M., Campbell, B., et al. (2022). Reporting guideline for the early stage clinical evaluation of decision support systems driven by artificial intelligence: DECIDE-AI. BMJ, 377: e070904. https://doi.org/10.1136/bmj-2022-070904
[16] Jondri, Indwiarti, Puspandari, D. (2025). Explainable machine learning on CAD-RADS score classification based on heart disease risk factors. Ingénierie des Systèmes d’Information, 30(3): 721-730. https://doi.org/10.18280/isi.300316
[17] Bhuana, C.L., Pramestiawan, R., Susanto, L.J., Verdian, A. (2026). Comparative analysis of performance of machine learning feature selection (Gini Decrease and Relief-F) in heart disease dataset. Jurnal Kecerdasan Buatan dan Teknologi Informasi, 5(2): 270-278. https://doi.org/10.69916/jkbti.v5i2.477
[18] Collins, G.S., Moons, K.G.M., Dhiman, P., et al. (2024). TRIPOD+AI statement: Updated guidance for reporting clinical prediction models that use regression or machine learning methods. BMJ, 385: e078378. https://doi.org/10.1136/bmj-2023-078378
[19] Moons, K.G.M., Damen, J.A.A., Kaul, T., et al. (2025). PROBAST+AI: An updated quality, risk of bias, and applicability assessment tool for prediction models using regression or artificial intelligence methods. BMJ, 388: e082505. https://doi.org/10.1136/bmj-2024-082505
[20] Chen, T.Q., Guestrin, C. (2016). XGBoost: A scalable tree boosting system. In Proceedings of the 22nd ACM SIGKDD International Conference on Knowledge Discovery and Data Mining, San Francisco, California, USA, pp. 785-794. https://doi.org/10.1145/2939672.2939785
[21] Chawla, N.V., Bowyer, K.W., Hall, L.O., Kegelmeyer, P.W. (2002). SMOTE: Synthetic minority over-sampling technique. Journal of Artificial Intelligence Research, 16: 321-357. https://doi.org/10.1613/jair.953
[22] Lundberg, S.M., Lee, S.I. (2017). A unified approach to interpreting model predictions. In Proceedings of the 31st International Conference on Neural Information Processing Systems, Long Beach, California, USA, pp. 4768-4777. https://dl.acm.org/doi/10.5555/3295222.3295230.
[23] Steyerberg, E.W., Harrell, F.E. (2016). Prediction models need appropriate internal, internal-external, and external validation. Journal of Clinical Epidemiology, 69: 245-247. https://doi.org/10.1016/j.jclinepi.2015.04.005
[24] Lekadir, K., Frangi, A.F., Porras, A.R., et al. (2025). FUTURE-AI: International consensus guideline for trustworthy and deployable artificial intelligence in healthcare. BMJ, 388: e081554. https://doi.org/10.1136/bmj-2024-081554