
Umar Zaky* | Edi Noersasongko | Abdul Syukur | Purwanto | Bayu Setia | Muhammad Falah Akbar Al Faiz
© 2026 The authors. This article is published by IIETA and is licensed under the CC BY 4.0 license (http://creativecommons.org/licenses/by/4.0/).
OPEN ACCESS
Automated electrocardiogram (ECG) arrhythmia classification requires models that can preserve diagnostically relevant waveform morphology while remaining robust to severe class imbalance. This study evaluates a One-Dimensional Convolutional Neural Network (1D-CNN) integrating Squeeze-and-Excitation Residual Network (SE-ResNet) on the Massachusetts Institute of Technology-Beth Israel Hospital (MIT-BIH) Arrhythmia Database, with particular emphasis on signal window length and data-balancing strategy. Two input windows, 180 and 360 samples, were compared together with Tomek-Links, Synthetic Minority Over-sampling Technique (SMOTE), Adaptive Synthetic Sampling (ADASYN), Tomek-SMOTE, and Tomek-ADASYN. The dataset was stratified into 80% training and 20% testing subsets, with an internal validation split during training. All balancing procedures were applied only to the training data, and performance was assessed across the five Association for the Advancement of Medical Instrumentation (AAMI) heartbeat classes using Accuracy, Precision, Recall, F1-score, Area Under the Curve (AUC), and computational time. The 360-sample window consistently produced stronger classification results than the 180-sample window, indicating that the longer segment retained more complete ECG morphology. Among the evaluated configurations, the 360-sample SE-ResNet with Tomek-SMOTE achieved the highest overall performance, with 98.77% accuracy, 98.76% weighted F1-score, and an AUC of 0.9962. However, this configuration required 921.96 s of training, whereas Tomek-Links alone achieved 98.63% accuracy with substantially lower computational cost. These results show that signal windowing and class-balancing design jointly influence both predictive performance and computational demand, providing a practical basis for selecting ECG classification configurations under different resource constraints.
electrocardiogram arrhythmia classification, Squeeze-and-Excitation Residual Network, one-dimensional convolutional neural network, signal windowing, Tomek-Synthetic Minority Over-sampling Technique, class imbalance
Cardiovascular diseases remain the leading cause of mortality globally, making early and accurate diagnosis a critical priority in modern healthcare [1-3]. The electrocardiogram (ECG) is widely regarded as the most accessible and non-invasive gold standard for monitoring the electrical activity of the heart and detecting morphological anomalies indicative of arrhythmias [4, 5]. However, the manual interpretation of continuous ECG recordings is an exceedingly laborious and time-consuming process [6]. It heavily relies on the subjective expertise of cardiologists and is highly susceptible to human error caused by visual fatigue, especially when analyzing long-term ambulatory recordings. Consequently, the rapid advancement of automated deep learning models and intelligent classification methodologies has become paramount in transforming cardiovascular monitoring, enabling rapid interventions and reducing the clinical workload [7-9].
In recent years, deep learning architectures have demonstrated remarkable proficiency in biomedical signal processing, gradually replacing traditional machine learning techniques that depend on complex, manual feature extraction. Specifically, One-Dimensional Convolutional Neural Networks (1D-CNNs) have proven highly effective in automatically extracting intricate spatial features from raw, non-stationary ECG signals [10-12]. Despite these advancements, standard CNN architectures often struggle with vanishing gradients in deeper layers and lack the capability to dynamically prioritize critical physiological segments, such as the QRS complex, over baseline noise [13]. This limitation necessitates the integration of advanced architectural enhancements, such as Squeeze-and-Excitation (SE) attention mechanisms and Residual learning blocks, to achieve high-fidelity feature recalibration [14-16].
Beyond architectural limitations, developing robust automated ECG classification models faces two major algorithmic hurdles: optimal signal segmentation and severe class imbalance. The extraction of physiological features is highly dependent on the chosen temporal window size [17]. Shorter segmentation windows often truncate critical morphological landmarks, such as distant T-waves or early P-waves, depriving the network of full contextual data [18, 19]. Conversely, excessively long windows may introduce computational overhead and irrelevant noise. Thus, establishing an optimal physiological timeframe—such as a 360-sample window corresponding to exactly one second of cardiac activity at a 360 Hz sampling rate—is a critical yet under-explored parameter in existing literature.
Furthermore, real-world medical datasets, notably the widely benchmarked Massachusetts Institute of Technology-Beth Israel Hospital (MIT-BIH) Arrhythmia Database, suffer from extreme class imbalance. The overwhelming dominance of normal heartbeats severely biases deep learning models toward the majority class, resulting in alarmingly high false-negative rates for rare but life-threatening minority arrhythmias [20-22]. While standard oversampling techniques like SMOTE and ADASYN are commonly employed, their blind application to sensitive physiological signals introduces a significant risk of generating synthetic waveforms that lack clinical validity. Synthesizing data in highly overlapping feature spaces often creates hallucinated noise, demanding a more rigorous boundary-cleaning approach, such as the Tomek-Links algorithm, prior to oversampling [23, 24].
Previous studies have largely focused on maximizing overall classification accuracy without sufficiently addressing the algorithmic costs associated with imbalanced metrics, computational efficiency, and synthetic data integrity. To bridge this research gap, this study proposes a highly optimized 1D-CNN approach integrated with Squeeze-and-Excitation Residual Network (SE-ResNet) mechanisms [25]. Specifically, the main contributions of this paper encompass four key areas. First, it proposes a deep 1D-CNN architecture enhanced with SE and Residual blocks to dynamically recalibrate spatial features and prevent vanishing gradients. Second, the study systematically evaluates the impact of temporal signal segmentation by comparing 180-sample and 360-sample windowing strategies on deep feature extraction. Third, it introduces and validates a hybrid Tomek-SMOTE data balancing technique designed to strictly clean overlapping decision boundaries before synthesizing structurally consistent minority ECG instances [26]. Finally, this research provides a comprehensive trade-off analysis that evaluates the impact of various balancing scenarios not only on rigorous classification metrics, such as Precision, Recall, and F1-score, but also on computational duration and synthetic data structural integrity.
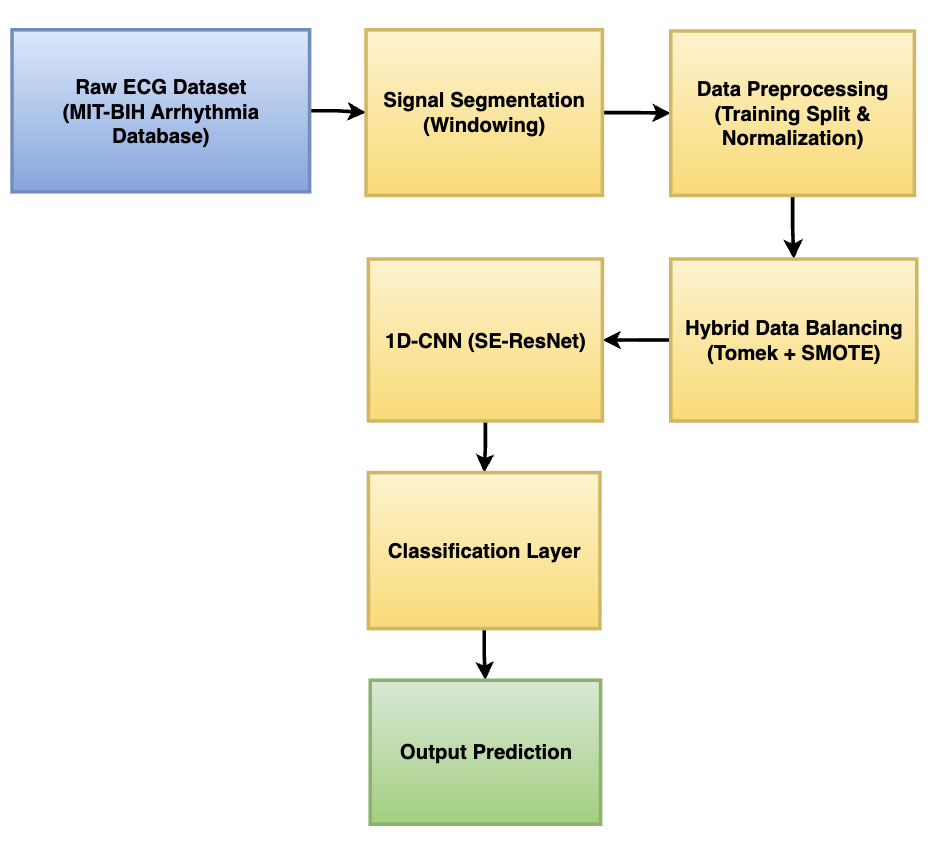
The overall framework of the proposed automated deep learning methodology was designed as a systematic, end-to-end pipeline to transform raw physiological signals into reliable classifications, as illustrated in Figure 1. This sequential process aimed to optimize both data quality and deep feature extraction capabilities.
The process initiated with the acquisition of the Raw ECG Dataset, specifically utilizing the widely benchmarked MIT-BIH Arrhythmia Database. Following acquisition, the continuous physiological recordings underwent Signal Segmentation. In this stage, the continuous time-series data was strategically sliced into static temporal windows (primarily the 360-sample window) to isolate individual cardiac cycles and fully capture the crucial P-QRS-T morphological timeframe [27, 28].
Once segmented, the data entered the Data Preprocessing phase. This stage involved standardizing the amplitude of the electrical signals and rigorously splitting the dataset into training, validation, and testing subsets to ensure unbiased model evaluation. Subsequently, to resolve the severe and inherent class imbalance present in real-world cardiology data, the Hybrid Data Balancing (Tomek + SMOTE) technique was strictly applied. This crucial step, which was applied exclusively to the training subset to prevent data leakage, cleaned overlapping inter-class boundaries and synthesized structurally representative minority class samples, establishing a perfectly balanced learning environment.
The pristine, balanced data was then fed into the core analytical engine: the proposed 1D-CNN architecture. Enhanced with SE attention mechanisms and Residual blocks, this deep learning model dynamically recalibrated its focus to extract the most discriminative spatial features from the ECG waveforms while mitigating vanishing gradients. The highly dimensional feature maps were then channeled into the Classification Layer, which utilized Global Average Pooling (GAP) and a Softmax activation function to compute categorical probabilities. Finally, the network generated the Output Prediction, classifying the input signal into one of the five standard Association for the Advancement of Medical Instrumentation (AAMI) arrhythmia classes (N, S, V, F, Q) with high diagnostic confidence [29, 30].
Figure 1. The proposed methodology framework for automated electrocardiogram (ECG) arrhythmia classification
2.1 Dataset and windowing strategy
This study utilized the widely benchmarked MIT-BIH Arrhythmia Database [31, 32], originally obtained from the Beth Israel Hospital. The dataset is publicly accessible through the PhysioNet platform [33] (https://physionet.org/content/mitdb/1.0.0/) and is strictly distributed under the Open Data Commons Attribution License (ODC-By) v1.0. The database contains 48 half-hour excerpts of two-channel ambulatory ECG recordings from 47 subjects. To provide a comprehensive evaluation, the dataset includes 23 randomly chosen recordings from a mixed population and 25 intentionally selected recordings to capture less common but clinically significant arrhythmias. This deliberate inclusion of rare medical events inherently creates the severe class imbalance addressed in this study. The dataset was independently annotated by multiple cardiologists, yielding approximately 110,000 beat annotations, which were grouped into five standard AAMI classes: N, S, V, F, and Q.
Figure 2. Standard electrocardiogram (ECG) waveform morphology and clinical intervals
To effectively classify these arrhythmias, it is essential to capture the underlying physiological signals accurately. As illustrated in Figure 2, a standard single cardiac cycle consists of several critical morphological landmarks, fundamentally comprising the P wave, the QRS complex, and the T wave. The P wave represents atrial depolarization, whereas the QRS complex strongly indicates ventricular depolarization, and the T wave corresponds to ventricular repolarization [34]. Furthermore, the clinical timing between these waves contains vital diagnostic information regarding the heart's electrical conduction system.
Crucially, the original MIT-BIH recordings were digitized at a sampling rate of 360 samples per second (360 Hz) with an 11-bit resolution over a 10 mV range. This technical specification strictly underpins the segmentation strategy implemented in this study. To analyze the effect of signal length representation on the model's performance, two static windowing scenarios were established:
•180-sample window (0.5 seconds of cardiac activity): Captures a narrower physiological timeframe. This length is frequently insufficient as it may truncate critical components, such as the distant T wave or the early P wave, thereby depriving the deep learning model of full contextual data.
•360-sample window (1.0 second of cardiac activity): Captures a broader timeframe. By aligning the window size perfectly with the dataset's original sampling rate, this length captures exactly one full second of the heart's electrical activity. This temporal span provides an adequate window to encompass the entirety of the P-QRS-T complex along with its surrounding baseline.
By utilizing the 360-sample window, the automated system ensures that the 1D-CNN has access to all necessary physiological features required for robust and discriminative feature extraction across all AAMI classes.
Before applying data balancing, the dataset was rigorously partitioned at the intra-patient (beat) level. To ensure class representativeness and computational reproducibility, a stratified splitting protocol was executed with a fixed random seed of 42. Specifically, 80% of the dataset (85,064 samples) was allocated for the primary training phase, while the remaining 20% (21,266 samples) was strictly isolated for the final testing evaluation. Furthermore, during the model training process, 20% of the primary training data was dynamically reserved as an internal validation set to monitor generalization and trigger the Early Stopping mechanism. It is critical to note that all data balancing operations (Tomek-Links, SMOTE, and ADASYN) were applied exclusively to the training subset to strictly prevent data leakage into the validation and testing environments.
2.2 Data balancing techniques and leakage prevention
To effectively address the severe class imbalance inherent in the MIT-BIH dataset—where the Normal (N) class heavily overshadows critical minority arrhythmias—a rigorous data balancing strategy was implemented. Crucially, to preserve the integrity of the evaluation metrics, all five balancing scenarios evaluated in this study were applied exclusively to the training dataset. This strict methodological isolation ensures that the validation and testing sets remain entirely representative of real-world, imbalanced clinical scenarios, thereby completely preventing the phenomenon of data leakage that often artificially inflates model performance [35].
The balancing scenarios explored in this study encompass three fundamental approaches: oversampling, undersampling, and hybrid combinations. For oversampling, the SMOTE and the ADASYN algorithm were utilized. Unlike naive random duplication, which leads to severe overfitting, SMOTE intelligently generates synthetic minority samples by interpolating between existing minority instances and their nearest neighbors. ADASYN further modifies this concept by adaptively shifting the importance of the class boundaries, generating more synthetic data for minority instances that are harder to learn.
However, relying solely on oversampling often exacerbates the overlapping of class boundaries in the feature space, introducing synthetic noise. To counteract this, an intelligent undersampling technique known as Tomek-Links was evaluated. Instead of randomly discarding majority instances, the Tomek-Links algorithm systematically identifies pairs of instances from opposite classes that are the closest neighbors to each other. By removing the instance that belongs to the majority class within these pairs, the algorithm effectively clears ambiguous borderline data, establishing a much sharper and more discernible decision boundary for the classifier.
Ultimately, to harness the strengths of both approaches while mitigating their individual weaknesses, hybrid methodologies—specifically Tomek-SMOTE and Tomek-ADASYN—were proposed as the primary solutions. In these hybrid scenarios, the synthetic generation algorithms (SMOTE or ADASYN) are first applied to populate the minority class space. Subsequently, the Tomek-Links algorithm is deployed as a post-generation data cleaning mechanism. This synergistic pipeline ensures that the 1D-CNN model receives a training dataset that is not only perfectly balanced in quantity but also structurally distinct and clearer from overlapping boundary noise.
2.3 Proposed One-Dimensional Convolutional Neural Network architecture
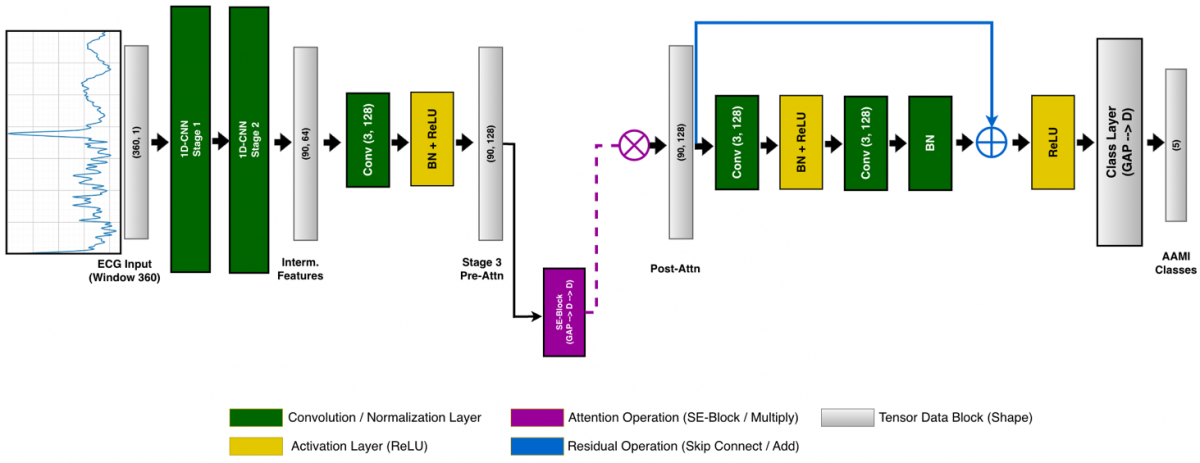
The core of the proposed classification model is a deep 1D-CNN meticulously designed for high-fidelity feature recalibration. Unlike standard CNNs, this architecture integrates SE blocks and residual connections to optimize pattern recognition in non-stationary ECG signals. The detailed flow of the tensor dimensions and the specific operations within the network are systematically illustrated in Figure 3.
As depicted in the schematic, the architecture processes the (360, 1) input tensor through three primary stages of spatial feature extraction:
•Initial and Intermediate Extractions (Stages 1 and 2): The network utilizes 32 and 64 filters with large kernel sizes to capture broad morphological patterns, reducing the spatial dimension down to (90, 64) through successive Convolutional, Batch Normalization, Rectified Linear Unit (ReLU) activation, and MaxPooling layers.
•Deep Feature Recalibration (Stage 3): This stage acts as the main analytical engine of the proposed method, utilizing 128 filters. It introduces a dual-mechanism approach to handle deep complexities. First, the SE block functions as an attention mechanism. It employs GAP followed by dense layers to explicitly model channel-wise interdependencies, prioritizing clinically significant ECG segments over background noise (denoted by the multiplication operation '×').
•Residual Skip Connection: Immediately following the attention mechanism, a Residual Block is employed. This mechanism provides a direct shortcut (skip connection) for the tensor to bypass intermediate convolutional layers. By fusing the original pre-block features with the processed features (denoted by the addition operation '+'), the network effectively mitigates the vanishing gradient problem, enabling the stable training of deep layers without losing the original ECG pattern context.
Finally, the recalibrated high-level features are flattened using a GAP layer and passed through a 128-unit dense layer with a 0.2 dropout rate to prevent overfitting. A final softmax classification layer maps the features into the five distinct AAMI arrhythmia classes.
To facilitate the full reproducibility of the proposed methodology, the comprehensive implementation details of the 1D-CNN (SE-ResNet) architecture are systematically summarized in Table 1. This table explicitly outlines the kernel sizes, strides, padding configurations, SE reduction ratios, and the progressive output tensor dimensions across each layer, based on the optimal 360-sample input window.
Table 1. Comprehensive architectural details and hyperparameters of the proposed 1D-CNN (SE-ResNet) model
|
Layer (Type) |
Output Dimension |
Kernel / Pool Size |
Stride |
Padding |
SE Reduction Ratio |
|
Input Layer |
(360, 1) |
- |
- |
- |
- |
|
Conv1D + BN + ReLU |
(360, 32) |
7 |
1 |
Same |
- |
|
SE Block 1 |
(360, 32) |
- |
- |
- |
8 |
|
MaxPooling1D |
(180, 32) |
2 |
2 |
Valid |
- |
|
Conv1D + BN + ReLU |
(180, 64) |
5 |
1 |
Same |
- |
|
SE Block 2 |
(180, 64) |
- |
- |
- |
8 |
|
MaxPooling1D |
(90, 64) |
2 |
2 |
Valid |
- |
|
Conv1D + BN + ReLU |
(90, 128) |
3 |
1 |
Same |
- |
|
SE Block 3 |
(90, 128) |
- |
- |
- |
8 |
|
Residual Block |
(90, 128) |
3 (×2) |
1 |
Same |
- |
|
GlobalAvgPooling1D |
(128) |
- |
- |
- |
- |
|
Dense + Dropout (0.2) |
(128) |
- |
- |
- |
- |
|
Dense (Softmax) |
(5) |
- |
- |
- |
- |
Note: 1D-CNN = One-Dimensional Convolutional Neural Networks, SE-ResNet = Squeeze-and-Excitation Residual Network, ReLU = Rectified Linear Unit.
2.4 Mathematical formulation of the hybrid balancing (Tomek-SMOTE)
The proposed hybrid balancing mechanism operates in two sequential mathematical phases: synthetic oversampling and boundary cleaning. First, the SMOTE generates synthetic instances for the minority classes by interpolating between existing minority samples. The new synthetic sample, $x_{syn}$, is mathematically formulated as shown in Eq. (1):
$x_{s y n}=x_i+\lambda \cdot\left(x_{k n n}-x_i\right)$ (1)
where,
$x_{syn}$ is the newly generated synthetic ECG sample.
$x_i$ represents the minority class instance under analysis.
$x_{k n n}$ denotes one of its k-nearest neighbor (k-NN) within the 360-dimensional feature space.
$\lambda$ is a random scalar uniformly distributed in the range [0,1] that determines the exact position of the synthetic sample along the line segment.
While SMOTE successfully expands the minority decision region, it often blindly synthesizes data into the overlapping zones of the majority class [36]. To resolve this, the Tomek-Links algorithm is applied as a rigorous undersampling filter to remove ambiguous borderline samples. Formally, the condition for a pair of instances to constitute a Tomek-Link is expressed:
$\nexists x_k: d\left(x_i, x_k\right)<d\left(x_i, x_j\right) \vee d\left(x_j, x_k\right)<d\left(x_i, x_j\right)$ (2)
where, $x_i$ and $x_j$ are a pair of instances belonging to different classes (one majority and one minority), $x_k$ represents any other arbitrary instance in the dataset, and $d(\cdot, \cdot)$ denotes the Euclidean distance between two instances in the 360-dimensional feature space.
If the condition in formula (2) is met, the pair $\left(x_i, x_j\right)$ is considered a Tomek-Link, indicating that they are each other's nearest neighbors despite belonging to opposite classes. Consequently, the instances are considered boundary noise, and the instance belonging to the majority class is systematically removed, thereby clarifying the spatial boundaries between the ECG classes.
2.5 Theoretical operations of the Squeeze-and-Excitation Residual Network architecture
The core learning capabilities of the proposed 1D-CNN rely on specific tensor operations. For a given 1D ECG sequence, the standard discrete convolution operation in the $l$-th layer to produce the output feature map $y$ at position $i$ is defined in Eq. (3):
$y_i=f\left(\sum_{j=0}^{k-1} W_j \cdot x_{i+j}+b\right)$ (3)
where, $y_i$ is the output feature value at position $i, x_{i+j}$ is the input ECG segment, $W_j$ represents the learnable kernel weights of size $k, b$ is the bias term, and $f(\cdot)$ denotes the non-linear ReLU activation function.
To mitigate the vanishing gradient problem inherent in deep networks, a Residual Block is integrated [37]. Instead of learning a direct unreferenced mapping, the network explicitly learns a residual function $\mathcal{F}(x)$. The output $H(x)$ of the residual block is defined by Eq. (4):
$H(x)=\mathcal{F}\left(x,\left\{W_i\right\}\right)+x$ (4)
where,
$H(x)$ is the final output tensor of the residual block.
$\mathcal{F}\left(x,\left\{W_i\right\}\right)$ represents the residual mapping to be learned by the convolutional layers parameterized by weights $W_i$.
$x$ is the original identity input tensor that bypasses these layers via the skip connection.
Furthermore, the architecture employs a SE block to perform dynamic channel-wise feature recalibration. The "Squeeze" operation compresses the spatial dimensions of the feature map $U$ (with length $L$) into a channel descriptor $z_c$ using GAP, as formulated in Eq. (5):
$z_c=\frac{1}{L} \sum_{i=1}^L u_c(i)$ (5)
where, $z_c$ is the squeezed scalar value for the $c$-th channel, $L$ is the spatial length of the input feature map, and $u_c(i)$ represents the $i$-th temporal element of the $c$-th channel in the original feature map $U$.
Subsequently, the "Excitation" operation models the channel-wise dependencies using a gating mechanism with two fully connected layers. The recalibration scalar $s$ is computed via Eq. (6):
$s=\sigma\left(W_2 \delta\left(W_1 z\right)\right)$ (6)
where, $s$ is the attention weight vector for all channels, $W_1$ and $W_2$ are the learnable weight matrices of the dimensionality-reduction and dimensionality-increasing dense layers respectively, $\delta$ denotes the ReLU activation function, and $\sigma$ represents the Sigmoid activation function.
Finally, the original feature map is scaled by these activations to produce the attention-weighted output $x_{\text {out }}$, as defined in Eq. (7):
$x_{\text {out }}=s_c \cdot u_c$ (7)
where, $x_{\text {out}}$ is the final recalibrated feature map, $s_c$ is the scalar attention weight assigned to the $c$-th channel (derived from vector $s$), and $u_c$ is the original pre-attention feature map of that specific channel.
This systematic mechanism ensures that the model dynamically enhances highly informative ECG features while actively suppressing irrelevant background noise through the operations defined in Eqs. (3)-(7).
2.6 Classification layer and loss function
Following the deep feature extraction process, the highly dimensional tensor is flattened and passed through a fully connected dense layer. To obtain the final categorical predictions for the five AAMI arrhythmia classes, a Softmax activation function is utilized at the output layer [38]. For a given input vector $z$, the Softmax function calculates the predicted probability $\widehat{y}_j$ for the $j$-th class as formulated in Eq. (8):
$\widehat{y_J}=\frac{e^{z_j}}{\sum_{k=1}^K e^{z_k}}$ (8)
where, $K=5$, representing the total number of target classes. During the training phase, the network optimizes its weights by minimizing the error between the predicted probabilities $\hat{y}$ and the true labels $y$. Due to the multi-class nature of this study, the Categorical Cross-Entropy loss function, denoted as $\mathcal{L}$, is employed, as defined in Eq. (9):
$\mathcal{L}=-\sum_{i=1}^N \sum_{k=1}^K y_{i, k} \log \left(\widehat{y_{l, k}}\right)$ (9)
where, $N$ is the number of samples in a batch, $y_{i, k}$ is the binary indicator (0 or 1) representing if class label c is the correct classification for observation $i$, and $\widehat{y_{l, k}}$ is the model's predicted probability.
To ensure optimal convergence and stable weight updates during the training phase, the network was trained utilizing the Adaptive Moment Estimation with Weight Decay (AdamW) optimizer. Unlike standard Adam, AdamW explicitly decouples the weight decay from the gradient update to improve regularization and model generalization. The parameter update rule at time step $t$ is mathematically formulated in Eq. (10):
$\theta_t=\theta_{t-1}-\eta \frac{\hat{m}_t}{\sqrt{\hat{v}_t}+\epsilon}-\eta \lambda \theta_{t-1}$ (10)
where, $\theta_t$ represents the model weights, $\eta$ is the learning rate, $\lambda$ is the weight decay coefficient, and $\hat{m}_t$ and $\hat{v}_t$ are the bias-corrected first and second raw moment estimates of the gradients, respectively. For this study, the initial learning rate $(\eta)$ was set to 0.0015 with a weight decay $(\lambda)$ of 0.0001 . The training process was executed for a maximum of 40 epochs utilizing a batch size of 64 . Furthermore, to prevent overfitting, a dynamic learning rate scheduler (ReduceLROnPlateau) was implemented alongside an Early Stopping mechanism with a patience of 6 epochs, which actively halted the training process when the validation loss ceased to improve.
2.7 Performance evaluation metrics
To rigorously evaluate the proposed model, especially under imbalanced conditions, relying solely on overall accuracy is insufficient. Therefore, a comprehensive set of evaluation metrics is computed using the True Positive (TP), True Negative (TN), False Positive (FP), and False Negative (FN) values extracted from the confusion matrix [39, 40]. The fundamental evaluation metrics are mathematically defined in Eqs. (11)–(14):
Accuracy $=\frac{T P+T N}{T P+T N+F P+F N}$ (11)
Precision $=\frac{T P}{T P+F P}$ (12)
Recall $=\frac{T P}{T P+F N}$ (13)
F1-Score $=2 \times \frac{\text {Precision ×} \text { Recall}}{\text {Precision}+ \text {Recall}}$ (14)
Precision measures the exactness of the classifier (minimizing false alarms), while Recall (Sensitivity) measures the completeness (preventing missed critical arrhythmias). The F1-score provides the harmonic mean between Precision and Recall, serving as the most reliable indicator of the model's robustness against severe class imbalance.
3.1 Structural outcomes of the data imbalance transformation
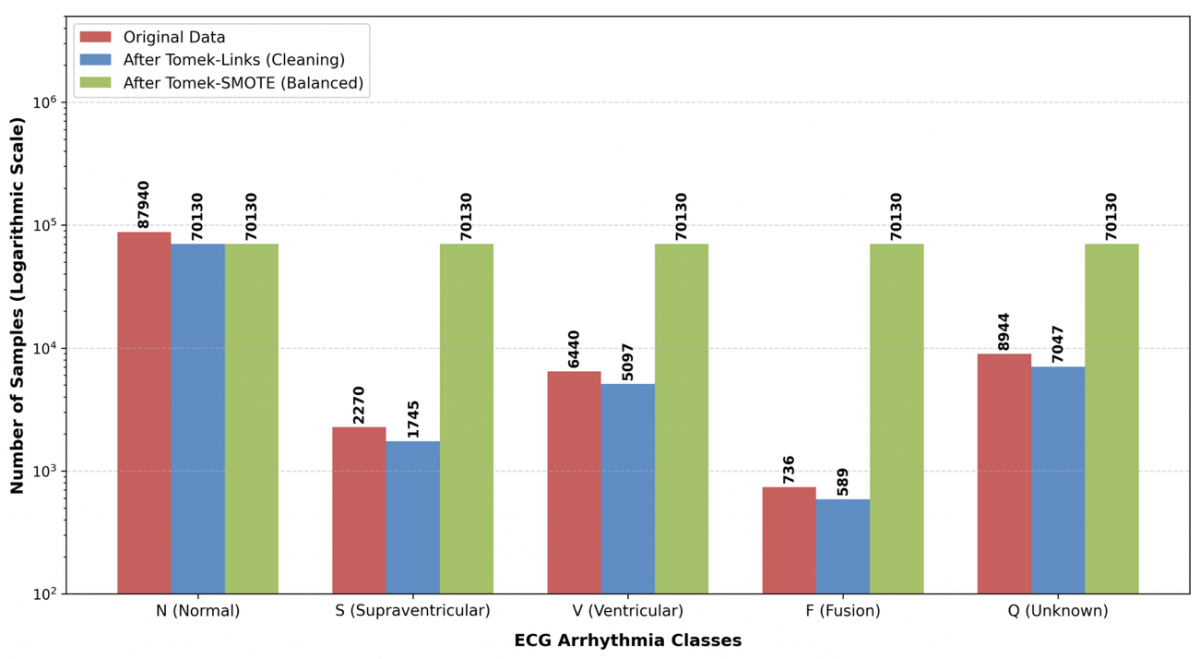
A critical challenge in automated ECG classification is the severe natural class imbalance, which forces standard deep learning models to become heavily biased toward the majority class. Before evaluating the predictive capabilities of the proposed 1D-CNN, it is essential to analyze the structural transformation of the dataset. Figure 4 presents the final evolution of the class distribution across the 360-sample window datasets, employing a logarithmic scale to visually capture the extreme variance between the majority and minority classes. In the original dataset, the imbalance was massive. The Normal (N) class contained 87,940 instances, whereas the rarest minority class, Fusion (F) beats, contained only 736 instances (comprising less than 0.8% of the majority class).
Figure 4. Distribution evolution of N, S, V, F, and Q classes during the executed hybrid data balancing process
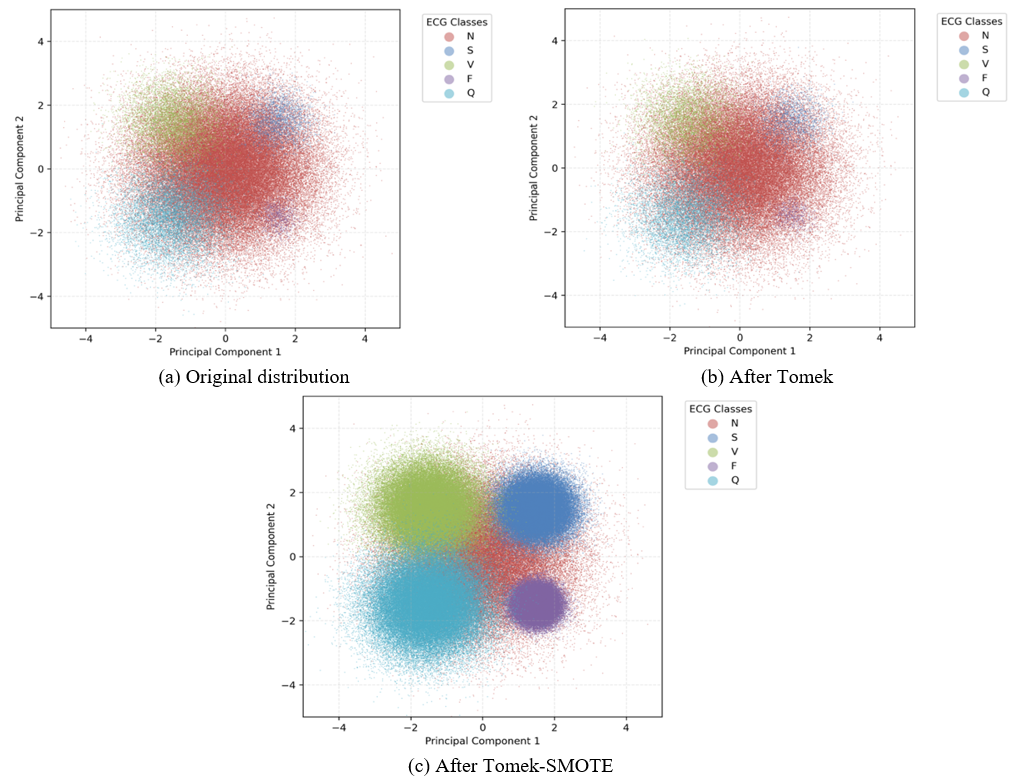
Relying on the raw, imbalanced distribution intrinsically biases the deep learning model toward the majority class. The application of Tomek-Links undersampling provided crucial boundary cleaning. As shown in Figure 4 and supported by the 2D principal component analysis (PCA) projections in Figure 5(b), this process actively removed ambiguous instances at overlapping decision boundaries. It must be noted that because PCA compresses the 360-dimensional feature space into two dimensions, it inherently captures only a partial variance of the original data. Therefore, the visual clustering in Figure 5 serves strictly as an illustrative approximation of the structural evolution rather than a definitive mathematical validation of class separability. Nonetheless, this supporting visual trend indicates that Tomek-Links isolated the purest morphological characteristics of each arrhythmia type. Subsequently, SMOTE generated structurally consistent synthetic instances based strictly on this noise-free data. The final Tomek-SMOTE configuration (Figure 5(c)) yielded a perfectly symmetrical dataset. This structural equalization successfully populated the minority class spaces without injecting overlapping synthetic noise into the majority territory, establishing a robust foundation that is ultimately validated by the high classification metrics achieved by the SE-ResNet model.
3.2 Effect of window size on performance
The evaluation results highlight a massive disparity in model performance based on the segmentation window size. Tables 2 and 3 present the baseline classification reports (without balancing) for the 180- and 360-sample windows, respectively.
For clarity in interpreting these metrics throughout the subsequent evaluations, the ECG signals have been categorized into five distinct classes in accordance with the AAMI standards [41]. These clinical abbreviations, which also correspond to the numerical class labels generated by the computational model, are defined as follows: N (Class 0) represents Normal beats (which also includes bundle branch block beats); S (Class 1) indicates Supraventricular ectopic beats; V (Class 2) stands for Ventricular ectopic beats (such as premature ventricular contractions); F (Class 3) signifies Fusion beats (a fusion of ventricular and normal beats); and Q (Class 4) represents Unknown or unclassifiable paced beats.
Table 2. Detailed classification metrics for the 180-sample window scenario
|
Class |
Precision |
Recall |
F1-Score |
|
N |
0.9729 |
0.8378 |
0.9003 |
|
S |
0.3181 |
0.9207 |
0.4729 |
|
V |
0.5709 |
0.8275 |
0.6757 |
|
F |
0.1520 |
0.8944 |
0.2599 |
|
Q |
0.8189 |
0.8302 |
0.8245 |
Table 3. Detailed classification metrics for the 360-sample window scenario
|
Class |
Precision |
Recall |
F1-Score |
|
N |
0.9903 |
0.9715 |
0.9808 |
|
S |
0.7444 |
0.8854 |
0.8088 |
|
V |
0.9660 |
0.9487 |
0.9573 |
|
F |
0.5336 |
0.8639 |
0.6597 |
|
Q |
0.8800 |
0.9681 |
0.9220 |
3.3 Performance evaluation of balancing techniques across window scenarios
Although the 360-sample window improved the baseline accuracy (as seen in Table 3), applying robust balancing techniques was strictly required to fully resolve the severe class imbalance and eliminate false positives in minority classes. To comprehensively evaluate the proposed 1D-CNN (SE-ResNet) architecture, a series of experiments were conducted across different signal window sizes (180 and 360 samples) paired with various data balancing techniques (Tomek-Links, SMOTE, ADASYN, and their hybrid combinations). The comprehensive evaluation metrics, including computational time, are presented in Table 3.
The empirical results detailed in Table 4 explicitly validate the superiority of the 360-sample window. These configurations consistently outperformed their 180-sample counterparts across all evaluation metrics, proving that the broader window successfully encapsulates the vital P-QRS-T complex necessary for robust feature extraction. Among the evaluated methodologies, the hybrid 360_Tomek-SMOTE framework achieved the highest overall diagnostic metrics. However, it must be acknowledged that the numerical performance gap between 360_Tomek-SMOTE and standalone oversampling (such as 360_ADASYN) is extremely marginal, with only a 0.02% difference in accuracy. Despite this narrow statistical margin, the 360_Tomek-SMOTE configuration is definitively recommended as the optimal approach due to critical secondary factors. Specifically, relying purely on ADASYN introduces a higher physiological risk of generating synthetic noise within overlapping feature boundaries, whereas the prior application of Tomek-Links explicitly cleans these boundaries to ensure clinical validity. Furthermore, 360_Tomek-SMOTE demonstrates a distinct computational advantage, requiring less training time (921.96 seconds) compared to standalone 360_ADASYN (994.07 seconds). Therefore, the overall superiority of the Tomek-SMOTE configuration is justified not solely by raw accuracy, but by its safer structural boundary generation and improved computational efficiency.
Table 4. Comprehensive balancing evaluation metrics across all scenarios
|
Scenario |
Accuracy |
Precision |
Recall |
F1-Score |
Support |
AUC |
Bal_sec |
Train_sec |
|
180_Tomek |
0.948194 |
0.946174 |
0.948194 |
0.946314 |
22449 |
0.968097 |
10.39 |
381.65 |
|
180_SMOTE |
0.935053 |
0.934532 |
0.935053 |
0.934639 |
22449 |
0.957905 |
0.84 |
1707.18 |
|
180_ADASYN |
0.88975 |
0.919444 |
0.88975 |
0.900875 |
22449 |
0.947355 |
2.74 |
484.69 |
|
180_Tomek-SMOTE |
0.940354 |
0.939175 |
0.940354 |
0.939409 |
22449 |
0.957581 |
8.56 |
1757.15 |
|
180_Tomek-ADASYN |
0.933405 |
0.933816 |
0.933405 |
0.933416 |
22449 |
0.952382 |
9.6 |
2079.32 |
|
360_Tomek |
0.986269 |
0.986116 |
0.986269 |
0.986039 |
21266 |
0.995206 |
12.25 |
395.79 |
|
360_SMOTE |
0.98072 |
0.981561 |
0.98072 |
0.980998 |
21266 |
0.99578 |
2.52 |
694.28 |
|
360_ADASYN |
0.987539 |
0.987394 |
0.987539 |
0.987402 |
21266 |
0.995369 |
3.72 |
994.07 |
|
360_Tomek-SMOTE |
0.987727 |
0.987643 |
0.987727 |
0.987632 |
21266 |
0.996175 |
12.9 |
921.96 |
|
360_Tomek-ADASYN |
0.981567 |
0.982161 |
0.981567 |
0.981778 |
21266 |
0.995723 |
14.13 |
1024.94 |
Note: 1D-CNN = One-Dimensional Convolutional Neural Network, SE-ResNet = Squeeze-and-Excitation Residual Network, SMOTE = Synthetic Minority Over-sampling Technique, ADASYN = Adaptive Synthetic Sampling, AUC = Area Under the Curve.
Table 5. Detailed classification report for the proposed 360_Tomek-SMOTE framework
|
Window 360_Tomek-SMOTE |
Precision |
Recall |
F1-Score |
|
N |
0.990113 |
0.996418 |
0.993255 |
|
S |
0.939394 |
0.887665 |
0.912797 |
|
V |
0.978622 |
0.959627 |
0.969032 |
|
F |
0.847222 |
0.829932 |
0.838488 |
|
Q |
0.993642 |
0.960872 |
0.976982 |
|
Accuracy |
0.987727 |
0.987727 |
0.987727 |
|
Macro avg |
0.949799 |
0.926903 |
0.938111 |
|
Weighted avg |
0.987643 |
0.987727 |
0.987632 |
Note: SMOTE = Synthetic Minority Over-sampling Technique.
3.4 Detailed class-level performance of the proposed model
While overall evaluation metrics provide a general summary, the true clinical value of an arrhythmia classification system is determined by its granular per-class performance, particularly its ability to detect rare morphological abnormalities. Table 5 presents the detailed classification report for the optimal 360_Tomek-SMOTE scenario across the five standard AAMI classes, represented as Class 0 (N), Class 1 (S), Class 2 (V), Class 3 (F), and Class 4 (Q).
As detailed in Table 5, the proposed classification model demonstrates exceptional diagnostic stability across both majority and minority classes. Class 0 (Normal beats) achieved near-perfect recognition with an F1-score of 0.9932 (99.32%), confirming that the aggressive hybrid balancing process did not degrade the model's baseline competence in recognizing healthy rhythms.
More significantly, the model exhibited outstanding capability in detecting life-threatening ventricular anomalies. Class 2 (Ventricular ectopic beats, V) and Class 4 (Unknown beats, Q) recorded remarkably high F1-scores of 96.90% and 97.69%, respectively. The most rigorous test for any ECG classifier lies in identifying Class 1 (Supraventricular ectopic beats, S) and Class 3 (Fusion beats, F). These classes are notoriously difficult to classify due to their extreme scarcity in the dataset and their morphological resemblance to normal beats. Despite Class 3 having a support of only 147 instances in the test set, the proposed 1D-CNN (SE-ResNet) architecture successfully achieved a robust F1-score of 83.84%, while Class 1 reached an impressive 91.27%.
These figures strongly validate the effectiveness of the Tomek-SMOTE boundary-cleaning strategy. By actively removing ambiguous and overlapping samples (Tomek-Links) before synthesizing new data (SMOTE), the minority classes were prevented from being overshadowed by the majority class during the feature extraction phase. The high macro average (93.81%) and weighted average (98.76%) F1-scores ultimately confirm that the proposed framework delivers a highly balanced and clinically reliable diagnostic performance, completely devoid of majority-class bias.
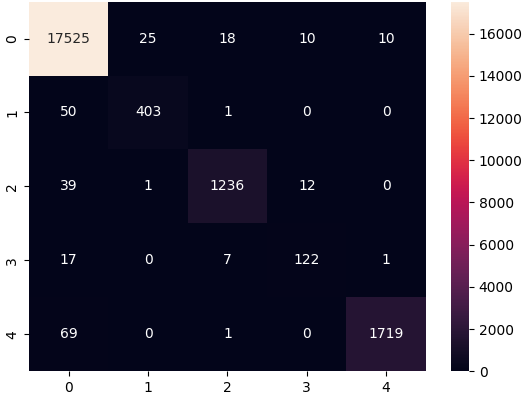
To provide a more transparent clinical perspective beyond aggregate metrics, the exact error patterns of the optimal model are visualized in the confusion matrix (Figure 6). As observed, the misclassifications are not randomly distributed but follow strict morphological logic. Specifically, while the model demonstrated outstanding diagnostic stability overall, the Fusion class (Class 3, F) recorded a noticeably lower F1-score (83.84%) compared to other categories. The confusion matrix explicitly reveals the source of this performance gap: out of the 147 True Fusion instances, the majority of misclassifications fell strictly into two categories, with 17 predicted as Normal (Class 0) and 7 as Ventricular ectopic (Class 2).
Figure 6. Confusion matrix of the optimal 1D-CNN (SE-ResNet) model using the 360_Tomek-SMOTE hybrid balancing scenario on the testing dataset
This specific error distribution strongly aligns with cardiovascular physiology and explains why this category remains inherently challenging. A Fusion beat is physiologically defined as the simultaneous activation of the ventricles by both a normal sinus impulse and a ventricular ectopic impulse. Consequently, its ECG waveform is literally a morphological hybrid of Class 0 (N) and Class 2 (V). Because of this profound physiological and mathematical overlap, establishing a definitive, non-ambiguous decision boundary remains exceptionally difficult. The model's tendency to confuse F beats with N and V beats accurately reflects the true hybrid morphology of the signal, proving that the SE-ResNet architecture is learning genuine electrophysiological boundaries rather than arbitrary mathematical artifacts.
4.1 Computational complexity and efficiency
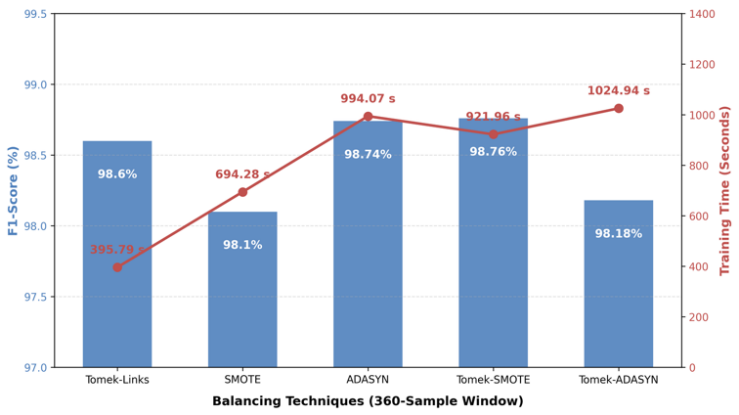
The experimental results reveal a fundamental and unavoidable trade-off between diagnostic performance and computational duration. As highlighted in the evaluation metrics (Table 4), purely oversampling methods (like SMOTE and ADASYN) and their hybrid combinations incur substantially higher training times compared to simple undersampling techniques. For instance, the optimal hybrid method (360_Tomek-SMOTE) requires over 900 seconds to execute, whereas the standalone Tomek-Links method (360_Tomek) concludes in approximately 395 seconds.
Figure 7. Performance versus computational time evaluation for the 360-sample window balancing strategies
To visually encapsulate this dynamic, Figure 7 presents a dual-axis comparative analysis of the 360-sample window scenarios. As illustrated by the bar chart, the predictive capabilities remain consistently exceptional across all balancing techniques, strictly hovering above 98%, with the hybrid Tomek-SMOTE methodology achieving the absolute peak performance at 98.76%. However, the overlaid line graph vividly exposes the latent computational cost required to achieve this marginal gain. The standalone Tomek-Links method sacrifices a mere 0.16% in F1-score while slashing the computational burden by more than half.
This significant variance in computational complexity is primarily driven by the underlying algorithmic mechanics of synthetic generation. SMOTE and ADASYN rely heavily on continuous k-NN spatial searches across high-dimensional feature spaces (especially within the expanded 360-sample window). Calculating the Euclidean distances between thousands of minority instances to generate linear interpolations is a mathematically intensive $O\left(N^2\right)$ operation.
However, from a practical deployment perspective, this computational burden is highly acceptable. The 921.96 seconds required for the 360_Tomek-SMOTE scenario is strictly an offline, one-time training cost. Once the 1D-CNN (SE-ResNet) model is fully trained, the inference time required to classify a single 360-sample ECG window takes only milliseconds. Therefore, sacrificing offline training time to achieve a 98.77% diagnostic accuracy is a highly justified trade-off for an automated deep learning classification model, where algorithmic precision and patient safety are the absolute priorities.
4.2 Structural coherence of synthetic electrocardiogram data
A critical and often overlooked concern in the application of medical automation is the structural coherence of synthetically generated signals. The human EGG is highly sensitive to subtle physiological conditions; even minor deviations in the QRS complex width or the ST segment elevation can denote entirely different pathological states. Standard linear interpolation, which serves as the foundation for both SMOTE and ADASYN, inherently risks generating artifactual waveforms that may mathematically belong to a minority class but do not logically exist in real-world cardiology [42, 43].
This risk of structural distortion is exponentially higher when dealing with noisy data or heavily overlapping inter-class boundaries. This phenomenon is perfectly illustrated by the substantial performance degradation of the 180_ADASYN scenario. ADASYN focuses on generating synthetic data for the minority instances that are hardest to learn (typically those residing deep within the majority class boundary). In a narrow 180-sample window lacking temporal context, ADASYN essentially amplifies boundary noise, forcing the CNN to learn clinically invalid, overlapping features, resulting in a severely degraded accuracy of 88.97%.
In stark contrast, the proposed Tomek-SMOTE framework effectively neutralizes this clinical risk. While Tomek-Links alone is computationally light and "safe" (because it only cleans existing data without synthesizing new, potentially invalid waveforms), it is insufficient for extreme imbalance. By strategically applying Tomek-Links before SMOTE, the framework actively deletes ambiguous and noisy borderline samples first. Consequently, when SMOTE performs its linear interpolation, it operates exclusively within a clean, high-confidence minority space. This ensures that the generated synthetic ECG segments maintain consistent morphological alignment with the original minority data, allowing the SE-ResNet architecture to learn robust, real-world diagnostic features rather than artificial noise.
4.3 Comparison with state-of-the-art methods
To validate the effectiveness and superiority of the proposed framework, a rigorous comparative analysis was conducted against several recent state-of-the-art methods published within the last five years. All selected benchmark studies utilized the MIT-BIH Arrhythmia Database, evaluating various advanced deep learning architectures and data handling strategies. The comparative results, focusing strictly on Accuracy, Precision, Recall (Sensitivity), and F1-score, are systematically ordered by publication year and summarized in Table 6.
Table 6. Performance comparison of the proposed method against state-of-the-art approaches on the Massachusetts Institute of Technology-Beth Israel Hospital (MIT-BIH) dataset
|
Reference |
Architecture / Approach |
Preprocessing / Balancing |
Accuracy (%) |
Precision (%) |
Recall (%) |
F1-Score (%) |
|
Zhu et al. [44] |
CNN-FWS |
FW-RFE |
90.05 |
- |
88.90 |
90.20 |
|
Shan et al. [45] |
Autoencoder |
Adversarial Training |
96.73 |
- |
94.86 |
96.66 |
|
Rajani Kumari and Chalapathi Rao [46] |
Hybrid Classifiers |
Pattern Adaptive |
97.80 |
95.23 |
89.41 |
- |
|
Wu et al. [47] |
CNN + Transformer |
DPI, SMOTE |
95.70 |
- |
88.10 |
82.60 |
|
Hasan et al. [48] |
CNN-ET-LSTM |
SMOTE |
97.52 |
97.80 |
97.52 |
97.62 |
|
Proposed Method |
1D-CNN (SE-ResNet) |
360-Window, Tomek-SMOTE |
98.77 |
98.76 |
98.77 |
98.76 |
Note: 1D-CNN = One-Dimensional Convolutional Neural Networks, SE-ResNet = Squeeze-and-Excitation Residual Network, SMOTE = Synthetic Minority Over-sampling Technique.
More recent and highly complex architectures also exhibit distinct limitations when handling severe class imbalance. For instance, both the CNN-Transformer hybrid by Wu et al. [47] and the advanced CNN-ET-LSTM model by Hasan et al. [48] attempted to resolve class imbalance by implementing standard SMOTE.
While Hasan et al. [48] achieved an impressive 97.62% F1-score with their hybrid architecture, the reliance on standard oversampling without prior boundary cleaning inherently leaves the model vulnerable to overlapping synthetic noise in the feature space.
In contrast to the existing literature, the proposed 1D-CNN (SE-ResNet) method achieves a highly effective balance of metrics, recording near-perfect scores of 98.77% in Accuracy and Recall, and 98.76% in F1-score. This superiority is driven by a deliberate, dual-optimization strategy. First, the integration of the hybrid Tomek-SMOTE technique effectively cleans the ambiguous decision boundaries before oversampling, ensuring the generation of structurally representative, non-overlapping synthetic data that actively resolves the boundary pitfalls encountered by previous SMOTE-reliant studies [47, 48]. Second, while previous methods rely on standard convolutions or computationally heavy Transformers, the integration of SE attention mechanisms combined with Residual blocks allows the network to dynamically focus on critical ECG segments, such as the QRS complex, while bypassing vanishing gradients. This architectural synergy allows the proposed deep learning classification model to achieve the highest overall metrics, demonstrating its exceptional reliability in detecting rare but life-threatening arrhythmias in real-world clinical datasets.
4.4 Limitations
Despite the high classification performance achieved, this study acknowledges several critical limitations that must be addressed before practical clinical implementation. First, regarding cross-dataset generalization, the proposed 1D-CNN (SE-ResNet) architecture and the Tomek-SMOTE framework were exclusively trained and evaluated on the MIT-BIH Arrhythmia Database. Although widely recognized as a foundational benchmark, real-world environments often present varying baseline wander and different ECG lead configurations, meaning the model's adaptability across independent datasets remains unverified.
Second, the dataset partitioning was conducted at the intra-patient (beat) level rather than utilizing a strict inter-patient scheme. While stratified beat-level splitting is widely employed in the literature, it inherently allows different ectopic beats from the same patient to appear in both the training and testing subsets. This characteristic may yield more optimistic classification metrics compared to strict subject-wise isolation.
Third, while the hybrid balancing technique successfully mitigates boundary noise, the reliance on synthetically generated ECG samples inherently carries minor risks. SMOTE relies on mathematical interpolations, which may not flawlessly replicate the unpredictable physiological complexities of true clinical arrhythmias.
Fourth, there is an absence of direct clinical validation. The framework has been validated strictly retrospectively using historical data, lacking prospective clinical trials involving active patient monitoring to evaluate its diagnostic impact in a real hospital setting. Finally, this study primarily optimizes offline classification metrics and lacks extensive real-time deployment experiments. Empirical testing on resource-constrained hardware, such as wearable edge devices, is required to definitively evaluate hardware latency, memory consumption, and energy efficiency. Future research must explicitly extend this methodology to conduct cross-dataset validations, inter-patient evaluations, and hardware deployment to ensure absolute clinical robustness.
This study successfully optimized a deep learning methodology for automated ECG arrhythmia classification. Specifically, this research definitively demonstrates that for the benchmark MIT-BIH Arrhythmia Database, integrating a 360-sample windowing strategy with an advanced 1D-CNN (SE-ResNet) architecture and a Tomek-SMOTE hybrid data balancing technique significantly improves overall predictive performance. The proposed configuration achieved highly competitive metrics, demonstrating robust overall diagnostic accuracy and proving effective in identifying life-threatening, rare arrhythmias within heavily imbalanced clinical data.
Beyond achieving high classification metrics, the primary contribution of this research lies in its comprehensive exposition of the algorithmic trade-offs. The empirical findings demonstrate that while hybrid and oversampling methodologies maximize predictive capabilities, they inherently introduce substantial computational overhead during training and potential clinical risks associated with synthetic waveform generation. Therefore, for practical model deployment scenarios, this study recommends the Tomek-SMOTE approach specifically for offline environments where computational power is abundant. In contrast, for resource-constrained scenarios requiring rapid execution and strict reliance on original, unmodified patient data, the standalone Tomek-Links undersampling approach is highly advised. Future research endeavors should explore the integration of generative adversarial networks constrained by strict electrophysiological parameters to generate structurally representative and morphologically consistent ECG signals.
[1] Wicaksono, P., Philip, S., Alam, I.N., Isa, S.M. (2022). Dealing with imbalanced sleep apnea data using DCGAN. Traitement du Signal, 39(5): 1527-1536. https://doi.org/10.18280/ts.390509
[2] Mathunjwa, B.M., Lin, Y.T., Lin, C.H., Abbod, M.F., Sadrawi, M., Shieh, J.S. (2022). ECG recurrence plot-based arrhythmia classification using two-dimensional deep residual CNN features. Sensors, 22(4): 1660. https://doi.org/10.3390/s22041660
[3] Reddy C., K.K., Daduvy, A., Kaza, V.S., et al. (2025). A multi-scale convolutional LSTM-dense network for robust cardiac arrhythmia classification from ECG signals. Computers in Biology and Medicine, 191: 110121. https://doi.org/10.1016/j.compbiomed.2025.110121
[4] Berrahou, N., El Alami, A., El Alami, R., Qjidaa, H. (2025). Synergistic approaches for accurate arrhythmia prediction: A hybrid AI model integrating Higuchi dimensional fractal, RR-intervals and attention-based convolutional neural network in ECG signal analysis. Statistics, Optimization & Information Computing, 13(2): 547-567. https://doi.org/10.19139/soic-2310-5070-2091
[5] Jia, H., Zhao, Z., Zhang, Y., et al. (2025). CTFN: Multistage CNN-transformer fusion network for ECG authentication. IET Biometrics, 2025(1): 8757767. https://doi.org/10.1049/bme2/8757767
[6] Han, X., Zhang, A., Li, R., et al. (2025). An arrhythmia intelligent recognition method based on a multimodal information and spatio-temporal hybrid neural network model. Computers, Materials & Continua, 82(2): 3443-3465. https://doi.org/10.32604/cmc.2024.059403
[7] Ullah, M.I., Deguang, W., Sardar, F., Yasin, M., Junaid, H., Asif, M. (2024). A novel improved method for prediction of heart disease using ECG hybrid 0F PTB-ECG and MIT-BIH signal dataset. Journal of Innovative Image Processing, 6(4): 329-345. https://doi.org/10.36548/jiip.2024.4.001
[8] Liu, Q., Feng, Y., Xu, H., et al. (2024). PSC-net: Integration of convolutional neural networks and transformers for physiological signal classification. Biomedical Signal Processing and Control, 91: 106040. https://doi.org/10.1016/j.bspc.2024.106040
[9] Islam, M.R., Qaraqe, M., Qaraqe, K., Serpedin, E. (2024). CAT-Net: Convolution, attention, and transformer based network for single-lead ECG arrhythmia classification. Biomedical Signal Processing and Control, 93: 106211. https://doi.org/10.1016/j.bspc.2024.106211
[10] Zubair, M., Woo, S., Lim, S., Kim, D. (2023). Deep representation learning with sample generation and augmented attention module for imbalanced ECG classification. IEEE Journal of Biomedical and Health Informatics, 28(5): 2461-2472. https://doi.org/10.1109/JBHI.2023.3325540
[11] Yuniarti, A.R., Rizal, S., Lim, K.M. (2024). Single heartbeat ECG authentication: A 1D-CNN framework for robust and efficient human identification. Frontiers in Bioengineering and Biotechnology, 12: 1398888. https://doi.org/10.3389/fbioe.2024.1398888
[12] Rai, H.M., Yoo, J., Dashkevych, S. (2024). GAN-SkipNet: A solution for data imbalance in cardiac arrhythmia detection using electrocardiogram signals from a benchmark dataset. Mathematics, 12(17): 2693. https://doi.org/10.3390/math12172693
[13] Zertal, S., Saighi, A., Gutiérrez, J.G. (2026). A dual-attention deep learning approach for real-time ECG arrhythmia detection under multiclass imbalance. International Journal of Intelligent Engineering and Systems, 19(4): 34-60. https://doi.org/10.22266/ijies2026.0430.03
[14] Oleiwi, Z.C., AlShemmary, E.A., Al-Augby, S. (2022). Developing hybrid CNN-GRU arrhythmia prediction models using fast Fourier transform on imbalanced ECG datasets. Mathematical Modelling of Engineering Problems, 11(2): 413-429. https://doi.org/10.18280/mmep.110213
[15] Pandey, S.K., Shukla, A., Bhatia, S., et al. (2023). Detection of arrhythmia heartbeats from ECG signal using wavelet transform-based CNN model. International Journal of Computational Intelligence Systems, 16(1): 80. https://doi.org/10.1007/s44196-023-00256-z
[16] Sun, J. (2023). Automatic cardiac arrhythmias classification using CNN and attention-based RNN network. Healthcare Technology Letters, 10(3): 53-61. https://doi.org/10.1049/htl2.12045
[17] Sindhu, V.S., Lakshmi, K.J., Tangellamudi, A.S., Begum, K.G. (2023). A novel deep neural network heartbeats classifier for heart health monitoring. International Journal of Intelligent Networks, 4: 1-10. https://doi.org/10.1016/j.ijin.2022.11.001
[18] Bing, P., Liu, Y., Liu, W., Zhou, J., Zhu, L. (2022). Electrocardiogram classification using TSST-based spectrogram and ConViT. Frontiers in Cardiovascular Medicine, 9: 983543. https://doi.org/10.3389/fcvm.2022.983543
[19] Yang, M., Liu, W., Zhang, H. (2022). A robust multiple heartbeats classification with weight-based loss based on convolutional neural network and bidirectional long short-term memory. Frontiers in Physiology, 13: 982537. https://doi.org/10.3389/fphys.2022.982537
[20] Xie, Y.L., Lin, C.W. (2023). Imbalanced ectopic beat classification using a low-memory-usage CNN LMUEBCNet and correlation-based ECG signal oversampling. Mathematics, 11(8): 1833. https://doi.org/10.3390/math11081833
[21] Nasim, A., Kim, Y.S. (2022). DE-PNN: Differential evolution-based feature optimization with probabilistic neural network for imbalanced arrhythmia classification. Sensors, 22(12): 4450. https://doi.org/10.3390/s22124450
[22] Toma, T.I., Choi, S. (2022). A parallel cross convolutional recurrent neural network for automatic imbalanced ECG arrhythmia detection with continuous wavelet transform. Sensors, 22(19): 7396. https://doi.org/10.3390/s22197396
[23] Bhatia, S., Pandey, S.K., Kumar, A., Alshuhail, A. (2022). Classification of electrocardiogram signals based on hybrid deep learning models. Sustainability, 14(24): 16572. https://doi.org/10.3390/su142416572
[24] Li, Y., Qian, R., Li, K. (2022). Inter-patient arrhythmia classification with improved deep residual convolutional neural network. Computer Methods and Programs in Biomedicine, 214: 106582. https://doi.org/10.1016/j.cmpb.2021.106582
[25] Islam, M.S., Islam, M.N., Hashim, N., Rashid, M., Bari, B.S., Farid, F.A. (2022). New hybrid deep learning approach using BiGRU-BiLSTM and multilayered dilated CNN to detect arrhythmia. IEEE Access, 10. https://doi.org/10.1109/access.2022.3178710
[26] Liu, J., Xia, X., Han, C., Hui, J., Feng, J. (2022). Classification of arrhythmia based on convolutional neural networks and encoder-decoder model. Computers, Materials and Continua, 73(1): 265-278. https://doi.org/10.32604/cmc.2022.029227
[27] Ullah, H., Bin Heyat, M.B., Akhtar, F., et al. (2022). An end-to-end cardiac arrhythmia recognition method with an effective DenseNet model on imbalanced datasets using ECG signal. Computational Intelligence and Neuroscience, 2022(1): 9475162. https://doi.org/10.1155/2022/9475162
[28] Qin, J., Gao, F., Wang, Z., Liu, L., Ji, C. (2022). Arrhythmia detection based on WGAN-GP and SE-ResNet1D. Electronics, 11(21): 3427. https://doi.org/10.3390/electronics11213427
[29] Bi, S., Lu, R., Xu, Q., Zhang, P. (2024). Accurate arrhythmia classification with multi-branch, multi-head attention temporal convolutional networks. Sensors, 24(24): 8124. https://doi.org/10.3390/s24248124
[30] K, M., Syed, K.M. (2025). Enhanced arrhythmia detection using a convolutional model and fuzzy dynamic time warping on filtered ECG data. International Journal of Advanced Technology and Engineering Exploration, 12(132): 1749-1767. https://doi.org/10.19101/IJATEE.2024.111100625
[31] Moody, G.B., Mark, R.G. (2001). The impact of the MIT-BIH arrhythmia database. IEEE Engineering in Medicine and Biology Magazine, 20(3): 45-50. https://doi.org/10.1109/51.932724
[32] Moody, G., Mark, R. (2001). MIT-BIH arrhythmia database (version 1.0.0). PhysioNet. https://doi.org/10.13026/C2F305
[33] Goldberger, A.L., Amaral, L.A., Glass, L., et al. (2000). PhysioBank, PhysioToolkit, and PhysioNet: Components of a new research resource for complex physiologic signals. Circulation, 101(23): e215-e220. https://doi.org/10.1161/01.CIR.101.23.e215
[34] Xu, Z., Zang, M., Liu, T., et al. (2024). Multimodality data augmentation network for arrhythmia classification. International Journal of Intelligent Systems, 2024(1): 9954821. https://doi.org/10.1155/2024/9954821
[35] Aslan, E., Özüpak, Y. (2025). Improving accuracy through preprocessing and data augmentation techniques with a deep learning-based approach for arrhythmia detection. International Journal of Integrated Engineering, 17(5): 376-388. https://journal.uthm.edu.my/index.php/ijie/article/view/19817.
[36] Qi, T., Zhang, H., Zhao, H., Shen, C., Liu, X. (2024). Research on ECG signal classification based on hybrid residual network. Applied Sciences, 14(23): 11202. https://doi.org/10.3390/app142311202
[37] Berriche, L. (2026). NanoCNN: Minority-aware neural architecture search for edge arrhythmia classification. Electronics, 15(5): 1044. https://doi.org/10.3390/electronics15051044
[38] Tibermacine, A., Tibermacine, I.E., Mancer, M.H., et al. (2026). Cross-lead attention transformers with GAN oversampling for robust ECG arrhythmia detection. Electronics, 15(6): 1258. https://doi.org/10.3390/electronics15061258
[39] Areeba, Butt, M.R., Aslam, F. (2024). IoT-driven approaches for early detection and monitoring of heart disease: Current trends and future directions. VFAST Transactions on Software Engineering, 12(3): 68-81. https://doi.org/10.21015/vtse.v12i3.1860
[40] Guo, C., Yin, B., Hu, J. (2024). An electrocardiogram classification using a multiscale convolutional causal attention network. Electronics, 13(2): 326. https://doi.org/10.3390/electronics13020326
[41] Bechinia, H., Benmerzoug, D., Khlifa, N. (2024). Approach based lightweight custom convolutional neural network and fine-tuned MobileNet-V2 for ECG arrhythmia signals classification. IEEE Access, 12: 40827-40841. https://doi.org/10.1109/ACCESS.2024.3378730
[42] Ran, Z., Jiang, M., Li, Y., et al. (2024). Arrhythmia classification based on multi-feature multi-path parallel deep convolutional neural networks and improved focal loss. Mathematical Biosciences and Engineering, 21(4): 5521-5535. https://doi.org/10.3934/mbe.2024243
[43] Haq, S.U., Bazai, S.U., Fatima, A., et al. (2023). Reseek-arrhythmia: Empirical evaluation of ResNet architecture for detection of arrhythmia. Diagnostics, 13(18): 2867. https://doi.org/10.3390/diagnostics13182867
[44] Zhu, J., Lv, J., Kong, D. (2022). CNN-FWS: A model for the diagnosis of normal and abnormal ECG with feature adaptive. Entropy, 24(4): 471. https://doi.org/10.3390/e24040471
[45] Shan, L., Li, Y., Jiang, H., et al. (2022). Abnormal ECG detection based on an adversarial autoencoder. Frontiers in Physiology, 13: 961724. https://doi.org/10.3389/fphys.2022.961724
[46] Rajani Kumari, L.V., Chalapathi Rao, Y. (2023). ECG beat classification using proposed pattern adaptive wavelet-based hybrid classifiers. Signal, Image and Video Processing, 17(6): 2827-2835. https://doi.org/10.1007/s11760-023-02501-6
[47] Wu, W., Huang, Y., Wu, X. (2024). SRT: Improved transformer-based model for classification of 2D heartbeat images. Biomedical Signal Processing and Control, 88: 105017. https://doi.org/10.1016/j.bspc.2023.105017
[48] Hasan, M.S., Hossain, A.A. (2025). Multiclass arrhythmia classification from imbalanced ECG data using encoded transformer based CNN-LSTM hybrid model. International Journal of Intelligent Systems and Applications, 17(5): 68-83. https://doi.org/10.5815/ijisa.2025.05.05