
Ammar Z. Abbo* | Hadeel K. Aljobouri | Ammar M. Al-Mosawe
© 2026 The authors. This article is published by IIETA and is licensed under the CC BY 4.0 license (http://creativecommons.org/licenses/by/4.0/).
OPEN ACCESS
Accurate grading of lumbar foraminal and lateral recess stenosis on magnetic resonance imaging (MRI) remains challenging because of complex spinal anatomy, small pathological regions, and variability in radiological interpretation. This study proposes an anatomy-aware deep learning (DL) framework for automated level-wise and side-specific grading of lumbar foraminal and lateral recess stenosis. The proposed pipeline first utilizes Digital Imaging and Communications in Medicine (DICOM) spatial metadata to establish disc-level correspondence between sagittal and axial MRI sequences, followed by anatomy-guided region-of-interest (ROI) extraction for the left and right neural foraminal and lateral recess regions. A structured 2.5D multi-slice representation based on consecutive axial T2-weighted images is then introduced and classified using modified ResNet-18 models for three severity categories: mild, moderate, and severe. Experiments were conducted on the RSNA 2024 Lumbar Spine Degenerative Classification Challenge dataset, including 1,789 patients and 15,870 disc-level samples. The proposed framework achieved consistent performance across four anatomical regions, with accuracy ranging from 78.41% to 81.47% and Macro-F1 scores ranging from 0.782 to 0.818. The results demonstrate the feasibility of combining spatial localization, anatomical region modeling, and multi-slice representation for automated stenosis grading. However, further external validation using multi-center clinical datasets is required before potential clinical application. This study provides a reproducible framework for computer-assisted assessment of lumbar foraminal and lateral recess stenosis from MRI data.
lumbar spinal stenosis, magnetic resonance imaging, deep learning, ResNet-18, 2.5D multi-slice representation, anatomy-aware classification
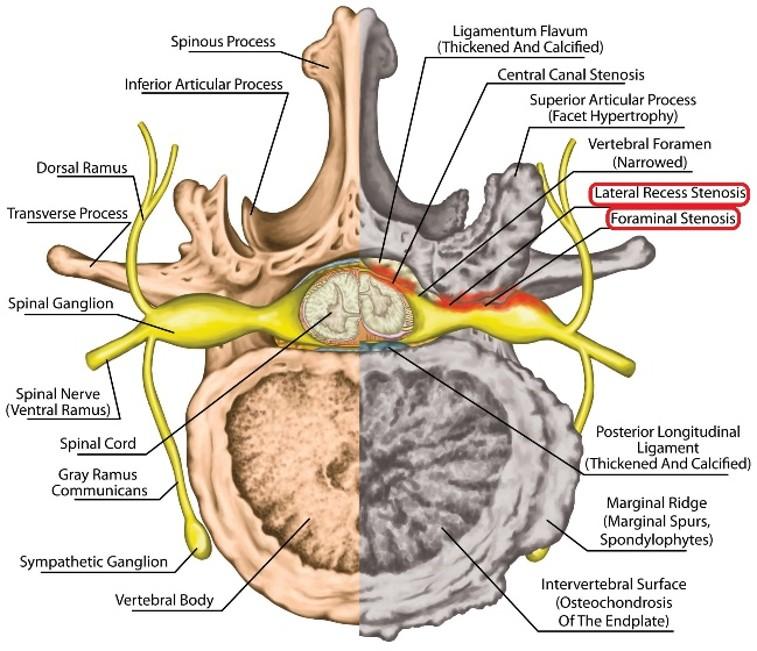
Lumbar foraminal and subarticular (also known as lateral recess) stenosis is a common degenerative condition of the lumbar spine. These conditions are associated with narrowing of the neural exit pathways, which may lead to compression of the exiting or traversing nerve roots, as shown in Figure 1 [1, 2]. Clinically, this compression can result in unilateral radicular pain, sensory disturbances, and motor weakness, depending on the affected disc level and side [3, 4]. Accurate early detection and severity grading are therefore important for appropriate diagnosis and treatment planning. Magnetic resonance imaging (MRI) is the preferred modality for evaluating lumbar degenerative conditions due to its high soft-tissue contrast and its ability to visualize nerve roots, intervertebral discs, and surrounding anatomical structures [5-7].
However, grading these conditions is a challenging and time-consuming process because diagnostically relevant features are distributed across different planes and spatial scales [8-10]. Also, there is variability in interpretation both between different radiologists and within the same radiologist across repeated assessments [11-13].
Recent advances in artificial intelligence (AI), deep learning (DL), and convolutional neural networks (CNNs) have enabled significant progress in medical image classification and pattern recognition [14, 15]. Transfer-learning architectures such as ResNet, DenseNet, and EfficientNet have demonstrated strong performance across a range of radiological tasks [16, 17]. There have been several studies exploring AI-based approaches for lumbar spine MRI analysis, including disc degeneration condition detection, grading, and multi-pathology classification [18, 19]. Nevertheless, automated assessment of foraminal and lateral recess stenosis remains comparatively under-explored due to the increased anatomical complexity, side-dependent nature, and the need for precise level-wise localization [20, 21].
Some of the existing studies regarding lumbar degenerative conditions had several limitations, such as reliance on single-stage classification pipelines, absence of accurate anatomical localization, using only axial or sagittal images, imbalanced datasets, and lack of validation on independent clinical populations [22]. Previous studies reported lower accuracy in detecting and classifying foraminal and lateral recess stenosis.
Although several DL studies have already investigated the automated assessment of lumbar spinal stenosis using different combinations of anatomical localization and image classification. Hallinan et al. [19] developed a DL framework for automated detection and classification of central canal, lateral recess, and neural foraminal stenosis using axial and sagittal MRI, incorporating region-of-interest (ROI) detection followed by CNN-based classification. Their study demonstrated strong agreement with radiologists and included an independent external test cohort, highlighting the feasibility of automated multi-region stenosis assessment. Bharadwaj et al. [18] subsequently proposed a two-stage framework that used V-Net-based segmentation of the dural sac and intervertebral discs, followed by geometry-based localization of the neural foramina and facet joints and downstream classification. Their approach emphasized anatomical interpretability and evaluated both multiclass central canal stenosis and binary foraminal stenosis.
These studies demonstrate that anatomical localization and region-specific analysis can improve the interpretability and performance of automated lumbar stenosis assessment. However, differences remain in the formulation of the classification task, particularly regarding level-wise and side-specific grading of foraminal and lateral recess stenosis, the use of cross-plane spatial information for disc-level mapping, and the incorporation of multi-slice contextual information. These regions are small, anatomically complex, and often differ between the left and right sides [23]. Therefore, accurate localization of the disc level and neural region is essential for reliable severity classification and grading [24].
The novelty of the present work lies not in introducing a new DL architecture, but in the integration of complementary spatial, anatomical, and multi-slice processing steps into a unified framework specifically designed for level-wise and side-wise grading of foraminal and lateral recess stenosis. Digital Imaging and Communications in Medicine (DICOM) spatial metadata are used to establish consistent disc-level correspondence between sagittal and axial MRI sequences, while anatomy-guided ROI extraction focuses the analysis on the relevant neural structures. The problem is formulated independently for the left and right foraminal (LF and RF) and lateral recess regions, reflecting the side-dependent nature of these anatomical structures. In addition, a structured 2.5D representation based on consecutive axial slices centered on the target disc level is employed to incorporate local spatial context.
While the framework uses a standard ResNet-18 architecture and a known 2.5D approach, the contribution lies in integrating these components into a unified, anatomy-aware pipeline for three-class severity grading of foraminal and lateral recess stenosis at individual lumbar disc levels.
In this study, a DL framework is proposed to automatically localize and classify lumbar foraminal and lateral recess stenosis using DICOM-format MRI images. First, a heuristic localization method based on DICOM spatial information was used to identify the intervertebral disc levels. Then, side-specific ROIs were extracted for the neural foramina and lateral recess areas. This helps standardize the input and reduce unnecessary variations. Then, a ResNet-based classifier is trained using a 2.5D MRI representation that integrates information from axial and sagittal T2-weighted images. The purpose of this classifier is to classify stenosis severity into mild, moderate, and severe categories independently for each level and side.
The proposed framework is evaluated using the RSNA 2024 Lumbar Spine Degenerative Classification Challenge dataset. This study aims to address several methodological limitations of previous approaches and evaluate a structured DL framework for automated grading of lumbar foraminal and lateral recess stenosis using MRI data from the RSNA 2024 Lumbar Spine Degenerative Classification Challenge.
This section provides an overview of the data resources used and the methodology adopted to develop a DL-based system for three-class severity classification of lumbar spine stenosis.
2.1 Dataset descriptions
This study utilized a publicly available dataset of lumbar spine MRI scans obtained from the RSNA 2024 Lumbar Spine Degenerative Classification Challenge [25]. All cases were further reviewed by an experienced radiologist to ensure the reliability of the final dataset.
The MRI data were used in their original DICOM format, including both sagittal and axial T2-weighted sequences. Maintaining the data in DICOM format allowed preservation of important spatial and geometric information, which is essential for accurate localization. This approach reduces the risk of information loss and processing errors associated with early image format conversion.
The dataset from the RSNA 2024 Lumbar Spine Degenerative Classification Challenge had several issues. Some cases contained inconsistent labels, incomplete metadata, or missing imaging sequences, requiring careful filtering and validation before use.
In total, the dataset comprised 1,789 patients, from which 15,870 disc-level samples were derived. Each patient contributed five lumbar intervertebral disc levels (L1–L2 through L5–S1), resulting in 3,174 samples per level. Each sample corresponded to a single disc level annotated with a severity grade. The distribution of severity labels included 6,515 mild cases (41.0%), 6,850 moderate cases (43.2%), and 2,505 severe cases (15.8%). For each disc-level sample, left and right ROIs were additionally extracted to represent the foraminal and lateral recess regions.
The corresponding severity distributions for the four region-specific datasets (LF, RF, left subarticular/lateral recess (LS), and right subarticular/lateral recess (RS)) are presented in Table 1. These region-specific distributions reflect the side-specific annotations provided in the original RSNA dataset and were considered during model training.
To address the imbalance in severity distribution, first, samples were constructed at both the disc level and the anatomical side, increasing the representation of different severity categories. Also, during training, balanced mini-batch sampling was employed to reduce bias toward the dominant class. In addition, data augmentation techniques were applied to enhance variability and improve the generalization of the model.
Table 1. Distribution of severity labels across the four region-specific datasets
|
Region |
Mild |
Moderate |
Severe |
Total |
|
LF |
6,420 |
6,910 |
2,540 |
15,870 |
|
RF |
6,510 |
6,850 |
2,510 |
15,870 |
|
LS |
6,180 |
6,970 |
2,720 |
15,870 |
|
RS |
6,250 |
7,020 |
2,600 |
15,870 |
2.2 Data preparation
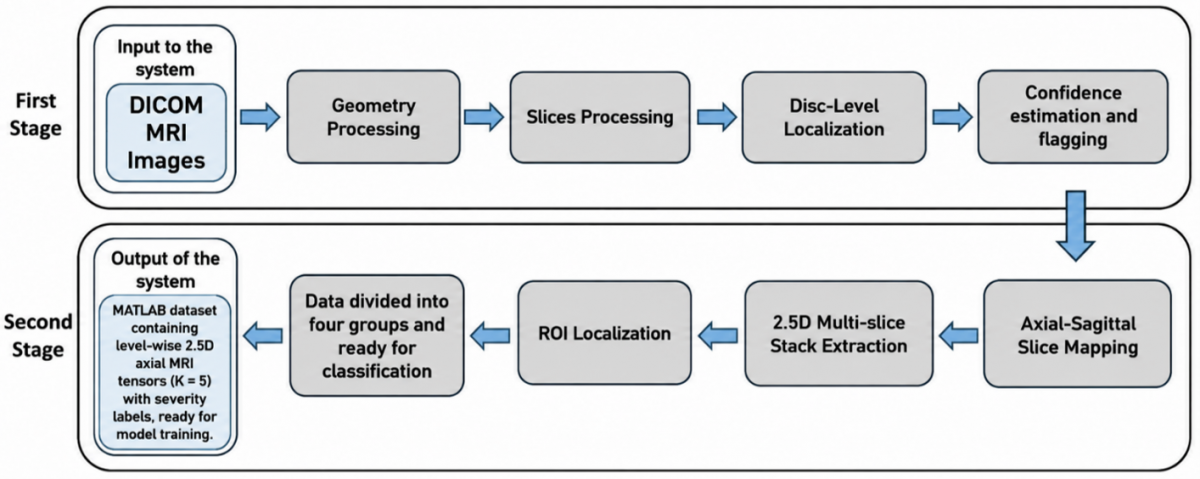
Figure 2 illustrates the overall workflow used for data preparation. In the first stage, lumbar spine MRI data in DICOM format are preprocessed to extract geometric information, correctly order the slices, and identify individual disc levels. A confidence estimation step is then applied to verify the reliability of the detected anatomical levels. The extracted metadata are then used to determine the spatial position and orientation of each slice, ensuring proper alignment between sagittal and axial MRI sequences.
In the second stage, the identified disc levels are mapped across sagittal and axial views. ROIs are then extracted around each disc and represented as 2.5D multi-slice stacks centered on the target disc level. Finally, these samples are organized into structured, level-wise datasets that are ready for model training and classification.
Figure 2. The overall workflow of the data preparation phase
2.3 Methodology
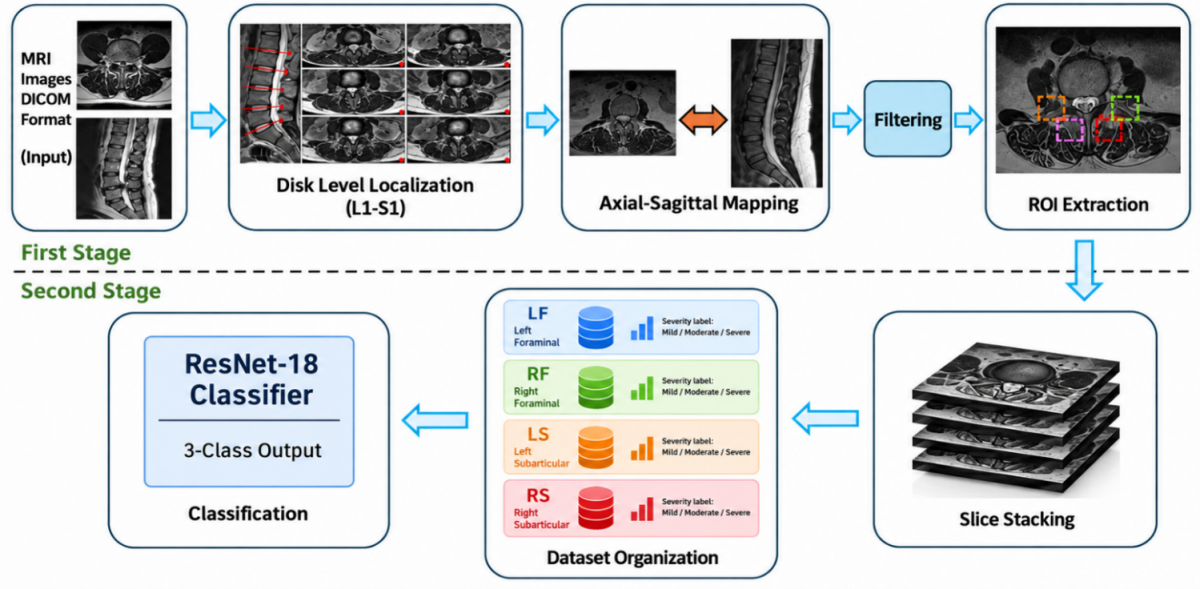
A two-stage pipeline for automated three-class severity classification of lumbar foraminal and lateral recess stenosis from DICOM-format MRI images is proposed in this work.
In the first stage, intervertebral disc levels are identified using DICOM spatial metadata, followed by the extraction of side-specific ROIs corresponding to the foraminal and lateral recess zones. In the second stage, a 2.5D multi-slice representation is constructed and used to train a DL classifier for severity classification into three categories: mild, moderate, and severe. The overall workflow of the proposed work is shown in Figure 3.
Figure 3. The overall workflow of the proposed work
2.3.1 First stage
The first stage consists of four sequential steps: disc-level localization on sagittal T2-weighted images, sagittal-to-axial spatial mapping, confidence estimation, and side-specific ROI extraction. The procedure was implemented using image-intensity information together with the spatial geometry available in the original DICOM files.
(A). Disc-level localization
Sagittal T2-weighted images were used to identify the five lumbar intervertebral disc levels (L1–L2, L2–L3, L3–L4, L4–L5, and L5–S1). When multiple sagittal T2-weighted slices were available, the slice used for localization was selected automatically according to an image-quality score defined as the sum of the normalized image intensity standard deviation and 0.5 times the mean absolute image-gradient magnitude. The sagittal image was then normalized to the range [0,1] and smoothed using a Gaussian filter with a standard deviation of 1.2 pixels.
To identify candidate disc levels, the analysis was restricted to the central 30% of the image width (approximately 35–65%), where the lumbar spinal column is expected to be located. For each image row, the brightest 15% of pixels within this central band were selected, and their mean intensity was calculated, producing a one-dimensional vertical intensity profile. The profile was subsequently smoothed using a 15-pixel moving-average filter. Only the vertical region between approximately 25% and 95% of the image height was considered for peak detection.
(B). Sagittal-axial slice mapping
The detected disc locations were converted from sagittal image pixel coordinates to patient-space coordinates using the DICOM Image Position Patient (IPP), Image Orientation Patient (IOP), and Pixel Spacing parameters. For a detected pixel position ((x,y)), the corresponding three-dimensional patient-space coordinate (P) was calculated as:
$P=I P P+(x-1) {Col} \Delta x+(y-1) R o w \Delta y$
where, Row and Col are the row and column direction-cosine vectors obtained from IOP, and (Δx) and (Δy) are the corresponding pixel-spacing values.
For the axial T2-weighted series, the normal vector of the axial imaging plane was calculated from the cross product of the row and column direction-cosine vectors:
$n_{{axial}}=\frac{{Row} * {Col}}{\| {Row} * {Col} \|}$
For each detected disc-level coordinate Pdisc, the perpendicular spatial distance to every axial slice was then calculated as:
$D_i=\left|\left(I P P_i-P_{{disc}}\right) \cdot n_{{axial}}\right|$
where, IPPi denotes the IPP of the i-th axial slice. The axial slice having the minimum distance diwas selected as the center slice corresponding to the detected disc level. Five consecutive axial slices were subsequently selected around this center slice, consisting of the center slice and two neighboring slices on either side. This procedure establishes the spatial correspondence between the sagittal localization and the axial classification images without relying on image filename ordering.
(C). Confidence estimation
A localization confidence score was calculated to quantify the reliability of the automatically detected five disc levels. The score combines the strength of the detected intensity peaks with the consistency of the vertical spacing between consecutive detected levels.
The peak-strength component was calculated as:
$S_{\text {peak}}=\frac{\text {mean}\left(R_{\text {loc}}\right)}{\text { mean}\left(R_{\text {search}}\right)}$
where, Rloc represents the row-intensity scores at the five selected locations and Rsearch represents the scores throughout the permitted search region.
The spacing-consistency component was calculated as:
$S_{\text {spacing }}=1-\frac{\operatorname{std}(\Delta r)}{\operatorname{mean}(\Delta r)+\varepsilon}$
where, Δr denotes the vertical distances between consecutive detected levels. The final confidence score was constrained to the range [0,1] by clamping each component before combining them with equal weights:
$C=0.5~ clamp_{[0,1]}\left(S_{\text {peak}}\right)+0.5 ~clamp_{[0,1]}\left(S_{\text {spacing}}\right)$
A minimum confidence threshold of 0.55 was used for quality-control flagging. Cases with (C < 0.55) were marked as low-confidence and recorded in the processing log for subsequent quality assessment. DICOM series for which the required spatial geometry could not be read, or for which an adequate number of axial slices was unavailable, were not processed for level-wise extraction.
(D). ROI extraction
Following axial slice selection, side-specific ROIs were extracted separately for the left and right lateral recess regions. The ROI definitions were based on fixed image-relative anatomical regions rather than a separately trained segmentation model.
For foraminal stenosis, the image midpoint was used as the left–right reference. The ROI width was set to approximately 45% of the half-image width, with a vertical extent from approximately 22% to 80% of the image height. The left and right ROIs were shifted laterally by approximately 20% of the half-image width to position the crops over the corresponding foraminal regions.
For subarticular/lateral recess stenosis, the ROI width was set to approximately 70% of the half-image width, with a vertical extent from approximately 18% to 85% of the image height. The image midpoint separated the left and right ROIs.
The four resulting anatomical regions were therefore defined as: (1) LF, (2) RF, (3) LS, and (4) RS. Extracting these regions separately provides side-specific inputs and reduces the amount of irrelevant background information presented to the classification models.
2.3.2 Second stage
In the second stage of the proposed work, a 2.5D representation is constructed, and the classification begins after organizing the input data into four groups.
(A). 2.5D multi-slice representation
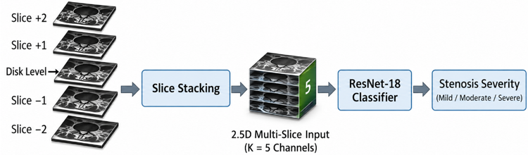
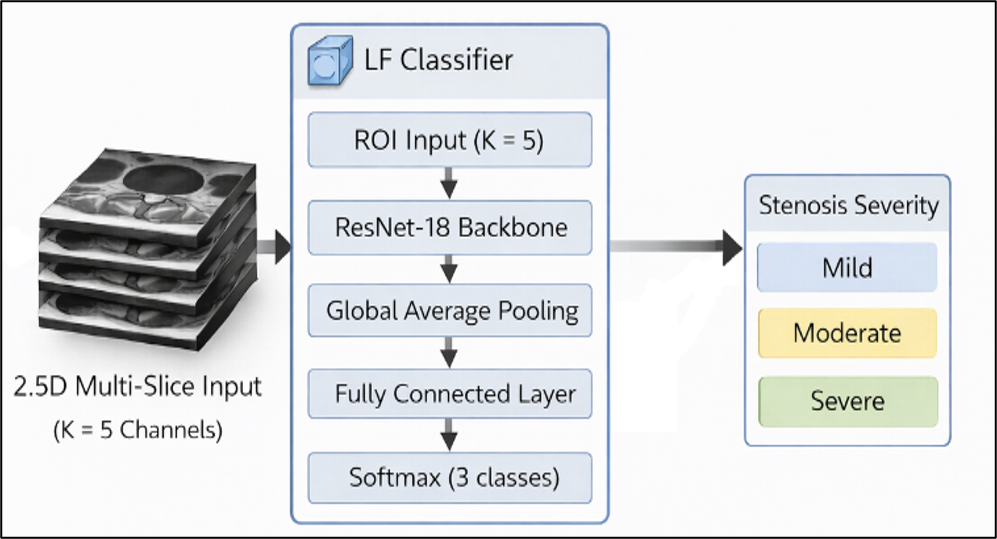
A 2D model processes a single slice and ignores information from neighboring slices, while a 3D model analyzes the entire volume and requires high computational resources. The proposed approach, referred to as 2.5D, uses several adjacent slices stacked together, allowing the model to capture limited depth information while still applying 2D convolutions. This step is illustrated in Figure 4.
Figure 4. Illustration of the 2.5D magnetic resonance imaging (MRI) input used for classification
For each disc level, a stack of K = 5 consecutive axial T2-weighted slices centered at the disc plane is extracted. These slices are combined to form a multi-channel input. The proposed approach uses axial slices for classification, and sagittal slices help identify the correct disc level.
(B). Dataset organization
After ROI extraction, the dataset is divided into four independent region-specific subsets corresponding to LF, RF, LS, and RS. Each sample includes:
•Disc level
•Anatomical side
•Severity label (mild, moderate, severe) from the corresponding severity annotation in the original RSNA dataset.
This structured organization allows each model to learn region-specific characteristics effectively.
(C). Deep feature extraction and classification
A CNN based on ResNet-18 was employed for severity classification. ResNet-18 was chosen because it can learn important image patterns effectively without being too complex. Compared to heavier models, ResNet-18 requires less computational power and memory, making it appropriate for our dataset size and hardware setup. Figure 5 shows the ResNet-18 model with a 2.5D input approach.
Figure 5. ResNet-18 model with 2.5D approach
To accommodate the 2.5D input:
•The first convolutional layer is modified to accept five input channels instead of three.
•The final fully connected layer is replaced with a three-class classifier.
•A softmax activation function is used to produce class probabilities.
The same network architecture is trained separately on each region-specific dataset (LF, RF, LS, RS), resulting in four specialized classifiers.
The four ResNet-18 classifiers were trained for 30 epochs using Adam, with an initial learning rate of 3 × 10⁻⁴ and a mini-batch size of 15. Balanced sampling and focal loss (γ = 1.0) were used to address class imbalance, with gradient clipping applied for training stability. Pretrained ResNet-18 weights were used, while the input and final classification layers were modified for the 5-channel input and three-class output. Training was implemented in MATLAB R2024b using dlnetwork and MAT-file streaming on a PC equipped with an 11th-generation Intel Core i5-1145G7 processor and 16 GB RAM, running Windows 11 Pro.
The dataset is split at the patient level into:
•70% training
•15% validation
•15% testing
To address class imbalance:
•Balanced mini-batch sampling was used during training to reduce bias toward the dominant class.
•Data augmentation is performed on-the-fly. Data augmentation was applied only to the training set. Small rotations, shifts, brightness changes, and horizontal flips were used to increase image variability. These transformations were applied to increase image variability while preserving the relevant anatomical and pathological characteristics of the original images. The RSNA dataset includes MRI examinations acquired using different scanner configurations, providing some degree of acquisition heterogeneity; however, scanner-related variability was not systematically analyzed in the present study.
Training is conducted using a custom MATLAB dlnetwork loop with MAT-file streaming, enabling efficient handling of large datasets without exceeding memory limitations.
Model performance is monitored using:
•Training loss
•Validation accuracy
•Validation prediction distribution
The model achieving the highest validation Macro-F1 score is selected for final evaluation.
This section presents the experimental evaluation of the proposed framework for classification of stenosis in lumbar spine MRI images of the foraminal and lateral recess. First, the evaluation metrics used to quantify model performance are described. The training process is then examined to check for convergence behavior and ensure stable and consistent learning across epochs. Finally, confusion matrix analysis and per-class performance are presented to provide an understanding of classification behavior across severity levels.
3.1 Evaluation metrics
Model performance was assessed using standard classification measures obtained from the confusion matrix [26]:
Accuracy $=\frac{\mathrm{TP}+\mathrm{TN}}{\mathrm{TP}+\mathrm{TN}+\mathrm{FP}+\mathrm{FN}}$
Precision $=\frac{\mathrm{TP}}{\mathrm{TP}+\mathrm{FP}}$
Sensitivity $=\frac{\mathrm{TP}}{\mathrm{TP}+\mathrm{FN}}$
$F1-Score =\frac{2 \times(\text {Sensitivity} \text {×} \text {Precision})}{\text {Sensitivity}+ \text {Precision}}$
These metrics are calculated per class and averaged to obtain the overall performance of the model.
3.2 Training convergence
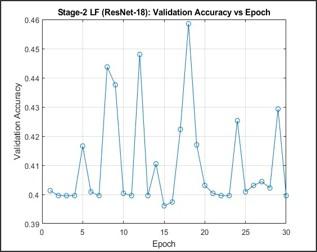
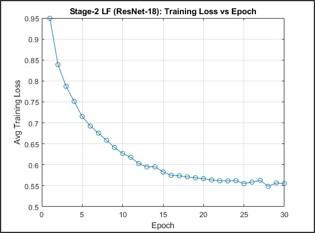
All four region-specific models (LF, RF, LS, and RS) showed stable training over the 30 epochs. Training loss gradually decreased, and the validation accuracy remained stable without collapsing to a single class. This indicates that balanced mini-batch sampling and data augmentation helped reduce class imbalance and resulted in stable learning. The model with the highest validation Macro-F1 score was selected for final testing. Training curves for the LF model are shown in Figures 6 and 7 and represent the similar behavior observed in all models.
Figure 6. Validation accuracy as a function of epoch for the left foraminal (LF) model
Figure 7. Training loss as a function of epoch for the left foraminal (LF) model
3.3 Overall test performance
Table 2 summarizes the performance of the four classifiers on test datasets.
The LF model achieved an accuracy of 81.47%, a Macro-F1 score of 0.818, and balanced accuracy of 0.822, with Cohen’s kappa of 0.704, indicating strong agreement with ground-truth labels. The RF model achieved 81.06% accuracy and 0.812 Macro-F1. The lateral recess models showed slightly lower performance, with the LS model having 78.41% accuracy and 0.782 Macro-F1, while the RS model had 79.74% accuracy and 0.797 Macro-F1.
Overall, test accuracy ranged from 78.41% to 81.47%, and Macro-F1 ranged from 0.782 to 0.818, showing consistent performance across anatomical regions.
Table 2. Overall test performance of the four models
|
Model |
Accuracy |
Macro-F1 |
Balanced Accuracy |
Weighted-F1 |
Kappa |
|
LF |
0.8147 |
0.8182 |
0.8224 |
0.8145 |
0.7045 |
|
RF |
0.8106 |
0.8123 |
0.8186 |
0.8105 |
0.6975 |
|
LS |
0.7841 |
0.7819 |
0.7890 |
0.7842 |
0.6544 |
|
RS |
0.7974 |
0.7968 |
0.8035 |
0.7974 |
0.6758 |
3.4 Confusion matrix analysis
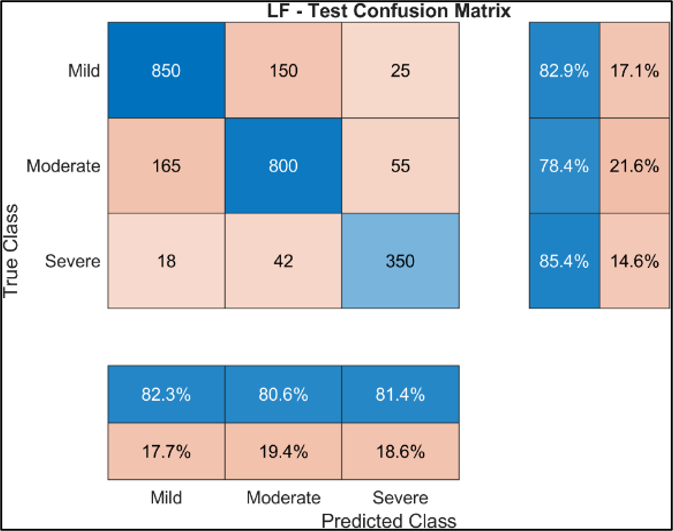
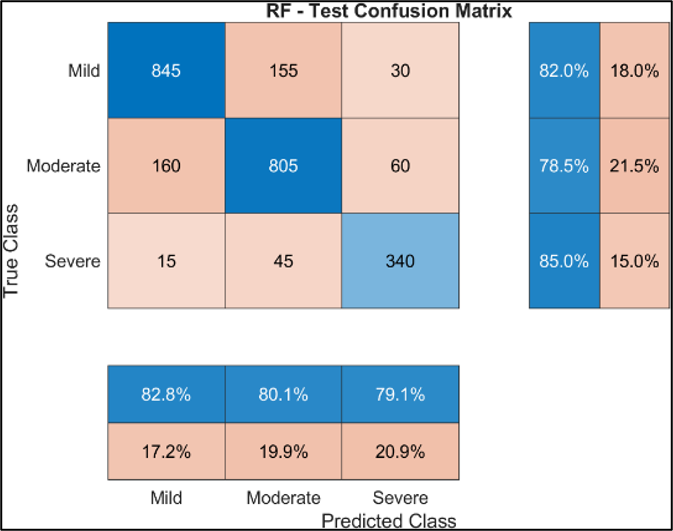
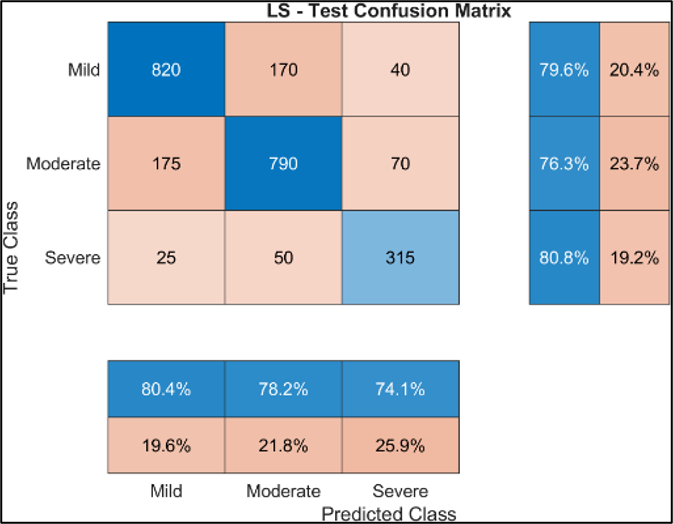
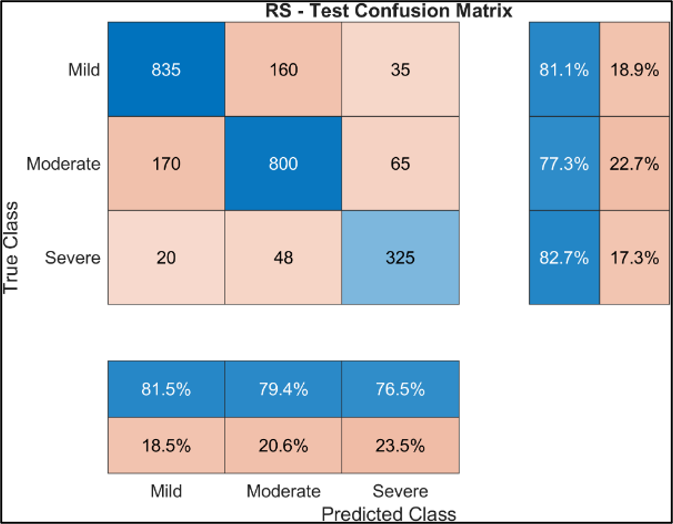
The confusion matrices (Figures 8–11) show that most samples were correctly classified, with predictions mainly along the main diagonal. Most errors occurred between neighboring severity levels, especially between mild and moderate stenosis. This reflects the gradual progression of degenerative changes and the similarity in appearance of MRI images.
Severe stenosis showed higher recall across the four models than the other severity categories. Confusion between mild and severe cases was less frequent than errors between adjacent severity levels.
Figure 8. Left foraminal (LF) confusion matrix
Figure 9. Right foraminal (RF) confusion matrix
Figure 10. Left subarticular/lateral recess (LS) confusion matrix
Figure 11. Right subarticular/lateral recess (RS) confusion matrix
3.5 Per-class performance
Per-class model performance is shown in Table 3. The F1-scores varied across severity categories and anatomical regions, indicating differences in classification performance between classes.
Moderate stenosis generally showed lower F1-scores than mild stenosis across the four models, although the relative performance varied by anatomical region. These variations indicate that classification performance was dependent on both severity category and anatomical region.
Table 3. Per-class F1-scores for severity classification
|
Model |
Mild |
Moderate |
Severe |
|
LF |
0.826 |
0.795 |
0.833 |
|
RF |
0.824 |
0.793 |
0.819 |
|
LS |
0.800 |
0.774 |
0.771 |
|
RS |
0.813 |
0.784 |
0.794 |
This study proposes a DL framework for automated classification of lumbar foraminal and lateral recess stenosis using MRI images. The proposed system achieved a mean test accuracy of 80.17% and a mean Macro-F1 score of 0.802 for all four independent anatomical regions.
There is slightly better performance in the foraminal models compared with the lateral recess models, which may be due to anatomical differences. The neural foramen is more clearly defined on MRI images, while the lateral recess shows more complex and variable anatomy, making it more challenging to classify. This increased anatomical complexity in lateral recess narrowing may explain the slight reduction in performance in left and right lateral recess models.
Confusion matrices show that misclassifications mainly occurred between adjacent severity levels (mild-moderate and moderate-severe). This is clinically reasonable because stenosis severity level changes gradually rather than in clearly separated categories. The confusion matrices show that misclassifications between mild and severe stenosis were relatively infrequent compared with errors involving adjacent severity categories.
Previous studies have demonstrated the feasibility of automated lumbar stenosis assessment using DL and anatomical localization. Hallinan et al. [19] developed a two-component framework using ROI detection followed by CNN-based classification for central canal, lateral recess, and neural foraminal stenosis, with four-level severity grading and independent external testing. Bharadwaj et al. [18] subsequently used anatomical segmentation and geometric localization followed by DL classification, with an emphasis on interpretable assessment of central canal stenosis and binary classification of neural foraminal stenosis.
Table 4 summarizes the main differences between the proposed framework and previous deep-learning studies for automated lumbar spinal stenosis assessment.
Previous studies have established anatomical localization and region-specific classification for automated lumbar stenosis assessment. The proposed work builds on these approaches by integrating DICOM-based spatial correspondence, anatomy-guided side-specific ROI extraction, and a structured 2.5D representation for independent LF, RF, LS, and RS grading. Thus, the main contribution lies in the integration and task-specific formulation of these components rather than in introducing a new DL architecture.
Table 4. Comparison of the proposed framework with previous studies
|
Aspect |
Hallinan et al. [19] |
Bharadwaj et al. [18] |
The Proposed Work |
|
Dataset |
446 patients + 100 external test patients |
200 patients |
1,789 patients / 15,870 disc-level samples |
|
Main target |
Central canal + lateral recess + neural foraminal stenosis |
Central canal + neural foraminal stenosis + facet arthropathy |
Neural foraminal + lateral recess stenosis |
|
Side-specific classification |
Side-specific regions assessed, but not formulated as four independent side-specific models |
Not formulated as four independent side-specific tasks |
LF, RF, LS, and RS independently |
|
Severity |
Normal / Mild / Moderate / Severe |
Central canal: 4 grades; foraminal: binary |
Mild / Moderate / Severe |
|
Localization |
Faster R-CNN / ResNet-101 ROI detection |
V-Net segmentation + geometric localization + landmark regression |
DICOM spatial metadata + disc-level mapping |
|
Cross-plane mapping |
Axial T2 + sagittal T1 imaging; no explicit DICOM-based cross-plane mapping |
Sagittal landmark regression used to identify corresponding axial levels |
DICOM IPP/IOP-based axial–sagittal spatial mapping |
|
Classification input |
Detected ROI patches |
Localized axial patches |
Five consecutive axial slices / 2.5D representation |
|
Classifier |
Custom CNN |
BiT CNN (BiT ResNet-based) |
ResNet-18 with 5-channel input |
|
Evaluation |
Gwet's κ, sensitivity, specificity |
AUROC, accuracy, weighted Cohen's κ |
Accuracy, Macro-F1, balanced accuracy, weighted-F1, Cohen's κ |
|
Test performance |
Four-class Gwet's κ: 0.72 (lateral recess) and 0.75 (neural foraminal) internally; 0.77 and 0.83, respectively, externally |
Central canal: κ = 0.54 with BiT CNN; foraminal AUROC = 0.92 |
78.41–81.47% accuracy; Macro-F1 = 0.782–0.818 |
Note: BiT = Big Transfer, CNN = convolutional neural network, ROI = region-of-interest, DICOM = Digital Imaging and Communications in Medicine, IPP = Image Position Patient, IOP = Image Orientation Patient, LF = left foraminal, RF = right foraminal, LS = left subarticular/lateral recess, RS = right subarticular/lateral recess.
Although direct numerical comparison is not appropriate because of differences in datasets, grading schemes, and evaluation metrics, the results demonstrate that the proposed framework can achieve consistent three-class classification performance across four anatomically distinct regions. The mean Macro-F1 of 0.802, together with the relatively narrow range of performance across the four models, suggests that the proposed spatially guided formulation provides a consistent basis for automated assessment of foraminal and lateral recess stenosis.
The present evaluation used a single patient-level 70%/15%/15% train-validation-test split. While this prevents patient-level data leakage, a single split does not assess variability across different partitions. Future work will evaluate repeated patient-level splits or cross-validation to further assess model robustness and generalizability.
The present study should be interpreted as a retrospective technical evaluation rather than a clinical validation study. Although the RSNA 2024 Lumbar Spine Degenerative Classification Challenge dataset provides a relatively large and standardized benchmark for evaluating the proposed framework, performance on a benchmark dataset does not necessarily represent performance in routine clinical practice. In particular, this study did not include external validation using independent hospital or multi-center datasets, systematic analysis of scanner- and institution-related variability, or prospective evaluation within a clinical workflow. Potential uncertainty or variability in the original severity annotations should also be acknowledged, as independent multi-reader agreement was not systematically evaluated in this study. Therefore, the reported results demonstrate the technical feasibility and consistency of the proposed approach but do not establish clinical effectiveness or readiness for deployment as a radiological decision-support system. Future work should evaluate the framework on independent datasets acquired from different institutions and MRI scanners and should include prospective clinical testing to assess robustness, generalizability, and practical utility.
In this study, a multi-stage DL framework was developed for automated classification of lumbar spine MRI images for foraminal and lateral recess stenosis. The proposed method uses geometry-based disc-level localization, side-specific region extraction, and a 2.5D ResNet-18 classifier to enable level-wise and side-wise stenosis severity assessment.
Experimental evaluation on data derived from the RSNA 2024 Lumbar Spine Degenerative Classification Challenge demonstrated stable and consistent performance across all four anatomical regions. The models achieved test accuracy ranging from 78.41% to 81.47%, with an average Macro-F1 score of approximately 0.80. Misclassifications were predominantly observed between adjacent severity grades, whereas severe cases were identified with relatively high reliability.
The main contribution of this work is the development of an anatomy-aware pipeline that integrates DICOM-based localization, side-specific analysis, and structured 2.5D input for classifying foraminal and lateral recess stenosis.
The results suggest that combining anatomical localization with region-specific classification helps focus the analysis on clinically relevant areas, reducing input variability and improving feature learning. Although the proposed framework targets small and anatomically complex structures such as the neural foramina and lateral recess, the achieved performance is comparable to previously reported methods.
Overall, the proposed framework demonstrates the technical feasibility of automated, anatomy-aware classification of foraminal and lateral recess stenosis on lumbar MRI. However, the present evaluation was performed retrospectively using the RSNA 2024 benchmark dataset and does not establish clinical validity or readiness for clinical deployment. External multi-center validation, assessment across different MRI scanners and acquisition settings, and prospective clinical evaluation are required to determine the generalizability and clinical utility of the proposed framework. Future work will focus on extending the method to additional degenerative conditions and validating its generalizability on larger, multi-center datasets.
|
dᵢ |
perpendicular distance from disc-level coordinate to axial slice i |
|
Δr |
vertical distance between consecutive detected disc levels |
|
Δx, Δy |
pixel-spacing values in the row and column directions |
|
IPP |
Image Position Patient |
|
IOP |
Image Orientation Patient |
|
K |
number of consecutive axial slices in the 2.5D input |
|
naxial |
normal vector of the axial imaging plane |
|
P |
three-dimensional patient-space coordinate |
|
Rloc |
row-intensity scores at the selected disc-level locations |
|
Rsearch |
row-intensity scores throughout the permitted search region |
|
Speak |
peak-strength component of localization confidence |
|
Sspacing |
spacing-consistency component of localization confidence |
|
γ |
focal-loss parameter, dimensionless |
[1] Genevay, S., Atlas, S.J. (2010). Lumbar spinal stenosis. Best Practice & Research Clinical Rheumatology, 24(2): 253-265. https://doi.org/10.1016/j.berh.2009.11.001
[2] Cohen, S.P., Raja, S.N. (2007). Pathogenesis, diagnosis, and treatment of lumbar zygapophysial (facet) joint pain. Anesthesiology, 106(3): 591-614. https://doi.org/10.1097/00000542-200703000-00024
[3] Bartynski, W.S., Lin, L. (2003). Lumbar root compression in the lateral recess: MR imaging, conventional myelography, and CT myelography comparison with surgical confirmation. American Journal of Neuroradiology, 24(3): 348-360. https://www.ajnr.org/content/24/3/348.
[4] Alsaleh, K., Ho, D., Rosas-Arellano, M.P., Stewart, T.C., Gurr, K.R., Bailey, C.S. (2017). Radiographic assessment of degenerative lumbar spinal stenosis: Is MRI superior to CT? European Spine Journal, 26(2): 362-367. https://doi.org/10.1007/s00586-016-4724-9
[5] Modic, M.T., Ross, J.S. (2007). Lumbar degenerative disk disease. Radiology, 245(1): 43-61. https://doi.org/10.1148/radiol.2451051706
[6] Huber, F.A., Stutz, S., de Martini, I.V., et al. (2019). Qualitative versus quantitative lumbar spinal stenosis grading by machine learning supported texture analysis—Experience from the LSOS study cohort. European Journal of Radiology, 114: 45-50. https://doi.org/10.1016/j.ejrad.2019.02.023
[7] Lee, G.Y., Lee, J.W., Choi, H.S., Oh, K.J., Kang, H.S. (2011). A new grading system of lumbar central canal stenosis on MRI: An easy and reliable method. Skeletal Radiology, 40(8): 1033-1039. https://doi.org/10.1007/s00256-011-1102-x
[8] Sollmann, N., Fields, A.J., O’Neill, C., et al. (2023). Magnetic resonance imaging of the lumbar spine: Recommendations for acquisition and image evaluation from the BACPAC spine imaging working group. Pain Medicine, 24(Supplement_1): S81-S94. https://doi.org/10.1093/pm/pnac130
[9] Hosny, A., Parmar, C., Quackenbush, J., Schwartz, L.H., Aerts, H.J. (2018). Artificial intelligence in radiology. Nature Reviews Cancer, 18(8): 500-510. https://doi.org/10.1038/s41568-018-0016-5
[10] Erel, M.S., Aljobouri, H., Ermeydan, E.S., Çankaya, I. (2024). Design of MATLAB-based radiomics classifier training simulator powered by PyRadiomics. Al-Nahrain Journal for Engineering Sciences, 27(2): 185-192. https://doi.org/10.29194/NJES.27020185
[11] Miskin, N., Gaviola, G.C., Huang, R.Y., et al. (2020). Intra-and intersubspecialty variability in lumbar spine MRI interpretation: A multireader study comparing musculoskeletal radiologists and neuroradiologists. Current Problems in Diagnostic Radiology, 49(3): 182-187. https://doi.org/10.1067/j.cpradiol.2019.05.003
[12] Aljobouri, H.K. (2023). Independent component analysis with functional neuroscience data analysis. Journal of Biomedical Physics & Engineering, 13(2): 169-180. https://doi.org/10.31661/jbpe.v0i0.2111-1436
[13] Singh, A., Sengupta, S., Lakshminarayanan, V. (2020). Explainable deep learning models in medical image analysis. Journal of Imaging, 6(6): 52. https://doi.org/10.3390/jimaging6060052
[14] LeCun, Y., Bengio, Y., Hinton, G. (2015). Deep learning. Nature, 521(7553): 436-444. https://doi.org/10.1038/nature14539
[15] Al Arif, S.M.R., Knapp, K., Slabaugh, G. (2018). Fully automatic cervical vertebrae segmentation framework for X-ray images. Computer Methods and Programs in Biomedicine, 157: 95-111. https://doi.org/10.1016/j.cmpb.2018.01.006
[16] Shen, D., Wu, G., Suk, H.I. (2017). Deep learning in medical image analysis. Annual Review of Biomedical Engineering, 19: 221-248. https://doi.org/10.1146/annurev-bioeng-071516-044442
[17] Forsberg, D., Sjöblom, E., Sunshine, J.L. (2017). Detection and labeling of vertebrae in MR images using deep learning with clinical annotations as training data. Journal of Digital Imaging, 30(4): 406-412. https://doi.org/10.1007/s10278-017-9945-x
[18] Bharadwaj, U.U., Christine, M., Li, S., et al. (2023). Deep learning for automated, interpretable classification of lumbar spinal stenosis and facet arthropathy from axial MRI. European Radiology, 33(5): 3435-3443. https://doi.org/10.1007/s00330-023-09483-6
[19] Hallinan, J.T.P.D., Zhu, L., Yang, K., et al. (2021). Deep learning model for automated detection and classification of central canal, lateral recess, and neural foraminal stenosis at lumbar spine MRI. Radiology, 300(1): 130-138. https://doi.org/10.1148/radiol.2021204289
[20] Park, H.J., Kim, S.S., Lee, S.Y., et al. (2012). Clinical correlation of a new MR imaging method for assessing lumbar foraminal stenosis. American Journal of Neuroradiology, 33(5): 818-822. https://doi.org/10.3174/ajnr.A2870
[21] England, J.R., Cheng, P.M. (2019). Artificial intelligence for medical image analysis: A guide for authors and reviewers. American Journal of Roentgenology, 212(3): 513-519. https://doi.org/10.2214/AJR.18.20490
[22] Mazurowski, M.A., Buda, M., Saha, A., Bashir, M.R. (2019). Deep learning in radiology: An overview of the concepts and a survey of the state of the art with focus on MRI. Journal of Magnetic Resonance Imaging, 49(4): 939-954. https://doi.org/10.1002/jmri.26534
[23] Galbusera, F., Casaroli, G., Bassani, T. (2019). Artificial intelligence and machine learning in spine research. JOR Spine, 2(1): e1044. https://doi.org/10.1002/jsp2.1044
[24] Zhou, Y., Liu, Y., Chen, Q., Gu, G., Sui, X. (2019). Automatic lumbar MRI detection and identification based on deep learning. Journal of Digital Imaging, 32(3): 513-520. https://doi.org/10.1007/s10278-018-0130-7
[25] Richards, T.J., Flanders, A.E., Colak, E., et al. (2026). The RSNA lumbar degenerative imaging spine classification (LumbarDISC) dataset. Radiology: Artificial Intelligence, 8(2): e250480. https://doi.org/10.1148/ryai.250480
[26] Powers, D.M.W. (2011). Evaluation: From precision, recall and f-measure to roc, informedness, markedness & correlation. Journal of Machine Learning Technologies, 2(1): 37-63. https://doi.org/10.9735/2229-3981