
Fatma Sukmawati* | Sari Trisnaningsih | Ratna Juwita | Jovita Ridhani | Siti Aflahah
© 2026 The authors. This article is published by IIETA and is licensed under the CC BY 4.0 license (http://creativecommons.org/licenses/by/4.0/).
OPEN ACCESS
Embedded assessment is useful only when interaction records preserve how each response was reached. This study presents the design and initial evaluation of Bintang Sains, a browser-based science learning system for junior secondary students with mild intellectual disabilities in Indonesian special schools. Using a design-and-development research approach and the Media Development Life Cycle (MDLC), requirements were elicited from 19 teachers at one special school and translated into a system combining multimodal science content, embedded quizzes, and attempt-level interaction logging. Each response is stored as a separate record containing the selected option, attempt ordinal, correctness, and response latency. Four media experts and four content experts evaluated the system; both panels returned an overall Aiken’s V of 0.96. User-response testing involved 20 students from two other schools during a single 25-minute session. The mean rating was 3.91 on a four-point scale, and 15 students (75%) completed the activities without teacher assistance. Technical checks showed an initial load time of 2.4 s over a 10 Mbps connection; the system remained functional offline during an open session. The findings support initial content relevance, acceptability, and technical feasibility, but do not establish learning gains, diagnostic validity, or sustained engagement. The schema preserves reattempts and response latency but does not record teacher assistance, narration use, or navigation history. Larger, longer-term studies across schools are needed before these records can support claims about learner competence or educational effectiveness.
attempt-level data logging, data modelling, embedded assessment, intellectual disabilities, special education, web-based science learning
Most educational software assumes that students read fluently, can attend for a fixed period, and have reliable devices and internet access. Where these assumptions fail, the software becomes difficult or impossible to use, as is often the case in Indonesian special schools (Sekolah Luar Biasa, SLB). In these schools, junior secondary students with mild intellectual disabilities learn science (Ilmu Pengetahuan Alam, IPA) from dense explanatory texts and are assessed in inflexible formats. The cognitive demands of these materials frequently exceed the working memory and processing abilities typical of this group [1]. The Ministry of Primary and Secondary Education reports 245,350 students with disabilities among the 50,409,242 students enrolled in Indonesian education in 2025 [2]. At this scale, accessibility has to be handled as an engineering requirement in its own right.
Specialized software rarely reaches these schools, and reviews of educational technology in low- and middle-income settings attribute this mainly to installation, maintenance, and hardware [3]. A workable system has to solve two problems at once. Its presentation layer must give access to content without depending on the ability to decode text, and its deployment must tolerate low-cost, mismatched devices with no technical administration. Game-based design helps with the first problem. Digital games produce moderate learning gains [4, 5], gamified mechanics bring cognitive and motivational benefits [6], and the elements responsible are well catalogued [7]. For learners with intellectual disabilities, however, these elements have mostly been used to teach functional and daily-living skills [8-10], and platforms for school subjects are rare [11].
The second problem concerns architecture. In the few tools that teach academic content to this population, assessment usually sits outside the learning flow, and what a learner did while studying is stored apart from what they answered afterwards. Assessment designs that draw evidence from the activity itself have been proposed to close this gap [12], yet their success depends on how the data are modeled and stored, and published systems seldom report these decisions. The requirements that follow are technical as well as instructional. They include installation-free deployment, delivery of every content unit as text, image, and synthesized speech, item-level interaction kept as data rather than as a single score, and data handling that complies with the rules for minors with disabilities. No published system combining these features for Indonesian special education was found.
This paper describes such a system. Bintang Sains (“Science Star”) delivers science content aligned with the curriculum of special junior secondary schools (Sekolah Menengah Pertama Luar Biasa, SMPLB) through multimodal cards, synthesized narration, a penalty-free embedded assessment module, and a progress and reward subsystem. Its assessment subsystem is treated as a matter of data design. The study specifies and implements an attempt-level schema but does not fit a learner or competency model to the resulting data. Following design-and-development research [13], the study is limited to requirements elicitation, construction, expert validation, and a first round of user-response testing; learning effectiveness, diagnostic accuracy, and long-term engagement are not evaluated. The paper addresses four questions. What system requirements emerge from a needs analysis with special education teachers? What architecture, data model, and process model satisfy them? How do media and content experts judge the relevance and suitability of the implemented system? And how do the intended users respond to it in a first session?
2.1 Web-based systems as accessible learning infrastructure
Browser delivery has practical consequences for deployment. Nothing has to be installed on each device, no administrative privileges are required, and a responsive build adapts to whatever screen is available. Reviews of educational technology for learners with disabilities in low- and middle-income countries identify infrastructure and maintenance burden as the main constraint on sustained use [3]. Special education has moved from purpose-built hardware towards general-purpose devices [14], including consumer tablets [15]; browser delivery removes the remaining dependence on a particular device or operating system.
Pairing words with relevant imagery and routing verbal information through the ear spreads processing across two channels [16]. Universal Design for Learning builds on this idea through principles of multiple means of representation and engagement [17]; its benefits are reported but rarely tested rigorously [18]. Most of this literature is conceptual [19] or set in higher education [20], and it covers lessons [21] and teacher preparation [22] far more often than software. Text-to-speech support improves comprehension, but the gain depends on baseline decoding skill [23], which argues for making narration optional.
2.2 Embedded assessment as an interaction data problem
Embedded assessment gathers evidence continuously from ordinary interaction rather than through a separate instrument [12]. Once assessment is embedded, the interaction log becomes the evidence base. This works only if the data model stores individual attempts, each linked to an item, the response given, and the time taken, in addition to outcomes. Cano et al. [8] showed that telemetry such as task-completion time and error frequency validly indicates skill acquisition among users with intellectual disabilities, and game design taxonomies treat assessment as part of the design [7]. The assessment subsystem is thus a data management component whose schema limits later inference: a final score alone cannot support analyses of reattempts or response latency.
2.3 Research gaps
Three gaps remain. Reviews of game-based learning for students with intellectual disabilities find school subjects underrepresented and assessment integration weak [9, 10]. Published systems rarely describe architecture, data models, or technical evaluation, which makes them hard to replicate. Regulatory questions are rarely discussed, even though such systems log data from minors with disabilities, whom Indonesian Law No. 27 of 2022 on Personal Data Protection singles out for stronger protection. In schools, it is the teacher who operates the system, so teacher-facing requirements belong in the specification as well. Perceived usefulness and ease of use predict information system adoption [24], including teachers' classroom technology use [25], and Indonesian teachers' adoption of online assessment depends on facilitating conditions and performance expectancy [26]. These constructs informed only the requirements questionnaire and requirements N1, N2 and R8, not the assessment design.
3.1 Research design and development methodology
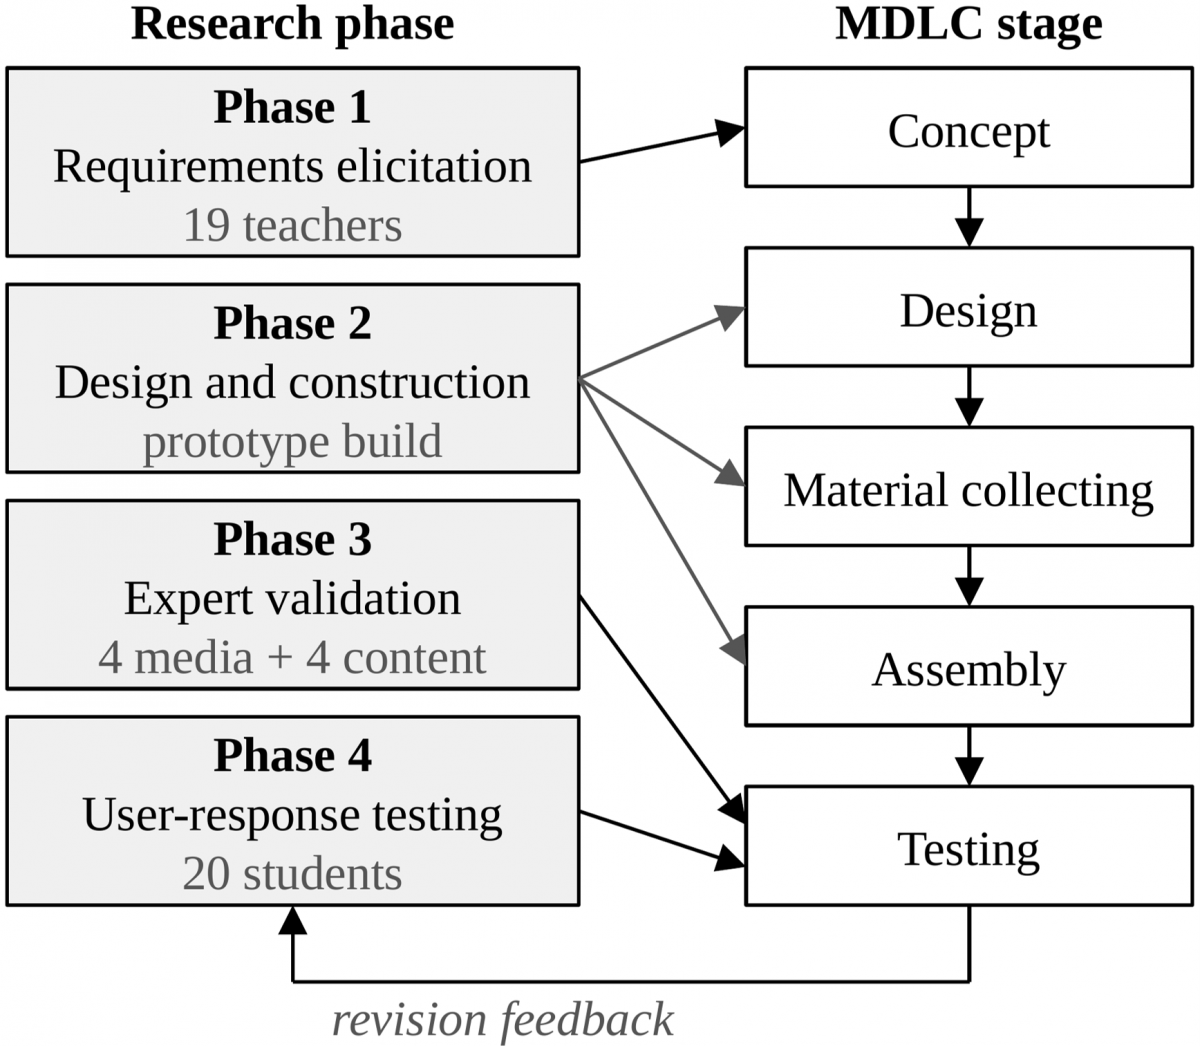
We used a design-and-development research approach, in which an artefact is designed, built and evaluated against a specification set in advance [13, 27]. The study covers requirements elicitation, construction, expert validation, and a limited round of user-response testing; effectiveness testing is planned separately, because validity and usability should be established before effectiveness is measured. Construction followed the Media Development Life Cycle (MDLC): concept, design, material collection, assembly, and testing. We chose MDLC because it has a separate material collection stage, and preparing the multimodal assets took a large share of the engineering effort. Figure 1 maps the research phases onto the MDLC stages.
Figure 1. Research and system development design, mapping the four research phases onto the five Media Development Life Cycle (MDLC) stages
3.2 Participants
Participants were selected purposively on the basis of role, expertise, and involvement with the problem [28] (Table 1).
Table 1. Participants by research phase
|
Group (Phase) |
n |
Selection Criteria |
|
Special education teachers (requirements elicitation) |
19 |
Active teachers of students with intellectual disabilities at SLB YRTRW Surakarta (requirements elicitation only); 4 to 24 years of experience. |
|
Media experts (system validation) |
4 |
Master's degree or higher in educational technology, visual communication design, or educational software engineering; at least 3 years' experience. |
|
Content experts (content validation) |
4 |
Master's degree or higher in science education, special education, or educational assessment; at least 3 years' experience. |
|
Students with mild intellectual disabilities (user-response testing) |
20 |
Enrolled at one of two other SLB partner schools in Central Java; formal diagnosis by a school psychologist or SLB assessment team; eligible age range 12 to 16; able to use a digital interface with minimal support. |
Of the 19 teachers, 15 were women (78.9%). Their mean age was 39.2 years (standard deviation (SD) = 7.5), their mean teaching experience was 12.6 years (SD = 5.4), and 13 held a bachelor's and 6 a master's degree. The 20 students were divided equally between two SLB partner schools in Central Java. Their mean age was 13.85 years (SD = 0.74, observed range 13 to 15); 12 were boys, 8 were girls, and 11 were in Grade 7, 6 in Grade 8, and 3 in Grade 9. The requirements-elicitation school took part only in requirements elicitation; the system was tested with students at two different schools. The schools arranged consent with students and their parents or guardians before data collection; participation was voluntary, and the Research Ethics Committee of LPPM, Universitas Negeri Malang, approved the study, as presented in Ethics Approval and Consent.
3.3 Instruments and data analysis
Five instruments were used (Table 2). The requirements questionnaire was completed by the 19 teachers during a focus group discussion (FGD) session at their school; its constructs were drawn from the technology acceptance literature [24] and the needs-analysis procedure in reference [13]. The media validation instrument covered aspects consistent with established frameworks for evaluating multimedia learning resources [29], and the content validation instrument structured item cognitive demand with the revised taxonomy of educational objectives [30]. A structured observation sheet was used to record, for each student, the topics completed, navigation errors, and quiz outcomes on first and subsequent attempts. It also recorded teacher assistance events, classified as verbal, gestural, modelling, or physical prompts.
Table 2. Evaluation instruments and assessment aspects
|
Instrument |
Respondents |
Scale and Items |
Assessment Aspects |
|
Requirements questionnaire |
19 teachers |
4-point Likert (8 items), multiple choice, open-ended |
Technology use, learning barriers, interface preferences, priority content |
|
Media validation |
4 media experts |
4-point Likert (23 items), comments |
Software engineering, visual design, instructional design, accessibility |
|
Content validation |
4 content experts |
4-point Likert (21 items), comments |
Curriculum alignment, learner suitability, embedded assessment design, item quality, inclusiveness |
|
Student response scale |
20 students |
Four-level pictorial scale (10 items) |
Ease of use, enjoyment, intention to reuse |
|
Observation sheet |
20 students |
Per-student event counts |
Assistance by type, navigation errors, quiz attempts |
The student response scale was developed by the authors for this study. It was informed by the System Usability Scale (SUS) [31] and child-adapted instruments [32, 33], but its ten items, simplified wording, and four-level pictorial format differ from the original SUS, so its scores are not comparable with SUS norms. Pictorial response options improve response rates and reliability in self-report by people with intellectual disability [34].
Content validity was analyzed with Aiken's V [35], which measures how far an expert panel agrees that an item is relevant:
$V=\frac{\sum s}{n(c-1)}$ (1)
where, s = r − lo, r is a rater's rating, lo the lowest category, n the number of raters and c the number of categories. V was computed per item and aggregated by aspect and overall, and read against the tabulated significance criterion [35] and the benchmark of V ≥ 0.80 for high content validity [36]. The questionnaire and student scale were analyzed descriptively, converting item means to percentages against a four-tier classification (86 to 100% very feasible; 71 to 85% feasible; 56 to 70% sufficiently feasible; below 55% not feasible) [37]. Observation data were summarized as counts per student and per school. Expert comments, open-ended responses, FGD notes and observation notes were analyzed by inductive thematic analysis [38].
4.1 Concept: Requirements specification
The teachers rated the need for interactive, web-delivered science media for this population highly (overall mean (M) = 3.89 of 4.00; 97.3%; Table 3). Agreement was near-unanimous on simple navigation (M = 4.00) and immediate feedback (M = 3.95), whereas audio support (M = 3.74) and embedded assessment (M = 3.79) received the lowest means. Audio instructions (94.7%), rewards (89.5%), and large targets (84.2%) were the most often prioritized features. Four themes emerged from the open-ended responses and FGD notes: abstract concepts are hard to grasp from text alone; the interface should be simple and consistent, with large icons and little text; visible rewards sustain effort; and assessment should sit inside the activity. Eight functional and four non-functional requirements were derived from these themes (Table 4). They describe the conditions reported by teachers at one school and are not assumed to characterize Indonesian special schools in general.
Table 3. Requirements questionnaire results (n = 19)
|
Item |
M |
SD |
|
Interactive media are needed |
3.95 |
0.22 |
|
Existing media are inadequate |
3.84 |
0.37 |
|
Students engage with game-based learning |
3.89 |
0.31 |
|
Immediate feedback is important |
3.95 |
0.23 |
|
Embedded assessment is needed |
3.79 |
0.42 |
|
Simple navigation is important |
4.00 |
0.00 |
|
Audio support is necessary |
3.74 |
0.45 |
|
Reward systems sustain engagement |
3.95 |
0.22 |
|
Overall |
3.89 |
— |
Table 4. Mapping of elicited needs to system requirements
|
Requirement |
Source |
Realization |
|
R1 Multimodal delivery of every content unit |
Theme 1; audio 94.7% |
Card with text, image and synthesized speech |
|
R2 Optional learner-invoked narration |
Audio support M = 3.74 |
Listen control on each card |
|
R3 Penalty-free assessment, no time limit |
Theme 4; M = 3.79 |
Quiz with unlimited reattempts |
|
R4 Item-level interaction logging |
Theme 4 |
Attempt record per item response |
|
R5 Progress and reward feedback |
Theme 3; 89.5% |
Star award; progress page |
|
R6 Large targets, minimal text |
Theme 2; 84.2% |
Enlarged controls; one proposition per card |
|
R7 Adjustable presentation |
Theme 2 |
Font size and display settings |
|
R8 Facilitator guidance |
Theme 2 |
Teacher and parent page |
|
N1 Installation-free deployment |
Constraint reported by teachers |
Browser-delivered client |
|
N2 Low-specification devices |
Constraint reported by teachers |
Target: Chrome 90+, Firefox 88+, Safari 14+; 360 px viewport |
|
N3 Protection of minors' data |
Law No. 27/2022 |
Local storage bound to a pseudonymous session identifier |
|
N4 Content maintainable by non-developers |
Teacher operator role |
Content in a structured data file |
4.2 Design: System architecture
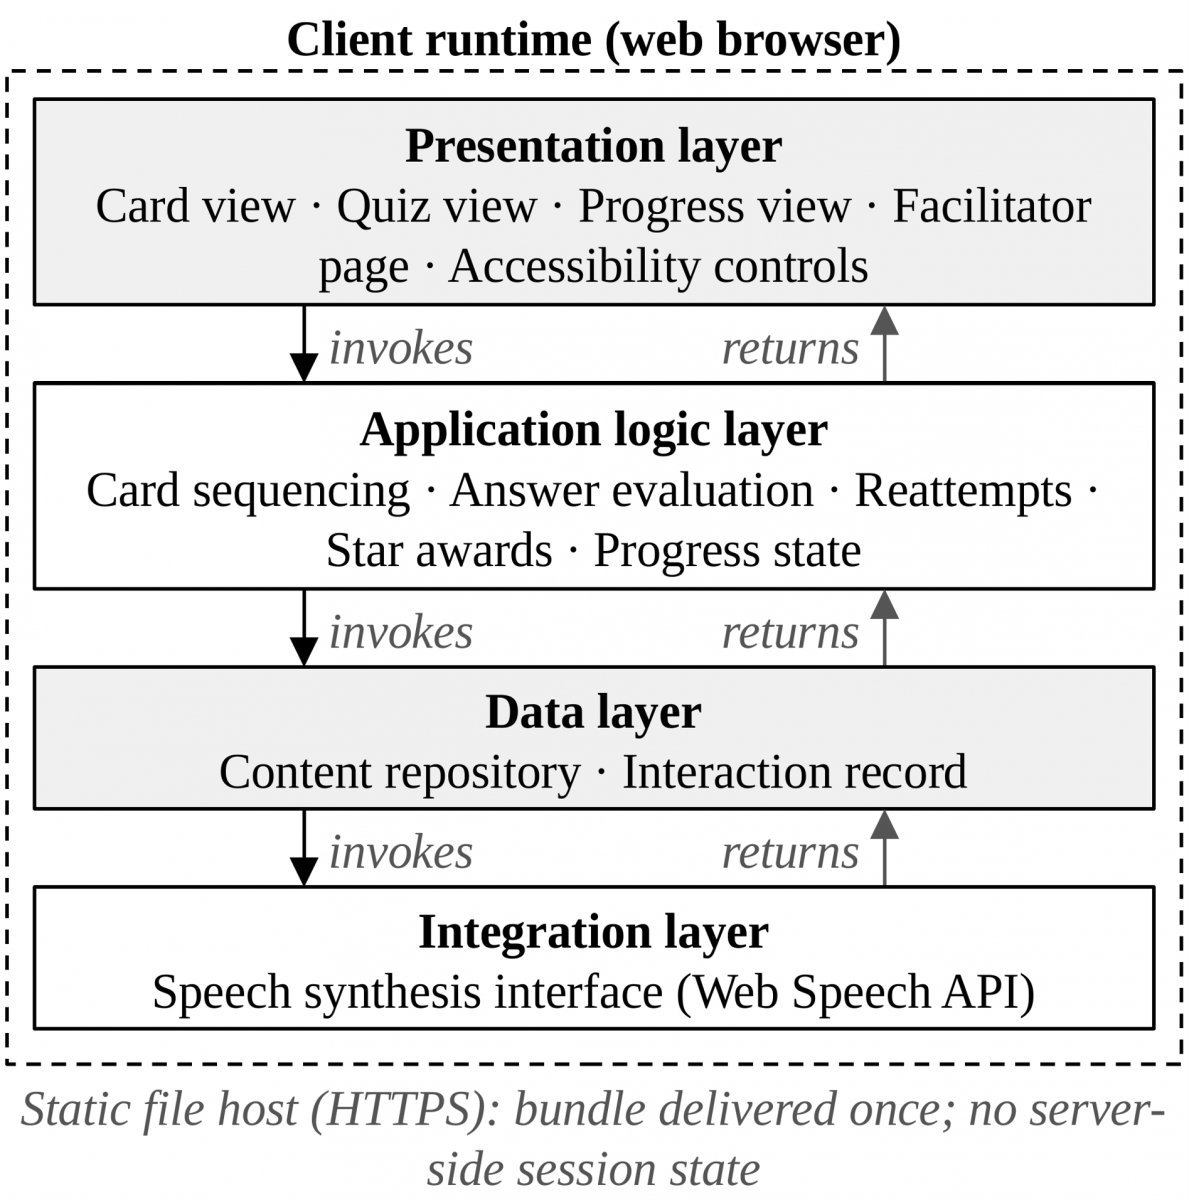
Requirements N1 and N2 call for a client-centric web application, delivered over Hypertext Transfer Protocol Secure (HTTPS) and run entirely in the browser. Keeping presentation, navigation, assessment, and reward logic on the client removes per-device installation and avoids server contact during lessons, which suits the unreliable connectivity reported by the participating teachers. Figure 2 shows the four layers. The presentation layer renders the cards, quiz, progress view, and facilitator page, and holds the accessibility controls (Section 4.5); the application logic layer handles sequencing, answer evaluation, reattempts, star awards, and progress state; the data layer holds the content repository and interaction record (Section 4.3); and the integration layer reaches speech synthesis.
Presentation and application logic are written in React 18.2 and shipped as a pre-built static bundle. The integration layer calls the browser's Web Speech application programming interface (API) [39], which delegates synthesis to the speech engine available on the device (Section 4.6). The data layer uses browser-local storage, and apart from the static file host, there is no server-side component. The system does not use a service worker. Once the bundle has loaded, it remains operable without a network connection for the rest of an open session, but reloading the page requires connectivity. Table 5 lists the specification.
Figure 2. Layered architecture of the Bintang Sains system
Table 5. System specification
|
Parameter |
Specification |
|
Target users |
Junior secondary students with mild intellectual disabilities (SMPLB) |
|
Deployment |
Browser-delivered; no installation |
|
Client framework |
React 18.2 with Vite 5.0 |
|
Speech synthesis |
Web Speech API, Indonesian (id-ID) voice (engine depends on browser and operating system) |
|
Persistence |
Browser-local storage; no server component |
|
Content |
6 topics; 8 cards and 5 quiz items per topic (30 items) |
|
Assets |
JSON text files; WebP illustrations (mean 45 KB); SVG icons; MP3 confirmation sounds (mean 12 KB); narration generated at runtime |
|
Client specification |
Target: Chrome 90+, Firefox 88+, Safari 14+; 360 px viewport; 2 GB RAM (not yet verified on school devices) |
|
Network |
Initial load approximately 1.8 MB; operable offline within an open session; reloading requires connectivity |
4.3 Design: Conceptual and data model
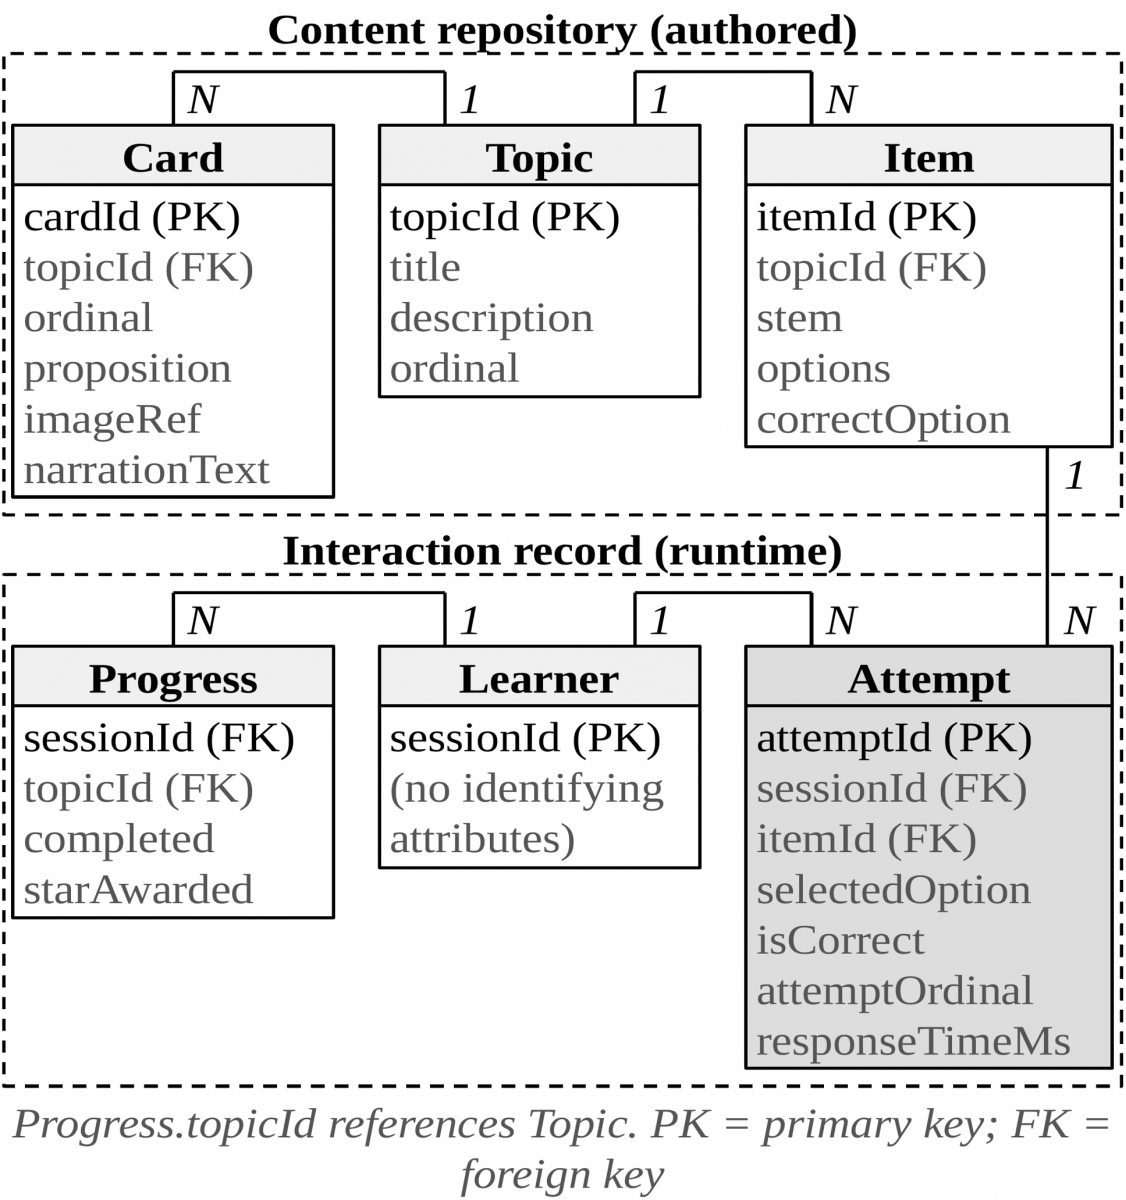
The data model separates authored content entities, which change rarely, from interaction entities written at runtime, which form the assessment evidence. This separation meets requirement R4 without tying the assessment record to the way content is presented. Figure 3 shows the six entities and their attributes; Learner carries only a pseudonymous session identifier (Section 4.6).
Figure 3. Entity relationship model of the content and interaction repositories
Table 6. Variables retained and not yet retained in the interaction record
|
Variable |
Status |
Potential Use |
|
Selected option, correctness |
Retained |
Accuracy; error patterns |
|
Attempt ordinal |
Retained |
First-attempt correctness; attempts to success |
|
Response latency (ms) |
Retained |
Rapid guessing versus deliberate response |
|
Narration use |
Not retained |
Reliance on auditory support |
|
Navigation history |
Not retained |
Reviewing cards before answering |
|
Interruption and idle time |
Not retained |
Interpreting latency outliers |
|
Item difficulty |
Not retained |
Calibrated competency estimation |
|
Teacher assistance flag |
Not retained |
Assisted versus independent completion |
In implementation, an Attempt record is keyed by attemptId (a version 4 UUID) and holds sessionId and itemId as foreign keys. The remaining attributes are selectedOption (string), isCorrect (boolean), attemptOrdinal (integer), and responseTimeMs (integer). Records last as long as browser storage does; they are not transmitted to a server. Since each response is stored separately instead of being collapsed into a topic score, the sequence of reattempts and the latency of each response are preserved. These variables are necessary but not sufficient for competency modelling. The schema does not record narration use, navigation history, interruptions, item difficulty, or teacher assistance, and the last of these proved important during testing (Section 5.2). As Attempt is an independent entity, these variables can be added as new attributes or as a separate Event entity without restructuring existing records (Table 6).
4.4 Design: Process model
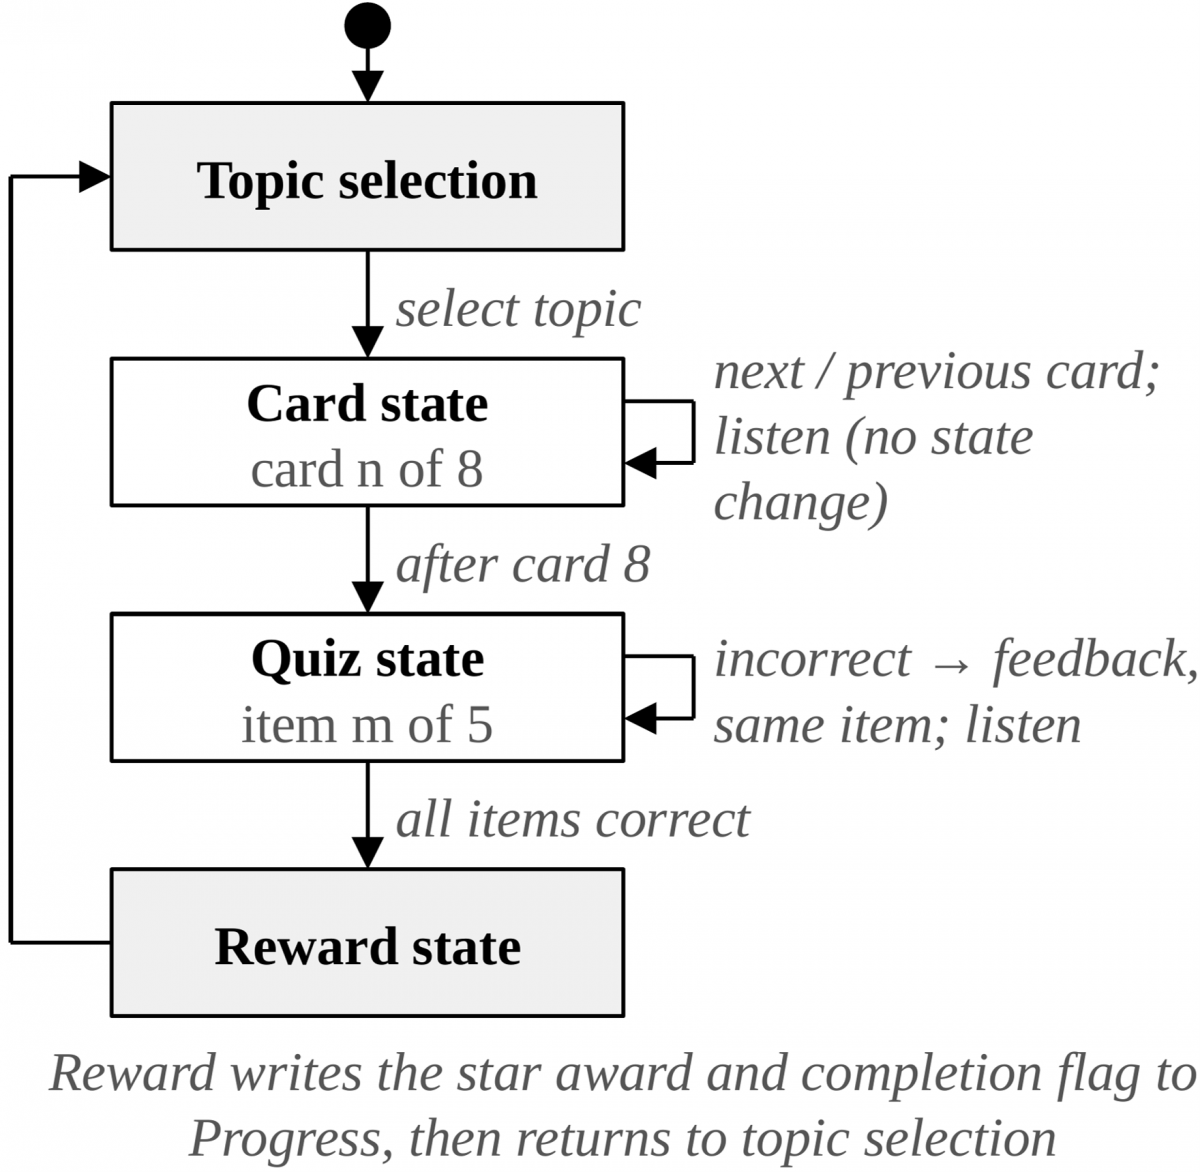
Within a topic, the interaction follows a deterministic state machine (Figure 4). A wrong quiz answer produces corrective feedback and returns control to the same item (requirement R3). There is no failure terminal state, and every transition writes to the interaction record before the interface changes, so the stored evidence stays complete if a session ends unexpectedly. Unlimited reattempts do, however, complicate interpretation. A learner can retry until the answer is correct, so final correctness carries little information on its own, and the evidence has to come from first-attempt correctness, the number of attempts and response latency (Section 6).
Figure 4. State model of the learning and assessment interaction
4.5 Material collection and accessibility implementation
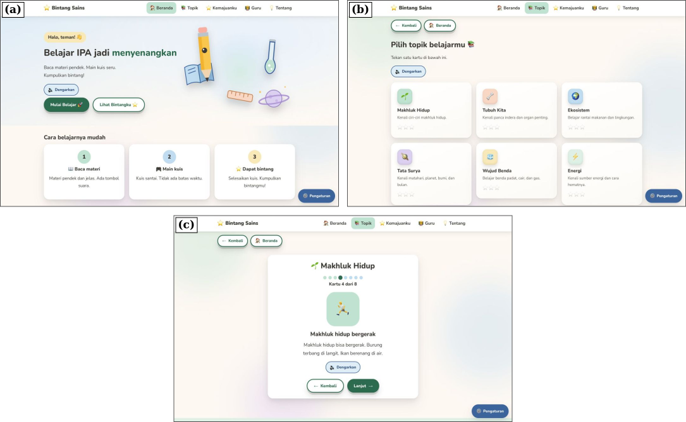
Content covers six IPA topics from the SMPLB curriculum: Living Organisms, Our Body, Ecosystem, The Solar System, States of Matter and Energy. Each topic has eight cards, each with a progress indicator, one short proposition in plain vocabulary with a concrete example, an illustration, and a control that reads the card aloud (Figure 5). Narration is generated from the displayed text, so the spoken and written channels cannot diverge through an authoring error.
Body text has a contrast ratio of 7.2:1 and interactive controls 5.1:1. An automated audit was run to check the interface against the Web Content Accessibility Guidelines (WCAG) 2.1 at Level AA [40]. Targets measure at least 64 × 64 px, font size has three levels (16, 20 and 24 px), and every illustration has plain-language alternative text. These checks establish conformance with general accessibility guidelines; they do not by themselves establish accessibility for learners with intellectual disabilities, which Section 5.2 examines through observation.
Figure 5. Implemented interface of Bintang Sains: (a) homepage with the three-step visual guide; (b) topic-selection screen with star progress indicators; (c) flashcard screen with the illustrated proposition and the Listen (Dengarkan) control
4.6 Security, privacy and regulatory compliance
Under Indonesian Law No. 27 of 2022, children's data require parental consent, and health-related information requires stronger protection. Accordingly, the system keeps only the data its assessment function needs. The Learner entity stores no names, dates of birth, class, school, or diagnosis, and records are linked to a session rather than a permanent account, so no long-term profile is created. The application bundle is delivered over HTTPS; learner data are not transmitted. Each record stays in the browser storage of the device on which it was created. For the research, the class teacher manually copied a summary of each student's assessment activity from the test device at the end of the session, without identifying information; the research team accessed only these summaries.
Local-only storage also has costs. It rules out longitudinal assessment across sessions, loses records when storage is cleared or a device fails, prevents continuity across devices, and gives teachers no access to interaction histories beyond what they copy by hand. A future version could add a teacher-controlled, encrypted export or synchronization with a school-local store under the same consent and minimization rules.
Speech synthesis raises a less obvious issue. If narration is produced by an online service, card text is sent with each request; the text is not learner data, but request patterns could reveal which topics were studied and when. With an on-device id-ID voice, card text does not leave the device, but some browser–voice combinations route synthesis through the vendor's online service. Bintang Sains therefore cannot guarantee by itself that no text reaches a third party; deployments should prefer voices reported as local (localService = true), and schools should be informed when only an online voice is available.
5.1 Expert validation
The four media experts agreed on the relevance and suitability of all four aspects (overall V = 0.96; Table 7). Instructional design received the highest value (0.98) and visual communication design the lowest (0.94). The four content experts reached a similar judgement (overall V = 0.96), with the highest value for inclusiveness (0.98) and the lowest for embedded assessment design (0.94). No aspect fell below the 0.80 benchmark. The experts' written comments still led to several changes before any student used the system: interactive targets were enlarged, instructions simplified, color contrast increased, confirmation sounds added for selection and reward events, and a replay control added for narration and quiz items.
Table 7. Expert validation results (Aiken's V)
|
Assessment Aspect |
Aiken's V |
|
Media experts (n = 4): software engineering |
0.96 |
|
Visual communication design |
0.94 |
|
Instructional design |
0.98 |
|
Accessibility |
0.95 |
|
Media validation overall |
0.96 |
|
Content experts (n = 4): curriculum alignment |
0.97 |
|
Suitability for target learners |
0.95 |
|
Embedded assessment design |
0.94 |
|
Assessment item quality |
0.96 |
|
Inclusiveness |
0.98 |
|
Content validation overall |
0.96 |
5.2 User-response testing
Testing took place at the two partner schools on separate days. At each school, 10 students worked with the system one at a time, supported by their class teacher. Each 25-minute session included the card sequences and the quizzes, and the researcher recorded structured observations. The overall scale mean was 3.91 of 4.00 (97.6%, very feasible; Table 8). Enjoyment and reward were at the ceiling (M = 4.00), and audio quality was the lowest (M = 3.75), consistent with the experts' comment on feedback salience.
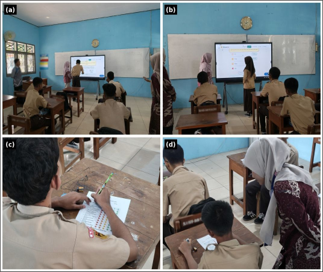
Structured observation (Table 9) showed that all 20 students completed three topics within the session and that 15 (75%) worked without any teacher assistance. The remaining five received 29 assistance events, all during the quiz and none during the card sequences. The prompts were verbal, with the teacher reading aloud or describing what was on the screen, or gestural, with the teacher pointing to the relevant option; some students also asked the teacher to confirm an option before selecting it. No modelling or physical prompts were needed, and no navigation errors occurred. Of 300 quiz responses, 299 were correct on the first attempt; the single error, made by the student who needed the most assistance, was corrected on the second attempt. Figure 6 shows the testing sessions.
Table 8. Student response scale results (n = 20; four-level scale)
|
Indicator |
M |
Percentage of Maximum Score (%) |
|
Ease of use |
3.90 |
97.5 |
|
Interest |
3.95 |
98.8 |
|
Enjoyment |
4.00 |
100.0 |
|
Clarity of instructions |
3.80 |
95.0 |
|
Visual presentation |
3.95 |
98.8 |
|
Audio quality |
3.75 |
93.8 |
|
Navigation |
3.85 |
96.3 |
|
Reward mechanism |
4.00 |
100.0 |
|
Engagement |
3.90 |
97.5 |
|
Overall satisfaction |
3.95 |
98.8 |
|
Overall |
3.91 |
97.6 |
Table 9. Observed interaction indicators during user-response testing
|
Indicator |
School A (n = 10) |
School B (n = 10) |
Total (n = 20) |
|
Topics completed per student |
3 |
3 |
3 |
|
Completed all session activities |
10 |
10 |
20 (100%) |
|
Worked without assistance |
7 |
8 |
15 (75%) |
|
Assistance events (verbal/gestural) |
13 (5/8) |
16 (7/9) |
29 (12/17) |
|
Modelling or physical prompts |
0 |
0 |
0 |
|
Events per assisted student, range |
2–7 |
6–10 |
2–10 |
|
Navigation errors |
0 |
0 |
0 |
|
Correct on first attempt |
150/150 |
149/150 |
299/300 (99.7%) |
|
Mean attempts per item |
1.00 |
1.01 |
1.00 |
5.3 Technical performance evaluation
Requirements N1 and N2 were tested on the deployed build using browser developer tooling and a small set of browser–platform combinations (Table 10); the schools' own devices were not profiled. Initial load took 2.4 s over a 10 Mbps connection (1.8 MB, cold cache). Mean narration latency over 30 trials was 180 ms. At 360 px, the layout reflowed to a single column without horizontal scrolling or clipped targets. With the network disabled after the initial load, all topics, the quiz, and the reward subsystem remained operable within the open session. A continuous 25-minute session showed no memory growth, rendering degradation, or unhandled error. On Safari/iPadOS, narration starts only after a first user interaction, a platform restriction on autoplay that teachers deploying on iPads should expect. These results do not establish performance on the 2 GB RAM devices given as the target specification. After testing, the home control was enlarged, narration volume raised, and graphical assets compressed.
Table 10. Technical performance and compatibility results
|
Parameter |
Environment |
Result |
|
Initial load time |
Chrome 120, Windows 10 |
2.4 s/1.8 MB |
|
Narration latency |
Chrome 120, Windows 10 |
180 ms mean |
|
Functional completeness |
Chrome, Android 11 |
Pass |
|
Functional completeness |
Firefox 121, Windows 10 |
Pass |
|
Functional completeness |
Safari 15, iPadOS |
Narration after first user interaction |
|
Offline operation (open session) |
All tested browsers |
Pass |
|
25-minute session stability |
Chrome 120, Windows 10 |
No degradation observed |
The requirements came from teachers at a single school and describe that school's conditions. The student evaluations at two other schools show that the design was usable there, but not that the requirements generalize. Architecturally, the design rests on three decisions. Browser delivery removes the installation and maintenance burden identified as the main obstacle in resource-limited schools [3], although offline operation is limited to an open session. Generating narration at runtime from the card text keeps speech and text consistent (Section 4.5). Storing each response as a separate attempt preserves the reattempt sequence and latency on which embedded assessment depends [12], although more variables will be needed before a competency model can be fitted (Table 6).
The Aiken's V values of both expert panels exceeded the tabulated criterion [35] and the conventional benchmark [36]. These indices show agreement on the relevance and suitability of the designed components; they do not show that embedded assessment improves learning or that the attempt data support valid inferences about learners.
With unlimited reattempts, final correctness carries little information on its own, so interpretation has to rest on other indicators. In this session, 299 of 300 responses were correct on the first attempt. Because each topic's quiz follows immediately after its cards, this most likely reflects immediate recall rather than mastery or retention, and the quiz did not differentiate between learners. Future analyses could distinguish four patterns: mastery, indicated by first-attempt correctness that persists on delayed items, such as items repeated in a later session or mixed across topics; guessing, indicated by very short latencies followed by errors; trial-and-error, indicated by attempt counts approaching the number of options; and assisted completion, which the current schema cannot detect. The five students prompted while answering left records identical to independent ones, which is why Table 6 includes an assistance flag.
The positive student ratings and the high rate of independent completion require cautious interpretation. The ratings are close to ceiling, which limits their diagnostic value. Self-report by people with intellectual disability is prone to acquiescence and social desirability, especially when adults are present [34], and the pictorial scale reduces but does not remove this bias. Novelty may also have raised engagement, as reward mechanics can lose effect over time [6]. The evaluation also consisted of one 25-minute session with 20 students, and five needed repeated prompts during the quiz. The evidence therefore supports a narrower claim, namely that the system was usable and well received on first contact by most participants. It does not address durable engagement or learning.
Data storage, retention and third-party exposure are largely architectural decisions, although Section 4.6 shows that speech synthesis also depends on the deployment environment. The reusable contribution is a design pattern made up of content held as data, narration generated from the displayed text, attempt-level assessment records, browser delivery without installation, and a learner entity that holds nothing identifying. Whether this pattern supports learning in under-resourced schools remains to be tested in classroom studies across more schools.
This study designed, built, and initially validated Bintang Sains, a web-based learning system with embedded assessment for junior secondary students with mild intellectual disabilities. The design was based on requirements from 19 teachers at one school, and the system stores every quiz attempt as a separate record linked to a pseudonymous session. Both expert panels agreed on the relevance and suitability of the components. In a single 25-minute session, students from two other schools rated the system positively, and most completed it without assistance. These findings indicate initial validity and acceptability, not learning effects.
Five limitations apply. First, the study did not measure learning, diagnostic accuracy, or long-term engagement. Second, user-response testing involved 20 students in a single session; the ratings may be affected by ceiling, acquiescence, social desirability, and novelty effects, and quiz outcomes reflect immediate recall. Third, the requirements came from one school. Fourth, the technical measurements did not use the schools' own devices. Fifth, records are stored only locally, and narration privacy depends on the available speech engine. The follow-up study will add the variables in Table 6, including an assistance flag and delayed items, before a competency model is fitted to the extended record. A subsequent classroom study should assess learning with the interaction records as evidence, track engagement beyond first contact, include more regions and a wider range of intellectual disabilities, and repeat the technical evaluation on the devices that schools actually own.
The study was approved by the Research Ethics Committee of LPPM, Universitas Negeri Malang (No. 06.08.02/UN32.14.2.8/LT/2026, valid from August 6, 2026 to August 6, 2027). Parents or guardians provided consent through the schools, including permission to publish the photographs in Figure 6.
The instruments, validation ratings, observation records, and aggregated response data are available from the corresponding author on reasonable request. Interaction records were stored only on the test devices and were not transmitted or archived.
The authors used Claude for language editing, translation, formatting, and diagram preparation. All content was reviewed and verified by the authors. Generative AI was not used to generate, analyze, or interpret data.
The authors declare that they have no known competing financial interests or personal relationships that could have appeared to influence the work reported in this paper.
This work is supported by the RKAT of Universitas Sebelas Maret, Fiscal Year 2026, through the Fundamental Research scheme A (PFA-UNS) (Research Assignment Agreement No. 460/UN27.22/PT.01.03/2026). The authors thank the teachers of SLB YRTRW Surakarta, the two partner special schools in Central Java, the eight media and content experts, and the class teachers who accompanied the students. Above all, we thank the students who used Bintang Sains and shared their responses with us.
|
c |
number of rating categories |
|
lo |
lowest rating category |
|
M |
mean score |
|
n |
number of raters |
|
r |
rating given by a rater |
|
s |
r minus lo |
|
SD |
standard deviation |
|
V |
Aiken's V coefficient |
[1] Sweller, J., Ayres, P., Kalyuga, S. (2011). Cognitive Load Theory. Springer, New York. https://doi.org/10.1007/978-1-4419-8126-4
[2] Ministry of Primary and Secondary Education of the Republic of Indonesia. (2025). Total peserta didik berkebutuhan khusus provinsi periode 20252 [Total number of students with special needs by province, period 2025/2]. Pusat Data dan Teknologi Informasi. https://referensi.data.kemendikdasmen.go.id/berkebutuhan_khusus/total/wilayah?periode=20252.
[3] Lynch, P., Singal, N., Francis, G.A. (2024). Educational technology for learners with disabilities in primary school settings in low- and middle-income countries: A systematic literature review. Educational Review, 76(2): 405-431. https://doi.org/10.1080/00131911.2022.2035685
[4] Clark, D.B., Tanner-Smith, E.E., Killingsworth, S.S. (2016). Digital games, design, and learning: A systematic review and meta-analysis. Review of Educational Research, 86(1): 79-122. https://doi.org/10.3102/0034654315582065
[5] Boyle, E.A., Hainey, T., Connolly, T.M., et al. (2016). An update to the systematic literature review of empirical evidence of the impacts and outcomes of computer games and serious games. Computers & Education, 94: 178-192. https://doi.org/10.1016/j.compedu.2015.11.003
[6] Sailer, M., Homner, L. (2020). The gamification of learning: A meta-analysis. Educational Psychology Review, 32(1): 77-112. https://doi.org/10.1007/s10648-019-09498-w
[7] Plass, J.L., Homer, B.D., Kinzer, C.K. (2015). Foundations of game-based learning. Educational Psychologist, 50(4): 258-283. https://doi.org/10.1080/00461520.2015.1122533
[8] Cano, A.R., García-Tejedor, Á.J., Alonso-Fernández, C., Fernández-Manjón, B. (2019). Game analytics evidence-based evaluation of a learning game for intellectual disabled users. IEEE Access, 7: 123820-123829. https://doi.org/10.1109/ACCESS.2019.2938365
[9] Stančin, K., Hoić-Božić, N., Skočić Mihić, S. (2020). Using digital game-based learning for students with intellectual disabilities: A systematic literature review. Informatics in Education, 19(2): 323-341. https://doi.org/10.15388/infedu.2020.15
[10] Tlili, A., Denden, M., Duan, A., et al. (2022). Game-based learning for learners with disabilities: What is next? A systematic literature review from the activity theory perspective. Frontiers in Psychology, 12: 814691. https://doi.org/10.3389/fpsyg.2021.814691
[11] Santórum, M., Carrión-Toro, M., Morales-Martínez, D., Maldonado-Garcés, V., Araujo, E., Acosta-Vargas, P. (2023). An accessible serious game-based platform for process learning of people with intellectual disabilities. Applied Sciences, 13(13): 7748. https://doi.org/10.3390/app13137748
[12] Shute, V.J. (2011). Stealth assessment in computer-based games to support learning. In Computer Games and Instruction, Information Age Publishing, Charlotte, pp. 503-524. https://doi.org/10.1108/978-1-61735-410-620251025
[13] Richey, R.C., Klein, J.D. (2007). Design and Development Research: Methods, Strategies, and Issues. Lawrence Erlbaum Associates, Mahwah, pp. 1-177.
[14] Drigas, A., Ioannidou, R.E. (2013). Special education and ICTs. International Journal of Emerging Technologies in Learning, 8(2): 41-47. https://doi.org/10.3991/ijet.v8i2.2514
[15] Kagohara, D.M., van der Meer, L., Ramdoss, S., et al. (2013). Using iPods and iPads in teaching programs for individuals with developmental disabilities: A systematic review. Research in Developmental Disabilities, 34(1): 147-156. https://doi.org/10.1016/j.ridd.2012.07.027
[16] Mayer, R.E. (2009). Multimedia Learning. Cambridge University Press, Cambridge. https://doi.org/10.1017/CBO9780511811678
[17] CAST. (2018). Universal Design for Learning Guidelines Version 2.2. http://udlguidelines.cast.org.
[18] Almeqdad, Q.I., Alodat, A.M., Alquraan, M.F., Mohaidat, M.A., Al-Makhzoomy, A.K. (2023). The effectiveness of universal design for learning: A systematic review of the literature and meta-analysis. Cogent Education, 10(1): 2218191. https://doi.org/10.1080/2331186X.2023.2218191
[19] Rao, K., Ok, M.W., Bryant, B.R. (2014). A review of research on universal design educational models. Remedial and Special Education, 35(3): 153-166. https://doi.org/10.1177/0741932513518980
[20] Al-Azawei, A., Serenelli, F., Lundqvist, K. (2016). Universal design for learning (UDL): A content analysis of peer reviewed journals from 2012 to 2015. Journal of the Scholarship of Teaching and Learning, 16(3): 39-56. https://doi.org/10.14434/josotl.v16i3.19295
[21] Rao, K., Meo, G. (2016). Using universal design for learning to design standards-based lessons. SAGE Open, 6(4): 2158244016680688. https://doi.org/10.1177/2158244016680688
[22] Evmenova, A.S. (2018). Preparing teachers to use universal design for learning to support diverse learners. Journal of Online Learning Research, 4(2): 147-171.
[23] Wood, S.G., Moxley, J.H., Tighe, E.L., Wagner, R.K. (2018). Does use of text-to-speech and related read-aloud tools improve reading comprehension for students with reading disabilities? A meta-analysis. Journal of Learning Disabilities, 51(1): 73-84. https://doi.org/10.1177/0022219416688170
[24] Davis, F.D. (1989). Perceived usefulness, perceived ease of use, and user acceptance of information technology. MIS Quarterly, 13(3): 319-340. https://doi.org/10.2307/249008
[25] Scherer, R., Siddiq, F., Tondeur, J. (2019). The technology acceptance model (TAM): A meta-analytic structural equation modeling approach to explaining teachers' adoption of digital technology in education. Computers & Education, 128: 13-35. https://doi.org/10.1016/j.compedu.2018.09.009
[26] Trisnaningsih, S., Sukmawati, F., Santosa, E.B., Ridhani, J., Qodr, T.S. (2025). Exploring teacher's acceptance of online assessment to support deep learning pedagogy: An integrated UTAUT2 approach. Multidisciplinary Reviews, 9(5): 2026259. https://doi.org/10.31893/multirev.2026259
[27] Borg, W.R., Gall, M.D. (1983). Educational Research: An Introduction, 4th ed. Longman, New York, p. 983. https://archive.org/details/educationalresea0000borg_q0k5.
[28] Creswell, J.W. (2014). Research Design: Qualitative, Quantitative, and Mixed Methods Approaches, 4th ed. SAGE Publications, Thousand Oaks. https://openlibrary.telkomuniversity.ac.id/home/catalog/id/9492/slug/research-.
[29] Leacock, T.L., Nesbit, J.C. (2007). A framework for evaluating the quality of multimedia learning resources. Educational Technology & Society, 10(2): 44-59. http://www.jstor.org/stable/jeductechsoci.10.2.44.
[30] Anderson, L.W., Krathwohl, D.R. (eds) (2001). A Taxonomy for Learning, Teaching, and Assessing: A Revision of Bloom's Taxonomy of Educational Objectives: Complete Edition. Longman, New York. https://eduq.info/xmlui/handle/11515/18824.
[31] Brooke, J. (1996). SUS: A quick and dirty usability scale. In Usability Evaluation in Industry. CRC Press, p. 6. https://www.taylorfrancis.com/chapters/edit/10.1201/9781498710411-35/sus-quick-dirty-usability-scale-john-brooke.
[32] Putnam, C., Puthenmadom, M., Cuerdo, M.A., Wang, W.S., Paul, N. (2020). Adaptation of the system usability scale for user testing with children. In Extended Abstracts of the 2020 CHI Conference on Human Factors in Computing Systems, Honolulu, USA, pp. 1-7. https://doi.org/10.1145/3334480.3382840
[33] Read, J.C., MacFarlane, S. (2006). Using the fun toolkit and other survey methods to gather opinions in child computer interaction. In Proceedings of the 2006 Conference on Interaction Design and Children, New York, NY, USA, pp. 81-88. https://doi.org/10.1145/1139073.1139096
[34] Hartley, S.L., MacLean, W.E. (2006). A review of the reliability and validity of Likert-type scales for people with intellectual disability. Journal of Intellectual Disability Research, 50(11): 813-827. https://doi.org/10.1111/j.1365-2788.2006.00844.x
[35] Aiken, L.R. (1985). Three coefficients for analyzing the reliability and validity of ratings. Educational and Psychological Measurement, 45(1): 131-142. https://doi.org/10.1177/0013164485451012
[36] Retnawati, H. (2016). Analisis Kuantitatif Instrumen Penelitian [Quantitative Analysis of Research Instruments]. Parama Publishing, Yogyakarta.
[37] Akbar, S. (2013). Instrumen Perangkat Pembelajaran [Instruments for Learning Materials]. Remaja Rosdakarya, Bandung.
[38] Miles, M.B., Huberman, A.M., Saldaña, J. (2014). Qualitative Data Analysis: A Methods Sourcebook, 3rd ed. SAGE Publications, Thousand Oaks. https://openlibrary.telkomuniversity.ac.id/home/catalog/id/149484/slug/qualitative-data-analysis-a-methods-sourcebook-3-e-.html.
[39] W3C Audio Community Group. Web Speech API. https://webaudio.github.io/web-speech-api/.
[40] World Wide Web Consortium. (2018). Web Content Accessibility Guidelines (WCAG) 2.1. W3C Recommendation. https://www.w3.org/TR/WCAG21/.