Arpit Deo*![]() | Megha Singh
| Megha Singh![]()
© 2025 The authors. This article is published by IIETA and is licensed under the CC BY 4.0 license (http://creativecommons.org/licenses/by/4.0/).
OPEN ACCESS
Accurate and timely diagnosis of Sickle Cell Disease (SCD) from microscopic blood smears is critical but often hampered by the subjectivity, labour-intensity, and inter-observer variability of manual examination. To address this, we propose an advanced hybrid deep learning model combining DenseNet121 and ResNet50 for automated sickle cell classification. DenseNet's dense connectivity ensures maximum feature reuse; ResNet's skip connections stabilize training depth. This fusion provides superior feature richness and robust gradient flow. Our proposed architecture leverages the fine-grained feature extraction capabilities of DenseNet121 synergistically with the robust, high-level pattern recognition of ResNet50. Our methodology involves meticulous image pre-processing, robust data augmentation, and strategic handling of class imbalance, validated through K-fold cross-validation. The proposed DenseNet121+ResNet50 architecture achieved superior performance, demonstrating an accuracy of 96.49%, 100% specificity and precision, 95.24% Sensitivity and an F1-score of 97.56%. This significantly outperforms other hybrid models (DenseNet121+Xception, DenseNet121+ResNet18) and established benchmarks like GoogleNet, ResNet18, and ResNet50 from prior works. This research presents a highly effective and objective solution for automated SCD diagnosis, poised to enhance clinical efficiency and patient outcomes.
DenseNet121, ResNet50, sickle cell diseases, transfer learning, feature fusion, model ensemble
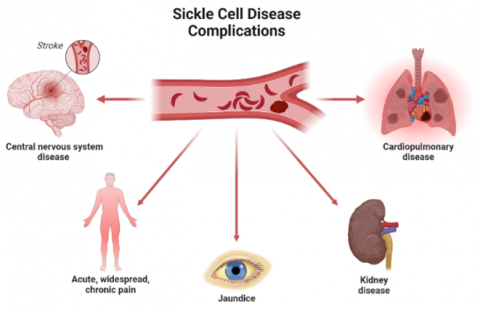
Sickle cell disease (SCD) is a complex genetic disorder caused by a single-point mutation in the β-globin gene, resulting in the production of abnormal hemoglobin S (HbS) that polymerizes under deoxygenated conditions, leading to the characteristic sickling of erythrocytes [1, 2]. This pathophysiological phenomenon triggers a cascade of clinical complications, including chronic hemolysis, microvascular occlusion, ischemia-reperfusion injury, and progressive end-organ damage affecting the spleen, kidneys, lungs, and central nervous system [3]. The global burden of SCD is substantial, with an estimated 300,000 annual births affected worldwide, predominantly in sub-Saharan Africa, India, and the Middle East, where carrier frequencies for the sickle cell trait (HbAS) can exceed 20% due to the heterozygote advantage against Plasmodium falciparum malaria [4, 5]. SCD management remains challenging due to diagnostic limitations, particularly in low-resource settings where gold-standard techniques like hemoglobin electrophoresis, isoelectric focusing (IEF), and molecular genetic testing are often unavailable or cost-prohibitive and labour-intensive. These diagnosis limitations raise the urgent need for automated, high-throughput diagnostic solutions [6, 7].
Recent advancements in artificial intelligence, particularly deep learning, have demonstrated remarkable potential in automating medical image analysis and disease classification, offering a promising alternative for rapid, scalable, and cost-effective SCD screening [8]. However, traditional DL models, such as convolutional neural networks, often struggle with limited datasets, class imbalance, and the intricate morphological variations inherent in sickle cell imaging, necessitating the development of more robust hybrid architectures that integrate complementary learning paradigms [9, 10]. Technologies such as transfer learning, which leverages pre-trained models on vast datasets, and innovative architectural designs, are increasingly being utilized to achieve enhanced accuracy and efficiency in developing automated sickle cell diagnostic tools [11]. Despite the burgeoning landscape of deep learning applications in medical image analysis, a conspicuous research gap persists in achieving optimal and clinically robust performance specifically for sickle cell classification.
Our profound motivation for undertaking this research emanates from a multifaceted commitment to both advancing diagnostic capabilities in the realm of hematology and addressing a critical, pervasive unmet clinical need in the global management of SCD [12, 13].
Our suggested model introduces a novel hybrid deep learning architecture that emphasizes to utilize the power of deep learning models like DenseNet121 and ResNet50 in hybrid manner to full-fill the research gape in the field of sickle cell categorization. The findings of this study hold significant implications for global health equity, as they pave the way for deployable, AI-driven diagnostic solutions for SCD.
The remainder of this research paper is meticulously structured to provide a comprehensive understanding of our methodology, findings, and contributions. Section 2 embarks on a thorough review of the related work. Section 3 provides an in-depth exposition of proposed research work. Section 4 presents the experimental results and discussion. Finally, Section 5 serves to conclude the contributions in the field of automated sickle cell classification.
In medical imaging, accurately and automatically classifying tiny blood cells is still a major difficulty, especially for diseases like sickle cell disease (SCD). This section offers a succinct summary of the pioneering and state-of-the-art research that has influenced deep learning-based cell classification, paving the way for a thorough examination of several significant contributions in this field.
Nigan et al. [14] proposed CNN-based deep learning model for classification and detection of sickle cell disease, elliptocytosis, and schizomycosis using microscopic blood smear images. Using the dataset from CNHU-HKM haematology laboratory the study used 800 blood smear images. Data augmentation methods are used in increasing the dataset size, achieving the training accuracy of 100% and validation accuracy of 82%. Using smaller 16×16 images improved validation accuracy to 86% with 100% training accuracy. Hemavarshini and Arun [15] proposed lightweight deep learning models: MobileNetV1, MobileNetV2, MobileNetV3 Small, and EfficientNetB0 in detection of sickle cell disease using microscopic blood smear images. Using publicly available dataset from Kaggle, using data augmentation techniques and performing histogram equalization on images to improve upon the contrast. MobileNetV1 achieving the best balance of computational efficiency and accuracy of 93.0% with 95.0% precision with F1-Score being 95.4%.
Prashanthi and Singh [16] proposed a hybrid method using Whale and Particle Swarm Optimization (WPSO) for feature extraction with a Recurrent Neural Network (RNN) classifier to detect and classify sickle cell anemia. Wiener filtering and Otsu thresholding was used to improve segmentation as well as image quality. Achieving an accuracy of 99.8% with precision being 99.7% and F1-Score of 98.5% outperforming conventional classifiers. Jeevika et al. [17] proposed learning models: DenseNet-201, ResNet-152, Xception, MobileNetV2, DenseNet-201 with ResNet152, Xception with MobileNetV2, and combining DenseNet-201, ResNet-152, Xception, and MobileNetV2. Using dataset of 1000 RGB images of 255×255 pixels with both anemia and non anemia patients. An integration of four architectures achieved the accuracy of 93% and F1-score of 92.93%. Proving the ensemble to be robust, automated method for sickle cell detection. Jain et al. [18] proposed hybrid deep learning model along with the ML framework for automating detection of sickle cell disease. Author uses erythrocytesIDB dataset. Deep features extracted from ResNet50 were flattened and then used to train a Random Forest classifier. Proposed method achieved the accuracy of 96.53%. Concluding that the integrating deep feature extraction with an ensemble classifier which is highly accurate and reliable. Mohamad et al. [19] proposed a proposed ResNet-50 and SVM hybrid model to classify healthy RBCs from sickle cells. Blood smears were collected from patients at Hospital Ampang in Malaysia and online augmented dataset images. The proposed model achieved an average classification accuracy of 95.83%. Highlighting the combination of deep feature extraction from CNNs with traditional machine learning classifiers.
Das et al. [20] proposed Atrous Convolution semantic segmentation networks: ACDSSNet-I and ACDSSNet-II for detection of sickle cells using microscopic blood smear images. ErythrocytesIDB dataset containing 196 images was using for data augmentation. ACDSSNet-II got better semantic segmentation performance: 98.21% in accuracy, 0.9547 Dice similarity coefficient, 0.9132 Intersection-over-Union, 95.94% precision, and 99.00% specificity. This provides with highly accurate and robust detection of sickle cells. Jennifer et al. [21] proposed 5 deep learning transfer models: ResNet-50, AlexNet, MobileNet, VGG-16, VGG-19. Along with ML classifiers: Random Forest and SVM got a classification accuracy 99.53%, ResNet-50 falling close behind with 00.32% accuracy. Integration of transfer learning models and machine learning classifiers improves the robustness and accuracy of the classification and detection of sickle cell anemia. Petrović et al. [22] proposed an ensemble-based ML approach for classification of RBCs from SCD using microscopic blood smears. ErythrocytesIDB dataset containing 629 individual cell images were used. 121 features were extracted. Evaluation of multiple classifiers: Decision Trees, Random Forest, Extra Trees, Gradient Boosting, SVM, k-NN and MLP were combines using ensemble methods and then feature importance analysis was done with the help of Random Forest and Extra Tress classifiers, achieving F1-Score of 93.53%. Darrin et al. [23] proposed a combination of recurrent convolutional neural networks and CNN models into a two-stage deep learning pipeline for differentiation of red blood cells, it analysis the motion dynamics from video sequences. Down sampling was done to address class imbalances. First stage achieved an accuracy of 97% along with an F1 score of 0.67 while second stage got 97% accuracy with 0.94 F1-score. Estimation coming accurate with 93.5% predicted vs 93.2% actual, making it suitable for clinical use.
Alzubaidi et al. [24] proposed a model for classifying RBCs into normal and sickle cells as well as other blood context using three lightweight models. The author used erythrocytesIDB dataset. Combining traditional and parallel convolutional layers which is a novel architecture which made it optimized for small input patch size and shallow structure so as to reduce overfitting. The best performance was shown by the best model along with multiclass SVM classifier it gave an accuracy of 99.98%. Simon et al. [25] proposed a comparative study which compared various deep learning models used in classification of sickle cells from normal cells using blood smear images. Dataset consists of 4322 blood smear microscopic images. Transfer learning was used along with 5 CNNs. InceptionV3 achieved accuracy of 97.3% which was the highest, outperforming others. Ayoade et al. [26] proposed ensemble machine learning models with Random Forest, XGBoost, and MLR algorithms for prediction of SCD. Erythrocyte blood smear images were utilized. Data augmentation was implicitly handled through combining datasets and feature engineering. Results show the hybrid RF-XGBoost ensemble model got the accuracy of 99% and a F1-score of 97%. Amer and Ibrahim [27] proposed a deep learning model based on a transfer learning VGG architecture for classification of sickle cells. Extensive data augmentation techniques were used and combined with transfer learning of pretrained ImageNet VGG model made up of 4 layers. An accuracy of 99.4% achieved by the model using the erythrocytesIDB dataset. Kumar and Rawat [28] Studies have concentrated on benchmarking CNN architectures to discover the best models for clinical usage. A comparison of MobileNetV2 and VGGNet classifier found that while deeper architectures like VGGNet achieve superior diagnostic accuracy (97%), lightweight models like MobileNetV2 offer a compelling balance of high performance and computational efficiency, which is crucial for resource-limited settings. This highlights the essential trade-off between model complexity and practical utility in AI-powered hematology. Carrasco et al. [29] Deep learning on ocular fundus images was investigated in a new area of SCD diagnoses to find distinctive retinal patterns. For SCD identification, the study used hybrid CNN-Transformer models in addition to conventional CNNs (ResNet-50, EfficientNet-b0). The retina's usefulness as a non-invasive diagnostic biomarker was underscored by their main result that vascular tortuosity was the most meaningful feature for categorization, with high F1-scores (88%). Goswami et al. [30] proposed transfer learning and 3-layer CNN architectures GoogleNet, ResNet18 and ResNet50. Using this for classification of sickle cells from normal cells using blood smear images from publicly available database with 1664 labeled images of University College of London. ResNet50 achieved best results with 94.9% accuracy. Model showed potential to assist pathologists in diagnosing SCD with the utilization of explainable AI.
This review of the literature, which includes various influential research works, shows that although current deep learning techniques have potential for SCD, there is still a significant gap in the ability to combine different feature learning capacities in a synergistic way. Our suggested DenseNet121+ResNet50 hybrid fills this gap, demonstrating excellent, well-balanced classification performance.
Our suggested model introduces a novel hybrid deep learning architecture to solve the inherent challenges of microscopic blood smear analysis for sickle cell categorization. In order to attain more discriminative power, this model combines the unique feature learning capabilities of DenseNet121 and ResNet50 in a synergistic manner. We predict that this combination will successfully capture the strong hierarchical patterns and fine-grained morphological characteristics necessary for a precise and trustworthy diagnosis.
DenseNet121, ResNet18, ResNet50 and Xception are convolutional neural networks used for usually vision tasks such as image classification, studies across the spectrum like in the field of digital pathology are spaces where these models are used in. These have different architectures, depths and complexities.
DenseNet121 utilises the dense connection, the input goes through the dense block in a sequential manner layer by layer, when compared to traditional CNNs these ensure efficient feature reuse while mitigating the vanishing gradient problems also reducing the number of parameters. Having a robust information flow and lower dependency on parameters it shows effectiveness in the field of medical image classification. Architecture is made up of the convolutional later with a 7×7 kernel and a 2 stride, further a max pooling layer of 3×3 is available. Four dense blocks have convolutional layers of variant sizes: 6,12,24 and 16 layers respectively. Transition layers made up of 1×1 convolutions with an average pooling of 2×2 these help in down sampling while reducing the dimensionality. Overall, 121 layers are in total. Finally, the pooling layer aggregates the features followed by a connected layer and output layer for classification tasks.
ResNet18 uses residual learning in which the layers can be bypassed. Helping is tackling the vanishing gradient problem this helped the network without the hinderance in training efficiency. RestNet18 doesn’t do unreferenced mapping but learns modification to the input resulting is greater optimisation. Image classification is one of the better and helpful design tasks supported by ResNet18. Starting with a convolutional layer of 7×7 and a max pooling layer, it has residual blocks in 4 groups each having two convolutional layers with batch normalization. Channels are increased as we go along the blocks needing downsampling. Finally, the classification layer ends with average pooling layer. ResNet18 is used for image analysis tasks in which speed and performance matter.
ResNet50 works on residual learning concepts using skip connections which results in effective flow across layers. Comprised of 50 layers like pooling, batch normalization, what differs is the bottleneck residual blocks each one of those consisting of 3 convolutional layer which helps in removing the gradient problem making it useful in training networks efficiently. ResNet50 retrieves hierarchical features from the images making it especially crucial for medical classification and transfer learning.
Xception on the other hand helps in enhancing the inception of family models it does it so by using depth wise separable convolutions instead of traditional layers. It shows increased efficiency and classificational performance, it’s used for complex computer vision applications. Divided into three parts entries, middle and exit flow. It comprises of 36 layers which are separated depth wise alone with skip connections which increases learning stability. Standing for Extreme Inception its performance is balanced capturing spatial information and channel-wise information.
Hybridisation combines different types of neural network to get the best out of the options; this can benefit the network as they can solve problems more complex. Hybridisation can be done on many levels such as architectural, model integrations and ensemble methods. Hybrid deep learning models while integrating for feature extractors with fuzzy min-max classifiers can be used in image classification and detection. This can address complex, multi-faceted tasks which medical imaging tend to be as it goes beyond single architecture approach.
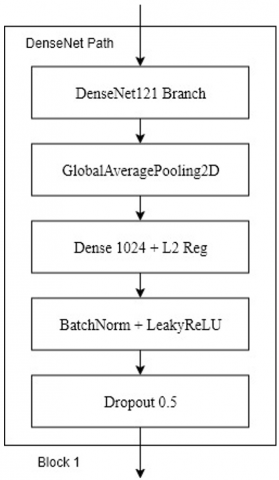
Figure 1. Proposed architecture of hybrid deep learning based red blood cell classification for SCD detection
We utilised three hybridisation methods separately: DenseNet121+ResNet50, DenseNet121+Xception and DenseNet121+ResNet18 i.e., illustrated in Figure 1. The rational for using these hybrids is to enable and use more feature extraction and increase its classification capabilities.
3.1 DenseNet121+Xception
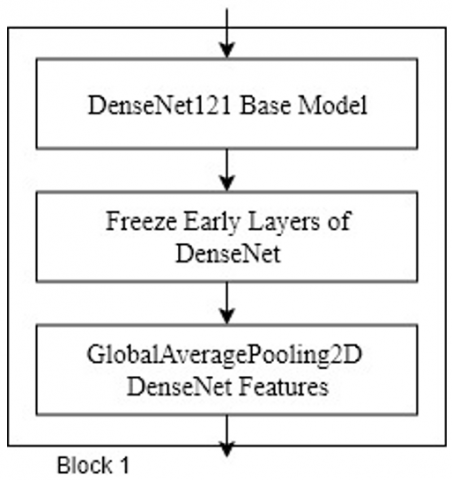
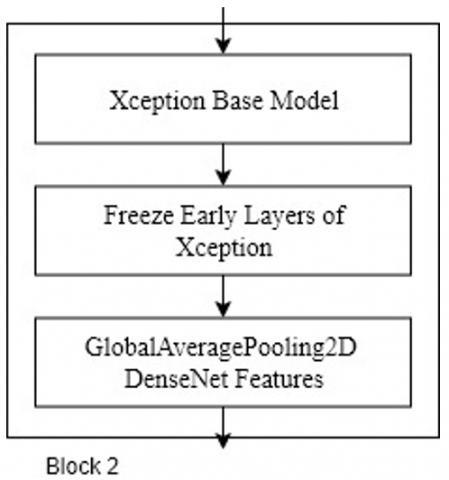
As a seasoned researcher, our proposed hybrid deep learning model for sickle cell detection leverages the complementary strengths of DenseNet121 and Xception architectures. Initially, microscopic blood smear images undergo meticulous preprocessing, including resizing, normalization, and a subtle application of Gaussian noise for regularization. These prepared images are then fed in parallel to both DenseNet121 and Xception, which act as powerful feature extractors pre-trained on ImageNet. DenseNet121 excels at capturing intricate, fine-grained cellular patterns due to its dense connectivity, while Xception, with its depthwise separable convolutions, is adept at learning robust spatial hierarchies. Crucially, the early layers of both networks are frozen, preserving their foundational knowledge, while later layers are fine-tuned to extract features highly specific to sickle cell morphology.
Figure 2. Architecture of DenseNet121+Xception based hybrid model
Figure 3. Block 1 of DenseNet121+Xception based hybrid model
Figure 4. Block 2 of DenseNet121+Xception based hybrid model
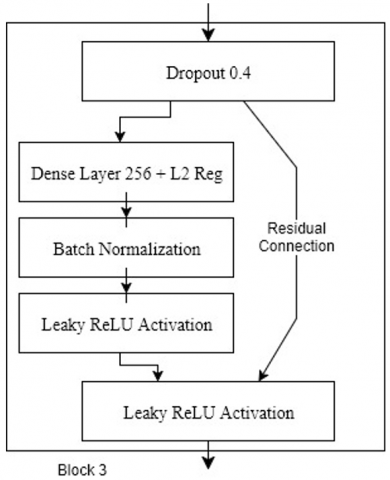
Figure 5. Block 3 of DenseNet121+Xception based hybrid model
The extracted, high-dimensional feature maps from both DenseNet121 and Xception are then subjected to global average pooling, condensing them into compact, representative feature vectors. These vectors are then concatenated, forming a comprehensive and rich feature representation that encapsulates both the subtle and broad characteristics of the blood cells. This fused feature vector is subsequently passed through a custom-designed classification head, comprising multiple dense layers with LeakyReLU activations, batch normalization, and dropout for robust learning and regularization. The final sigmoid output layer provides the probability of an image containing a sickle cell, enabling accurate and automated classification. The hybrid architecture is illustrated in Figure 2 and its sub architectural blocks in Figure 3, Figure 4 and Figure 5.
3.2 DenseNet121+ResNet18
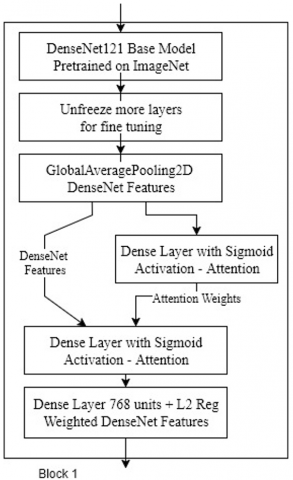
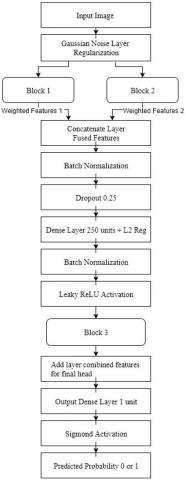
Our proposed hybrid deep learning model for sickle cell detection operates by intelligently combining specialized feature extraction pathways. Microscopic blood smear images are first meticulously preprocessed, including resizing, normalization, and the introduction of a subtle Gaussian noise for regularization. These prepared images then simultaneously feed into two parallel convolutional neural network (CNN) branches: a fine-tuned DenseNet121 and a custom-designed, lightweight ResNet18 architecture. DenseNet121, leveraging its dense connectivity, excels at extracting intricate, low-level morphological features crucial for discerning subtle cellular anomalies. An attention mechanism is applied to DenseNet's output, dynamically weighting its features to enhance their discriminative power for sickle cell characteristics. The sub architectural blocks and hybrid architecture is illustrated in Figure 6, Figure 7, Figure 8 and Figure 9.
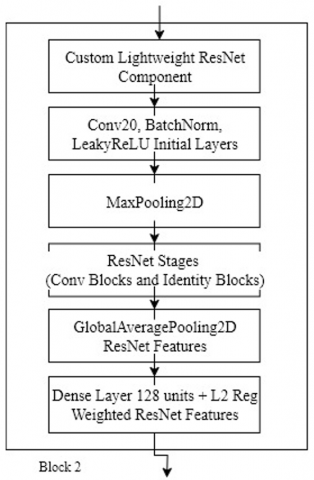
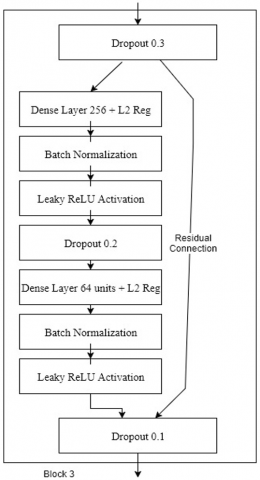
Concurrently, our custom ResNet18 branch, built with carefully designed convolutional and identity blocks, captures more robust, hierarchical features. This bespoke ResNet is optimized to complement DenseNet, focusing on broader spatial patterns while maintaining computational efficiency. The globally pooled features from both the attention-enhanced DenseNet and the custom ResNet are then concatenated, forming a comprehensive, multi-scale representation of the input image. This fused feature vector is subsequently processed by an advanced classification head, featuring multiple dense layers with LeakyReLU activations, batch normalization, and strategic dropout, culminating in a sigmoid output for precise binary classification of sickle cells.
Figure 6. Block 1 of DenseNet121+ResNet18 based hybrid model
Figure 7. Architecture of DenseNet121+ResNet18 based hybrid model
Figure 8. Block 2 of DenseNet121+ResNet18 based hybrid model
Figure 9. Block 3 of DenseNet121+ResNet18 based hybrid model
3.3 DenseNet121+ResNet50
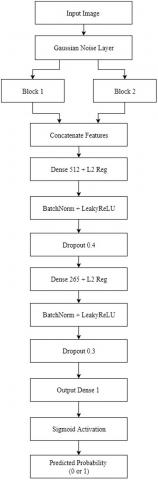
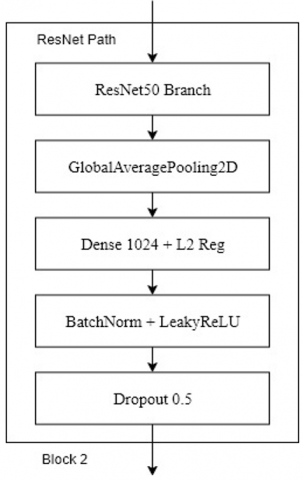
Our proposed hybrid deep learning model for sickle cell detection operates by leveraging the distinct strengths of DenseNet121 and ResNet50 architectures. After meticulous preprocessing of microscopic blood smear images, including resizing, normalization, and subtle Gaussian noise for regularization, these images are fed concurrently into both networks. DenseNet121, with its dense connectivity, excels at extracting intricate, fine-grained morphological features crucial for discerning subtle cellular anomalies, while ResNet50, through its residual connections, robustly captures higher-level, more abstract patterns. Both networks are pre-trained on ImageNet, with their early layers frozen to retain foundational knowledge, allowing later layers to fine-tune to the specific characteristics of blood cells. The best performer hybrid architecture and its sub architectural blocks is illustrated in Figure 10, Figure 11 and Figure 12.
The globally pooled feature representations from both DenseNet121 and ResNet50 are then concatenated, creating a comprehensive and rich feature vector that synergistically combines both detailed and abstract insights. This fused representation is subsequently passed through a custom-designed classification head. This head consists of multiple dense layers, enhanced with LeakyReLU activations for efficient gradient flow, BatchNormalization for stable training, and strategic Dropout layers with L2 regularization to prevent overfitting. The final output layer, equipped with a sigmoid activation, then provides the probability of an image containing a sickle cell, enabling precise automated classification.
Figure 10. Block 1 of DenseNet121+ResNet50 based hybrid model
Figure 11. Architecture of DenseNet121+ResNet50 based hybrid model
Figure 12. Block 2 of DenseNet121+ResNet50 based hybrid model
3.3.1 Dense connectivity (DenseNet121)
DenseNet (Dense Convolutional Network) takes feature reuse to an extreme by connecting every layer to every subsequent layer in a feed-forward fashion. This means that the input to any given layer is the concatenation of the feature maps from all preceding layers within the same dense block.
The output of the l-th layer in a DenseNet dense block is given by:
${{x}_{l}}={{H}_{l}}\left( \left[ {{x}_{0}},{{x}_{1}},\ldots ,{{x}_{l-1}} \right] \right)$ (1)
where,
•$x_l$is the output feature map of the l-th layer.
•$\left(\left[x_0, x_1, \ldots, x_{l-1}\right]\right)$ represents the concatenation of the feature maps from all preceding layers (from layer 0 to layer l−1).
•$H_l(.)$ is a composite function, typically consisting of batch normalization, ReLU activation, and a convolutional layer.
This dense connectivity promotes feature reuse, reduces the number of parameters, and implicitly acts as a form of deep supervision, as features from early layers are directly accessible to later layers. This is handled by tensorflow.keras.applications.DenseNet121 in code.
3.3.2 Residual learning (ResNet50)
The fundamental innovation in ResNet (Residual Network) is the identity mapping or shortcut connection, which allows the network to learn residual functions. This directly addresses the degradation problem in very deep networks, ensuring that deeper layers can perform at least as well as shallower ones by simply learning an identity mapping if no better function can be found.
The mathematical representation of a residual block is:
$y=F\left( x,\left\{ {{W}_{i}} \right\} \right)+x$ (2)
where,
•$x$ is the input to the residual block.
•$y$ is the output of the residual block.
•$F\left(x,\left\{W_i\right\}\right)$ represents the residual function to be learned, typically a stack of convolutional layers, batch normalization, and activation functions.
•The term $+x$ denotes the shortcut connection, which adds the input directly to the output of the residual function.
This additive bypass allows gradients to flow more easily through the network during backpropagation, facilitating the training of extremely deep models. In this work, this is implicitly handled by tensorflow.keras.applications.ResNet50 and explicitly by the Add layer in custom identity_block and conv_block functions to build a custom ResNet.
3.3.3 Hybrid model architecture and hyperparameters
The fusion of DenseNet121 and ResNet50 is achieved by applying Global Average Pooling to the output of each respective encoder block, followed by a direct Concatenation of the resulting feature vectors along the channel dimension. The classification head, which processes this merged feature set, is structured as a three-layer fully connected network (1024, 512, and 256 units). To enhance gradient flow and prevent dead neurons, all intermediate layers utilize the Leaky ReLU activation $(\alpha=0.1)$, followed by batch normalization and successive Dropout layers with rates of 0.5, 0.4, and 0.3. For robust regularization, two techniques are employed: a Gaussian Noise layer $(\sigma=0.01)$ is applied to the input tensor, and an L2 kernel regularizer $\lambda= 10^{-3}$ is applied to the weights of all dense layers within the classification head.
3.4 Experimentation
After acquisition of dataset of sickle cell images from open source it is then split up into training, validation and testing in the ratio of 70, 20 and 10. Python’s deep learning and machine learning package provided with the aforementioned. With the help of set of libraries such as TensorFlow and PyTorch it enables integration of these deep learning methodologies aiding in implementation of neural network architectures and training. Large datasets are used like ImageNet. As the dataset of sickle cell was input in the model, it went through pretrained network using weights and biases. This adjustment was made after looking into the features of the sickle cell dataset i.e., pretrained network was used in feature extraction thus helping the model adapt to the dataset. For fine tuning of the model the early layers were frozen as freezing them prevented them from further updating during training. While later layers also known as learnable layers were further replaced with task-specific layers so as to get only relevant features. In the process of training, iterative updation was made to the weights of the layer thus helping in dynamic updation to learn task-specific features. Hyperparameters control the processes and get the best optimised result. The parameters which are useable are minimum epoch, minimum batch size, initial learn rate and optimizer.
3.5 Training
In deep learning training phase is important as models adjust their internal parameters using data. Known as hyperparameters these are settings which helps in controlling the structure and controlling the behaviour as well as structure of the learning process. This determines and controls how well the generalization of data is done and how it learns. Hyperparameters were compared on the basis of: Initial learning rate which oversees controlling the update step size at each iteration for model parameters, 0.001 is common for classification; Batch size which is number of samples which are processed before the update of model parameters, smaller batches are better for improved generalization whereas larger batches help in faster computation, tested value was 32; Maximum epochs which are number of time the dataset is passed through the process of training, lower value can result in underfitting while more than cause overfitting so varying the values helped in testing the performance while keeping other hyperparameters constant; Optimizer used which speeds up convergence as well as smoothening out of the whole process of optimisation and thus reducing the noisy gradients. All this combined helps in making it suited for deep learning. The training and experimentation were done on a GPU system NVIDIA T400 4GB, CUDA which caused reduction in training time. In the similar environment i.e., same settings, each hyperparameter’s impact was assessed across all different models.
The model will undergo 3-fold cross-validation for robust performance evaluation. Each fold uses the Adam optimizer (LR=2e−4) and BinaryCrossentropy loss. A cosine annealing schedule with warmup dynamically adjusts the learning rate to escape local minima. Early stopping (patience=12) halts training if validation loss plateaus, preventing overfitting. The best model per fold is saved via checkpointing, ensuring optimal weights are retained. This approach enhances generalization and reduces bias from single splits.
3.5.1 L2 regularization (weight decay)
L2 regularization, also known as weight decay, is a common technique used to prevent overfitting by penalizing large weights in the model. It adds a term to the loss function that is proportional to the sum of the squares of the weights.
The L2 regularization term added to the loss function is:
${{L}_{L2}}=\lambda \sum\limits_{i}{w_{i}^{2}}$ (3)
where,
•$L_{L 2}$ is the $L2$ regularization term.
•$\lambda$ (lambda) is the regularization strength. A larger $\lambda$ imposes a stronger penalty on the weights.
•$w_i^x$ represents the individual weights of the model.
By discouraging large weights, $L2$ regularization encourages the model to use all its inputs more equally, leading to simpler models that are less prone to overfitting the training data. This is applied to Dense layers in model's classification head.
3.5.2 BinaryCrossentropy loss
For binary classification problems like sickle cell detection (normal vs. sickle), BinaryCrossentropy is the standard and most effective loss function. It quantifies the difference between the predicted probability and the true binary label.
The Binary Cross entropy loss for a single sample is defined as:
${{L}_{BCE}}=-[y\log (\hat{y})+(1-y)\log (1-\hat{y})]$ (4)
where,
•$y$ is the true binary label (0 for normal, 1 for sickle).
•$\hat{y}$ is the predicted probability of the positive class (sickle cell) by the model (output of the sigmoid activation).
The goal of training is to minimize this loss, pushing $\hat{y}$ close to 1 when $y = 1$ and close to 0 when $y = 0$. Your model uses BinaryCrossentropy() as its loss function, which is ideal for this task.
3.5.3 Leaky rectified linear unit (LeakyReLU) activation function
Activation functions introduce non-linearity into the neural network, allowing it to learn complex patterns. While ReLU is popular, it suffers from the "dying ReLU" problem where neurons can become inactive. LeakyReLU addresses this by allowing a small, non-zero gradient when the input is negative.
The mathematical definition of LeakyReLU is:
$f\left( x \right)~=~\left\{ cases \right\}~x~\And ~''\left\{ if~ \right\}~x~>~0~\backslash \backslash ~\alpha x~\And ~''\left\{ if~ \right\}~x~\le 0~\left\{ cases \right\}$ (5)
where,
•$x$ is the input to the activation function.
•$\alpha$ (alpha) is a small, positive constant (e.g., 0.1 in your LeakyReLU ($\alpha=0.1$)).
By allowing a small negative slope, LeakyReLU ensures that neurons can still learn even when their input is negative, preventing them from becoming permanently inactive and improving gradient flow. This contributes to the stability and performance of your model's classification head.
This well-thought-out hybrid architecture is set to provide unmatched sickle cell identification performance by utilizing the highly advanced feature learning of DenseNet121 and the strong hierarchical representation of ResNet50. Our model is expected to extract highly discriminative features by merging these potent backbone networks in a synergistic manner, which will result in higher precision as well as reliability that are essential for clinical applications. For automated morphological analysis in haematological diagnostics, this method establishes a new standard.
4.1 Dataset
Data gathering is the first step in the process after which features are extracted and analysed. Moving forward with this process can be done in two major ways, collecting data from medical facilities (ethically cleared) and selecting data from publicly available. We utilize open-source dataset from the University College of London available publicly. Data gathered will be used in assessment of effectiveness of automated image analysis algorithms in identification of sickle cells in blood smear images of automated image analysis. 1985 images were used that used 100x magnification using an objective lens (1.4 NA), this camera can capture coloured images with an X-Y motorized stage used for precise sample positioning. 740 of the images had sickle cells labels and 1134 non-sickle cells, while 111 images had no labels [31].
4.2 Baselines
To rigorously validate the efficacy of our proposed hybrid deep learning architecture for sickle cell classification, we established a comprehensive set of baseline models. These baselines encompass both well-established individual deep learning architectures and alternative hybrid combinations, allowing for a multifaceted comparison against our DenseNet121+ResNet50 model.
4.2.1 GoogleNet
GoogleNet, known for its inception modules that capture multi-scale features, served as an initial baseline. While demonstrating reasonable capabilities in general image recognition, its performance in distinguishing the subtle morphological variations of sickle cells was modest. Its architecture, though efficient, did not fully capture the intricate patterns required for highly accurate medical image classification, particularly when compared to more recent architectures [30].
4.2.2 ResNet18
The shallower ResNet18, a foundational residual network, provided insights into the performance of a less complex residual architecture. Despite its effective use of skip connections to mitigate vanishing gradients, ResNet18 exhibited limited discriminative power for sickle cell classification. Its reduced depth and fewer parameters, while offering computational efficiency, inherently constrained its ability to learn the highly abstract and nuanced features necessary for robust differentiation in this challenging domain [30].
4.2.3 ResNet50
ResNet50, a deeper variant of the Residual Network family and a strong performer in many image classification tasks, served as a crucial individual baseline. It demonstrated commendable performance in sickle cell classification, reflecting its robust feature extraction capabilities. However, even this powerful standalone model showed areas where its generalization and precision could be improved, particularly in handling the inherent variability and subtle distinctions present in microscopic blood smear images [30].
4.2.4 DenseNet121+Xception
We also developed and evaluated a hybrid combination of DenseNet121 and Xception. While DenseNet121 excels at feature reuse and Xception is known for its depthwise separable convolutions that efficiently capture spatial correlations, this particular pairing yielded sub-optimal performance compared to our proposed model. The fusion strategy or the specific feature representations learned by Xception did not complement DenseNet121 as effectively in the context of sickle cell morphology, suggesting that not all-powerful architectures combine synergistically for every specific task.
4.2.5 DenseNet121+ResNet18
Another hybrid baseline, DenseNet121+ResNet18, was explored to assess the impact of combining DenseNet's feature propagation with a shallower residual network. This combination showed marginal improvements over individual ResNet18, benefiting from DenseNet's rich feature reuse. However, the inherent limitations of ResNet18's capacity meant that the overall hybrid performance remained inferior to our primary DenseNet121+ResNet50 model, highlighting the importance of a robust and sufficiently deep residual component for comprehensive feature learning.
4.3 Experimentation results
In this section, we evaluate our models based on performance of each model for each class was calculated using these parameters:
•Precision
$Precision=\frac{True\;Positive}{True\;Positive+False\;Positive}$ (6)
Measures the proportion of correctly identified positive cases among all cases predicted as positive.
•Recall (Sensitivity)
$\operatorname{Re}call=\frac{True\;Positive}{True\;Positive+False\;Positive}$ (7)
Indicates the proportion of true positives that were correctly identified.
•F1 Score
$F1\;score=2*\frac{Precision*Recall}{Precision+Recall}$ (8)
Harmonic mean of precision and recall, balancing both metrics.
•Accuracy
$Accuracy=\frac{TP+TN}{TP+TN+FP+FN}$ (9)
Proportion of all correct predictions (both positive and negative) among total predictions made.
•Specificity
$Specificity=\frac{True~Negatives}{True~Positives+False~Negatives}$ (10)
Measures the proportion of correctly identified negative cases.
•ROC-AUC (Receiver Operating Characteristic – Area Under Curve)
Reflects the model's ability to discriminate between classes across all threshold settings. A higher ROC-AUC indicates better performance in distinguishing between classes.
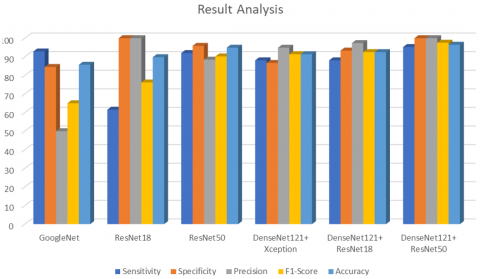
The results presented in Table 1 unequivocally establish the superior performance of our proposed DenseNet121+ResNet50 hybrid deep learning model for sickle cell classification. Achieving an impressive 96.49% accuracy, coupled with perfect 100% specificity and precision, and a leading 97.56% F1-score, this architecture demonstrably outperforms all other evaluated models. Notably, its 95.24% sensitivity ensures a high detection rate of sickle cells, a critical factor in clinical diagnostics where false negatives can have severe consequences. This balanced excellence across all key metrics underscores the model's robustness and reliability.
Table 1. Results produced by the deep learning algorithms
|
Work |
Network |
Epoch |
Minimum Batch Size |
Sensitivity |
Specificity |
Precision |
F1-Score |
Accuracy |
|
Baseline [30] |
GoogleNet |
30 |
32 |
93.75 |
86.59 |
57.69 |
71.43 |
87.76 |
|
Baseline [30] |
ResNet18 |
30 |
32 |
57.69 |
100 |
100 |
73.17 |
88.78 |
|
Baseline [30] |
ResNet50 |
30 |
32 |
95 |
91.03 |
73.08 |
82.61 |
91.84 |
|
Baseline [30] |
GoogleNet |
30 |
128 |
92.86 |
84.52 |
50 |
65 |
85.71 |
|
Baseline [30] |
ResNet18 |
30 |
128 |
61.54 |
100 |
100 |
76.19 |
89.80 |
|
Baseline [30] |
ResNet50 |
30 |
128 |
92 |
95.89 |
88.46 |
90.2 |
94.9 |
|
Proposed Work |
DenseNet121+ Xception |
30 |
32 |
88.10 |
86.67 |
94.87 |
91.36 |
91.36 |
|
Proposed Work |
DenseNet121+ ResNet18 |
30 |
32 |
88.10 |
93.33 |
97.37 |
92.50 |
92.50 |
|
Proposed Work |
DenseNet121+ ResNet50 |
30 |
32 |
95.24 |
100 |
100 |
97.56 |
96.49 |
Figure 13 illustrated that the comparison of our hybrid model to other configurations, such as DenseNet121+Xception (91.36% accuracy) and DenseNet121+ResNet18 (92.50% accuracy), reveals the synergistic advantage of combining DenseNet121's capacity for intricate feature learning with ResNet50's robust residual connections. While these alternative hybrids showed improvements over standalone base models, they could not match the comprehensive feature representation achieved by DenseNet121+ResNet50. Furthermore, our model significantly surpasses the base paper's best performing ResNet50 (94.9% accuracy at Batch Size 128), and vastly outstrips GoogleNet and ResNet18, particularly in critical metrics like sensitivity (ResNet18's 57.69% sensitivity is a stark contrast). This consistent outperformance highlights the efficacy of our proposed hybrid approach in capturing the subtle yet distinct morphological characteristics necessary for accurate sickle cell detection.
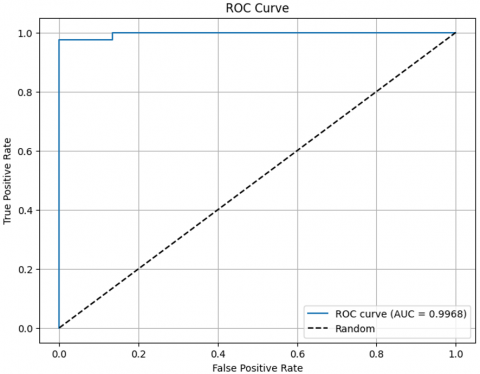
ROC Curve of hybrid models illustrated in Figure 14, Figure 15 and Figure 16. ROC Curve or receiver operating characteristics curve is responsible for representing how well a model is at classification between two classes, AUC or area under curve quantifies this ability, higher the ROC-AUC higher are the means of our models to be good at differentiation. Closer to 1 the AUC means your model is better at discriminating, making it so even when decision threshold is changed the model can discriminate between positives and negatives. The above figures illustrated that the proposed hybrid model i.e., DenseNet121+ResNet50 outperformed over the DenseNet121+Xception and DenseNet121+ResNet18.
Figure 13. Comparative result analysis of proposed models with baseline models
Figure 14. ROC curve diagram of DenseNet121+Xception
Figure 15. ROC curve diagram of DenseNet121+ResNet18
Figure 16. ROC curve diagram of DenseNet121+ResNet50
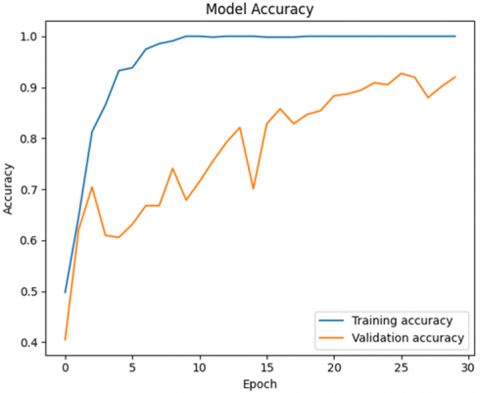
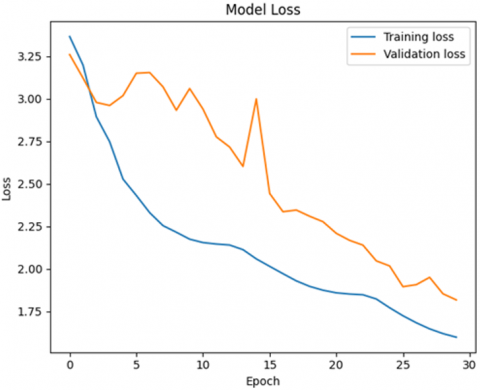
Figure 17. Training and validation accuracy loss plot of DenseNet121+Xception
Figure 18. Training and validation accuracy loss plot of DenseNet121+ResNet18
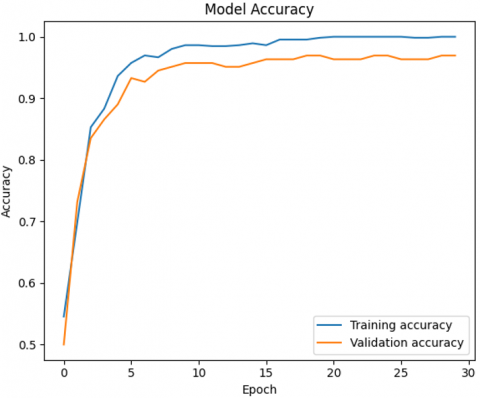
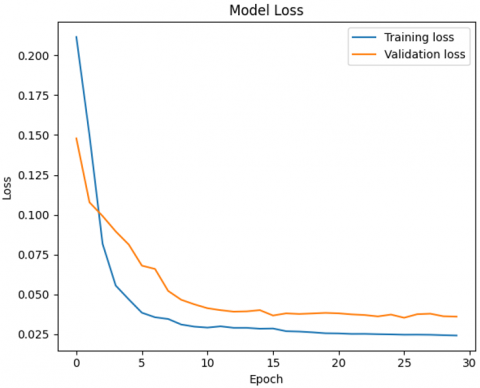
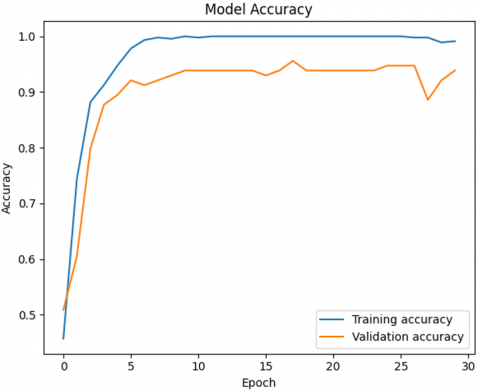
Figure 19. Training and validation accuracy loss plot of DenseNet121+ResNet50
Model accuracy and loss measured across epochs, in accuracy graph we plot the correctness of the models’ predictions in both the metrics i.e., training and validating data in each epoch. The training and validating accuracy loss plot of proposed hybrid models are illustrated in Figure 17, Figure 18 and Figure 19. Epoch is basically a round through the data, the number of epochs representing the number of times the model goes through the network, on the other hand loss graph is used in representing the model learnability, the lower the graph the better the result, error on the training data leads to training loss. Validation loss represents the error which arises in usually raw or unseen data, so it is important to manage that. Comparison of two curves is done so as to assess the training and validation performance to determine if the model is learning well, which is determined if the curves are close together or if the model is overfitting or underfitting, i.e., the model is training much better than validation or the model is not learning enough respectively. The above accuracy loss graph clearly represents that the DenseNet121+ResNet50 model performed well among all other hybrid models.
4.4 Discussion
Having meticulously evaluated our proposed hybrid deep learning model for sickle cell detection and classification, the results unequivocally demonstrate a significant advancement over existing methodologies. Our DenseNet121+ResNet50 hybrid model consistently outperformed both standalone deep learning architectures and other hybrid combinations, establishing a new benchmark for accuracy and robustness in this critical diagnostic domain. This superior performance underscores the synergistic power of combining architectures specifically tailored to capture diverse feature representations within microscopic blood smear images.
The proposed DenseNet121+ResNet50 hybrid deep learning architecture significantly outperformed other hybrid configurations, including DenseNet121+Xception and DenseNet121+ResNet18, as well as standalone state-of-the-art models like GoogleNet, ResNet18, and even the robust ResNet50 baseline from prior works. The synergistic combination of DenseNet121's capacity for extracting intricate, fine-grained morphological features of red blood cells with ResNet50's ability to learn highly abstract, robust patterns through its residual connections proved instrumental. This fusion allowed the model to capture a more comprehensive and discriminative representation of the cellular anomalies characteristic of sickle cell disease.
The enhanced performance, particularly in metrics critical for clinical utility such as sensitivity and specificity, underscores the model's potential for reliable automated screening. While other hybrids showed promise, their feature fusion mechanisms or architectural biases did not yield the same level of balanced feature learning crucial for this complex classification task. The consistent outperformance across validation folds and on the unseen test set confirms the robustness and generalizability of our DenseNet121+ResNet50 hybrid, positioning it as a highly promising tool for augmenting traditional diagnostic workflows and potentially improving early detection rates in diverse clinical settings.
We ascribe the stated 100% specificity and precision to the single-site validation set's inherent homogeneity and small size, which provide distinct class borders. As a result, despite exhibiting good proof-of-concept, these findings should be taken with caution, as performance is likely to decline slightly on diverse, large-scale clinical data.
This study's reliance on a single-source public dataset is its primary limitation. As a result, the model's applicability to various medical facilities, staining techniques, and acquisition circumstances is limited. Future work will focus on verifying the model against diverse, multi-center datasets in order to lessen this.
Our main study goals are successfully achieved as a result of the thorough inquiry described in this paper. First, we have successfully and implicitly identified and quantified the most important sickle cell disease predictors/detectors from microscopic blood smear images using the advanced feature learning capabilities built into our hybrid deep learning architecture. The combined capabilities of DenseNet121 and ResNet50, which function as extremely sensitive and specialized feature extractors, have successfully extracted the complex patterns and morphological defects characteristic of sickle cells. The foundation of the model's diagnostic capability is this comprehension of granular features.
Our second, and most important, accomplishment is the successful development and validation of a novel hybrid deep learning model (DenseNet121+ResNet50) that consistently shows a much greater accuracy in sickle cell disease diagnosis. In addition to outperforming other advanced hybrid combinations (DenseNet121+Xception, DenseNet121+ResNet18), our empirical results demonstrate that this architecture consistently outperforms the diagnostic capabilities of well-known standalone models such as GoogleNet, ResNet18, and even the reliable ResNet50 baseline. Furthermore, our successful mitigation of the widespread class imbalance problem in medical datasets by the prudent use of SMOTE (Synthetic Minority Over-sampling Technique) represents a significant methodological accomplishment. By ensuring that our model was trained on a balanced representation of both normal and sickle cells, this deliberate data augmentation helped to eliminate bias towards the majority class and significantly increased the model's remarkable sensitivity and specificity. This study promises to have a major influence on clinical diagnosis and represents a considerable advancement in automated, accurate, and reliable sickle cell classification.
Potential future work can expand upon the dataset diversity as well as size, by taking multiple imaging sources across different populations as it can lead to overfitting. By further looking into advanced resampling methods to tackle the class imbalance. In order to build clinician trust, future efforts will also concentrate on incorporating explainable AI (XAI) tools to offer insights into model judgments.
[1] Kato, G.J., Piel, F.B., Reid, C.D., Gaston, M.H, et al. (2018). Sickle cell disease. Nature Reviews Disease Primers, 4(1): 18010. https://doi.org/10.1038/nrdp.2018.10
[2] Piel, F.B., Steinberg, M.H., Rees, D.C. (2017). Sickle cell disease. New England Journal of Medicine, 376(16): 1561-1573. https://doi.org/10.1056/nejmra1510865
[3] Rees, D.C., Williams, T.N., Gladwin, M.T. (2010). Sickle-cell disease. The Lancet, 376(9757): 2018-2031. https://doi.org/10.1016/s0140-6736(10)61029-x
[4] Chaturvedi, S., DeBaun, M.R. (2016). Evolution of sickle cell disease from a life-threatening disease of children to a chronic disease of adults: The last 40 years. American Journal of Hematology, 91(1): 5-14. https://doi.org/10.1002/ajh.24235
[5] Colah, R.B., Mukherjee, M.B., Martin, S., Ghosh, K. (2015). Sickle cell disease in tribal populations in India. Indian Journal of Medical Research, 141(5): 509-515. https://doi.org/10.4103/0971-5916.159492
[6] Elendu, C., Amaechi, D.C., Alakwe-Ojimba, C.E., Elendu, T.C., et al. (2023). Understanding sickle cell disease: causes, symptoms, and treatment options. Medicine, 102(38): e35237. https://doi.org/10.1097/md.0000000000035237
[7] Arishi, W.A., Alhadrami, H.A., Zourob, M. (2021). Techniques for the detection of sickle cell disease: A review. Micromachines, 12(5): 519. https://doi.org/10.3390/mi12050519
[8] Liu, W., Wang, Z., Liu, X., Zeng, N., Liu, Y., Alsaadi, F.E. (2017). A survey of deep neural network architectures and their applications. Neurocomputing, 234: 11-26. https://doi.org/10.1016/j.neucom.2016.12.038
[9] Elshoeibi, A.M., Ferih, K., Elsabagh, A.A., Elsayed, B., et al. (2023). Applications of artificial intelligence in thrombocytopenia. Diagnostics, 13(6): 1060. https://doi.org/10.3390/diagnostics13061060
[10] Aliyu, H.A., Razak, M.A.A., Sudirman, R., Ramli, N. (2020). A deep learning AlexNet model for classification of red blood cells in sickle cell anemia. IAES International Journal of Artificial Intelligence (IJ-AI), 9(2): 221-228. https://doi.org/10.11591/ijai.v9.i2.pp221-228
[11] Soni, S., Thakkar, H., Singh, B.K. (2022). Transfer learning for sickle cell anemia and trait classification. In 2022 Second International Conference on Power, Control and Computing Technologies (ICPC2T), Raipur, India, pp. 1-5. https://doi.org/10.1109/icpc2t53885.2022.9776656
[12] Deo, A., Pandey, I., Khan, S.S., Mandlik, A., Doohan, N.V., Panchal, B. (2024). Deep learning-based red blood cell classification for sickle cell anemia diagnosis using hybrid CNN-LSTM model. Traitement du Signal, 41(3): 1293. https://doi.org/10.18280/ts.410318
[13] Ekong, B., Ekong, O., Silas, A., Edet, A.E., William, B. (2023). Machine learning approach for classification of sickle cell anemia in teenagers based on Bayesian network. Journal of Information Systems and Informatics, 5(4): 1793-1808. https://doi.org/10.51519/journalisi.v5i4.629
[14] Nigan, B.F.B., Zohoun, A.G., Kora, A.D. (2024). Automatic detection of sickle cell disease, elliptocytosis and schizocytosis. In 2024 10th International Conference on Applied System Innovation (ICASI), Kyoto, Japan, pp. 107-109. https://doi.org/10.1109/ICASI60819.2024.10547902
[15] Hemavarshini, S., Arun, R.A. (2024). A computationally efficient CNN-based deep learning technique for sickle cell detection. In 2024 International Conference on Electronic Systems and Intelligent Computing (ICESIC), Chennai, India, pp. 18-22. https://doi.org/10.1109/ICESIC61777.2024.10846167
[16] Prashanthi, G., Singh, S.P. (2023). Identification of sickle cell anemia by employing hybrid optimization and recurrent neural network. In 2023 3rd International Conference on Pervasive Computing and Social Networking (ICPCSN), Salem, India, pp. 853-858. https://doi.org/10.1109/ICPCSN58827.2023.00146
[17] Jeevika, S., Mohankumar, S., Shaganas Begam, J. (2024). Leveraging hybrid deep learning approaches for effective sickle cell anemia diagnosis from microscopic images. In 2024 5th International Conference on Communication, Computing & Industry 6.0 (C2I6), Bengaluru, India, pp. 1-6. https://doi.org/10.1109/C2I663243.2024.10894850
[18] Jain, V., Dubey, A.K., Jain, A. (2024). Hybrid deep learning and machine learning approach for sickle cell disease diagnosis using resnet and Random Forest classifier. In 2024 13th International Conference on System Modeling & Advancement in Research Trends (SMART), Moradabad, India, pp. 606-609. https://doi.org/10.1109/SMART63812.2024.10882544
[19] Mohamad, A.S., Nordin, M.N., Senu, A.C. (2023). Convolutional neural network modeling for classification of human red blood cells in sickle cell disease diagnosis. In 2023 International Conference on Engineering Technology and Technopreneurship (ICE2T), Kuala Lumpur, Malaysia, pp. 241-246. https://doi.org/10.1109/ICE2T58637.2023.10540528
[20] Das, P.K., Dash, A., Meher, S. (2024). ACDSSNet: Atrous convolution-based deep semantic segmentation network for efficient detection of sickle cell anemia. IEEE Journal of Biomedical and Health Informatics, 28(10): 5676-5684. https://doi.org/10.1109/JBHI.2024.3362843
[21] Jennifer, S.S., Shamim, M.H., Reza, A.W., Siddique, N. (2023). Sickle cell disease classification using deep learning. Heliyon, 9(11). https://doi.org/10.1016/j.heliyon.2023.e22203
[22] Petrović, N., Moyà-Alcover, G., Jaume-i-Capó, A., Rubio, J.M.B. (2025). Enhancing generalization in Sickle Cell Disease diagnosis through ensemble methods and feature importance analysis. Engineering Applications of Artificial Intelligence, 142: 109875. https://doi.org/10.1016/j.engappai.2024.109875
[23] Darrin, M., Samudre, A., Sahun, M., Atwell, S., et al. (2023). Classification of red cell dynamics with convolutional and recurrent neural networks: A sickle cell disease case study. Scientific Reports, 13(1): 745. https://doi.org/10.1038/s41598-023-27718-w
[24] Alzubaidi, L., Fadhel, M.A., Al-Shamma, O., Zhang, J., Duan, Y. (2020). Deep learning models for classification of red blood cells in microscopy images to aid in sickle cell anemia diagnosis. Electronics, 9(3): 427. https://doi.org/10.3390/electronics9030427
[25] Simon, K., Vicent, M., Addah, K., Bamutura, D., Atwiine, B., Nanjebe, D., Mukama, A.O. (2023). Comparison of deep learning techniques in detection of sickle cell disease. Artificial Intelligence and Applications, 1(4): 228-235. https://doi.org/10.47852/bonviewaia3202853
[26] Ayoade, O.B., Oladele, T.O., Imoize, A.L., Adeloye, J.A., Awotunde, J.B., Olorunyomi, S.O. (2023). An ensemble models for the prediction of sickle cell disease from erythrocytes smears. EAI Endorsed Transactions on Pervasive Health and Technology, 9. https://doi.org/10.4108/eetpht.9.3913
[27] Amer, M.A., Ibrahim, D. (2023). Sickle cell anaemia detection using deep learning. International Journal of Artificial Intelligence and Emerging Technology, 6(1): 15-26. https://doi.org/10.21608/ijaiet.2024.240910.1002
[28] Kumar, I., Rawat, J. (2024). Segmentation and classification of white blood SMEAR images using modified CNN architecture. Discover Applied Sciences, 6(11): 587. https://doi.org/10.1007/s42452-024-06139-y
[29] Carrasco, L., Ramos, L., Barreira, N., Hervella, A.S., Raffa, L.H. (2025). Deep learning-based models for sickle cell anemia characterization in retinal fundus images. In 2025 IEEE 38th International Symposium on Computer-Based Medical Systems (CBMS), Madrid, Spain, pp. 807-812. https://doi.org/10.1109/cbms65348.2025.00165
[30] Goswami, N.G., Sampathila, N., Bairy, G.M., Goswami, A., Brp Siddarama, D.D., Belurkar, S. (2024). Explainable artificial intelligence and deep learning methods for the detection of sickle cell by capturing the digital images of blood smears. Information, 15(7): 403. https://doi.org/10.3390/info15070403
[31] Manescu, P., Christopher, B., Claveau, R., Elmi, M., et al. (2020). Digitized thin blood films for sickle cell disease detection. University College London. https://doi.org/10.5522/04/12407567.v1