Anfal A. Fadhil*![]() | Asmaa Hadi Albayati
| Asmaa Hadi Albayati![]()
© 2025 The authors. This article is published by IIETA and is licensed under the CC BY 4.0 license (http://creativecommons.org/licenses/by/4.0/).
OPEN ACCESS
Computer applications and educational technology can increase the influence of the educational process these days. As a result, there is a growing body of research that is interested in educational computer applications and technology. The manual correction of students' UML diagrams is a major problem because it takes a lot of time and effort from the teacher. As a result, there arose an urgent need to create an automatic tool that will make it simpler for educators to grade whatever number of students' UML diagrams by identifying discrepancies and student faults. This paper proposes a tool for automatically evaluating students' work when they model a Unify muddling language for a UML activity diagram. This tool reads and examines the student's activity diagram in XMI format and compares it with the teacher's activity diagram. The methodology adopted by the proposed tool is the degree of similarity of two activity diagrams that contain properties and flow information. To compute the similarity of the properties between two activity diagrams, the Jaccard index, WordNet, and WuPalmer have been applied to measure the lexical information semantically. And to evaluate similarity, the control information has been applied to a special equation. This tool has been evaluated by experts in the field and recommended as a useful tool based on measures of precision that equal 0.73, a recall that equals one, and an F-score that equals 0.844.
automated grading, unified modeling language, activity diagram, similarity, Jaccard index, evaluation
In software engineering, Unified Modeling Language (UML) is a versatile modeling language that was developed to provide a uniform way to visualize a software system's design. Since its publication by the Object Management Group (OMG), UML has emerged as the industry standard for modeling the design of object-oriented systems [1]. Numerous tools that support UML offer strong functionality for building, modifying, and evaluating UML models. The majority of object-oriented software engineering courses usually use it. In addition to the fact that it can be quite difficult for teachers to evaluate student-developed UML models in universities because they can be more abstract and complex, requiring a lot of time and resources due to the enormous student body [2].
The Unified Modeling Language (UML) is a set of notations that can be used to describe the behavior and structure of object-oriented systems. UML provides a range of graphical diagrams for object-oriented system specification, visualization, and documentation. They can be divided into two categories: those that focus on dynamic behavior and those that deal with the static structure of systems [3].
The capacity of activity diagrams to depict the flows of activities in a desired system makes them one of the tools for characterizing system behavior in the UML language. In general, states in an activity diagram show how sequential and concurrent actions in a workflow or computing process are carried out [4]. The activity diagram is one of the UML diagrams that is instructed in universities.
In software engineering classes nowadays, automatic evaluation of student work has gained popularity and received a lot of attention lately, especially with the incorporation of online learning environments [5].
Significant advantages of automated evaluation include its speed, adaptability, precision, and objectivity. This would need the analysis, evaluation, and grading of students' assignments using automated tools and algorithms [6].
The aim of this research is to create an efficient method for automatically evaluating students' activity diagrams. There are numerous options for evaluating activity diagrams, but they usually call for teachers to evaluate them manually or employ a small number of automated tools with predetermined standards. By using a method that centers on identifying parallels and discrepancies between the teacher's diagram as a reference and the student's activity diagram, the suggested tool seeks to get beyond these restrictions. The two activity diagrams' semantic and structural similarity is measured in this paper. The measurement makes use of the flow and property data found in the activity diagram. The property information includes the node type as well as the value. The target node, the flow's name, and the source node are all included in the flow information. It has aggregated all of the information from the activity diagram in UML into a single similarity measurement unit in order to quantify the flow information. [7]. the contribution of the paper:
1- In this work is to create a simple and effective tool for evaluating students' activity diagrams, maximize corrective time, and make jobs for teachers easier based on the similarity between properties and the flow information between two activity diagrams.
2- Use the Jaccard index, WordNet, and WuPalmer to measure the lexical information semantically. Since the combination of these methods has not been used in any research to compute similarity between activity diagrams.
There are six sections to the paper. Following this introduction, the second section provides related work, the third section explains automatic evaluation in education, the fourth section outlines the methodology employed in this work, the fifth section displays a case study, the sixth section displays the evaluation method, and the final section provides a summary of the study's findings.
Much research was previously presented by scholars in the field of automated evaluation of UML diagrams.
The work concentrated on an algorithm that was created using the semantic features of the elements of the “UML class diagram” [8]. The method involves similarity the elements of two diagrams according to their semantic significance; this step necessitates human assistance. After that, a distance between each pair is computed; to record the difference as results, it is appended to the distinction vector and its expected length.
In order to make matching two or more sequence diagrams more relevant, the writers used dynamic programming in conjunction with the edit distance to determine how similar the sequence diagrams were [9].
The authors suggested an automated technique that applies structural, syntactic, and semantic similarity to graded class diagrams using metamodels [10]. The Levenshtein distance is applied to determine syntactic correspondence, the WordNet database is used to calculate semantic matching, and the property similarity is covered by structural matching. The outcome demonstrates a 14% disparity between the teacher's grade and the 20 pupils that the technology had the ability to automatically grade.
The authors described a machine learning-based research methodology for automatically rating and scoring students' UML class diagrams [11]. The methodology involves training multiple classification and regression models based on two experiments that use information from bachelor's degree projects to create a prediction model. Their investigation yielded a 69% accuracy rate.
The authors introduced a tool, a Java-based program that uses a straightforward and efficient method to automatically analyze and grade solution diagrams submitted by students and tutors [1]. The tool's result is the student diagram's score in relation to the lecturer's ultimate resolution. The findings are sent in two feedback files: one for the students to obtain in order to identify the areas that were improper, and another with the students' grades for the teachers.
By analyzing these creations and researching. The authors proposed a semi-automated and summative assessment approach for student-made class diagrams that aims to reduce the amount of evaluation labour for teachers while offering an instructive answer on the learning process [12]. This method included the transformation, similarity measurement, matching, and contrasting of several UML diagrams.
The authors propose a method for automatically evaluating and assigning grades to students' UML diagrams [6]. It receives the solution diagrams from the student and the tutor as input, displays the student's results, and points out any discrepancies or mistakes. The tutor's and student's elements diagrams are compared, and the disparities between the two lists are then produced as part of the matching process.
The authors applied deep learning techniques to calculate structural similarity and applied Term Frequency-Inverse Document Frequency (TF-IDF) to calculate semantic similarity of use case diagrams and evaluated their method with other methodologies [13]. The results demonstrated the power of deep learning to calculate similarity.
The process of gathering, compiling, and presenting data regarding what and how students are learning is known as assessment in education. During the teaching-learning process, assessment employs a variety of strategies. It is particularly helpful when assessing open-ended questions since it enables teachers to gain a deeper understanding of how well students are assimilating the material. For example, when interviewed by a teacher, students who perform well on closed-answer tests sometimes report making similar conceptual mistakes [14].
In recent years, there has been a significant growth in the use of computer technologies for evaluation. Using computer tools for assessment aims to accomplish and combine the benefits of a system that has the following features: first, it will lessen the workload of professors by automating a portion of the student evaluation task; second, it will give students comprehensive information about their learning period more effectively than traditional evaluation; and third, it will incorporate the assessment culture into the students' everyday work in an online learning environment [15].
Thousands of educational resources (questions, problems) are frequently found in learning environments. Quantifying these elements' pairwise similarity is a helpful data mining contribution [16-18].
There are numerous uses for these similarity metrics. They are especially helpful for content management and for determining when to divide knowledge components. Algorithms that direct the presentation of the content can also utilize similarity measures; for example, we might not want to ask students two questions that are extremely similar right after one another. It is also possible to leverage item similarities for student modeling [19].
This work proposes a tool that assesses students' activity diagrams, measures their progress, and assesses if they meet the designated learning objectives.
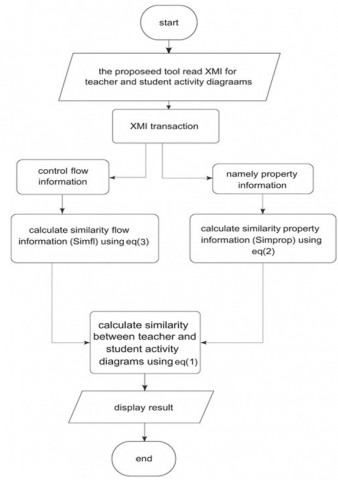
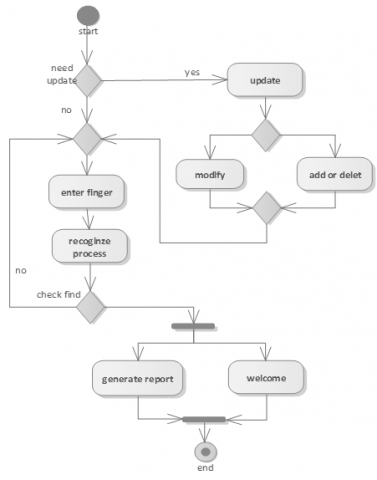
In this paper is to automatically evaluate and assign grades to the student's activity diagram, depending on the similarity between the student’s activity diagrams and a teacher’s activity diagrams. In addition, explain it in these subsections. Figure 1 illustrates the flowchart for the suggested tool to evaluate the activity diagram.
Figure 1. The flow chart for suggest tool to evaluate activity diagram for students
4.1 Create activity diagram and XMI
Activity diagrams are used to illustrate the use case diagram's diagrammatic flow of events and to model business processes. One of the primary UML modeling techniques, it depicts the way a system behaves dynamically, including control flow and object flow from one operation to another. It is used to represent concurrent and parallel flows in a real system and to show the situation of describing complex use cases [20].
Using Enterprise Architect 16, students were to draw a UML activity diagram based on textual descriptions. Prior to this, the teacher's activity diagram was worked on. Then these diagrams are converted into an XMI file (“Extensible Markup Language”), a collection of guidelines for encoding texts characterised by this text-based markup language in a manner that is both "machine-readable" and "human-readable".
The web development age makes extensive use of XML. It allows developers to define their own data types with a sense of flexibility. Faster element-by-element comparison and aggregation are made possible by the tree structure of XML documents [21, 22].
4.2 Measure similarity
Semantic similarity is derived using computation of the similarity between the two actions in the activity diagram. Actions from the activity diagram are mostly sentence fragments made up of many words. are typically sentence fragments made up of multiple words. Therefore, semantic similarities necessitate a distinct computation flow. tokenization will be used to break down the entered name of action by word, and Stanford NLP will be used to tag each word with a Part of Speech (POS) [23]. Next, it has eliminated stop words. Next, lemmatisation has been used to return all words to their original form. Lastly, it has used the Jaccard similarity coefficient to compare these findings to other schematic labels [24] to determine semantic significance.
The similarity between two words is calculated in Jaccard similarity. Depending on the categories of recognised words using POS labeling, it has been compared to the terms [25].
The UML activity diagram is made of action, object (the object was neglected due to less use), and control, which are the types of metadata. Lexical data makes up the action and object nodes. Furthermore, a node that is related to another node is called a control node. There are two pieces of information in the metadata to compute similarity: similarity property ($simprop$) and similarity control flow ($simfl$). Eq. (1) demonstrates how to calculate the degree of similarity between diagram 1 of the teacher ($d_t$) and diagram 2 of the student ($d_s$) [7].
$\operatorname{sim}\left(d_t, d_s\right)=wprop \times simprop\left(d_t, d_s\right)+w f l \times simfl\left(d_t, d_s\right)$ (1)
where, wprop is the weight value is associated with an action and object (element in the activity diagram) with another activity diagram. After applying several weights to the proposed tool, the ideal weight was determined $wprop=1$ and $simprop\left(d_t, d_s\right)$ is represent $simprop\left(a c_t, a c_s\right)$ by the action of the teacher's diagram $\left(\mathrm{ac}_{\mathrm{t}}\right)$ and the action of the student's diagram $\left(\mathrm{ac}_{\mathrm{s}}\right)$. The $w f l$ is the weight of the control flow that connects diagram1 $\left(d_t\right)$ and diagram2 $\left(d_s\right)$ The purpose is to calculate the similarity between them.
And after applying several weights to the proposed tool, the ideal weight was determined $w f l=0.5$.
The next step is to gauge how similari the properties ($simprop$) from $d_t$ and $d_s$ using jaccard similarity coefficient is described in Eq. (2) [26, 27].
$simprop\left(a c_t, a c_s\right)=\frac{\left|a c_t \cap a c_s\right|}{\left|a c_t \cup a c_s\right|}$ (2)
where, $a c_t$ represent the vector of action teacher’s diagram, $a c_s$ represent vector of action student’s diagram, this study employed Wordnet and the Wu Palmer approach to determine the semantic similarity between lexical data [28-30].
Then, compute similarity flow information ($simfl$) between two activity diagrams in UML Eq. (3) provides a description of this measurement.
$simfl\left(d_t, d_s\right)=\sum_{k=1}^n w c f_k \times\left(\frac{{Max}\left(\sum_{i, j=1}^{\mathrm{n}} \text { jaccard index }\left(c f_{i,} f c_j\right)\right)}{\left(\left|C F_i\right|,\left|C F_j\right|\right)}\right)$ (3)
where, CF is the Control Flow between two nodes in activity diagram. And each CF can take the form: (source type: source name, name of flow: -, target type: target name), and type can take one the form “initial node, final node, decision node, merge node, fork node, and join node”.
n: max number of CF ( dt, ds )
wcfk: weight of control flow can be computed by:
1. Locate the similarity flow part that is present in both diagrams.
2. Determine how many times each node appears in the flow based on its weight (number 1 shows flow similarity).
3. By dividing the outcome two and overall result in number 2, each weight may be normalized.
CFi,CFj: the sets of type control flow and value of the flow's “target node” and “source node”.
The result of similarity metrics ranged between [0,1] and the closer the result is to 1, the more similarity; the value is 1 for full similarity. Conversely, the closer the result is to zero, the less similarity; it is completely not similar at the value of zero.
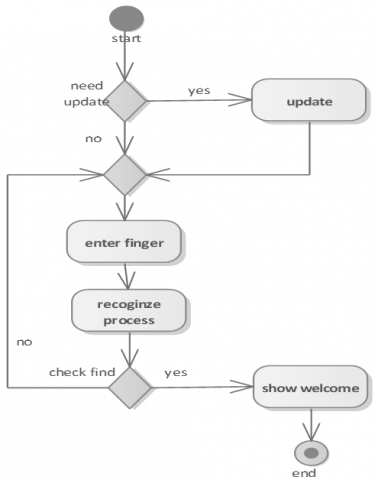
A tool was created in the Visual Studio C++ language that selects the teacher’s XMI, which will be a reference and essential for evaluation, and then selects the XMI of the student who wants to be evaluated, where an XMI file should be created for each student's activity diagram that is submitted for evaluation. In this paper, that fingerprint system was adopted as a case study. Figure 2 refers to the teacher’s activity diagram for the fingerprint system, and Figure 3 refers to student 1’s activity diagram for the fingerprint system.
Figure 2. Teacher’s activity diagram for fingerprint system
The proposed tool reads the XMI file for the teacher and the student and extracts the properties information and flow information from each file.
Based on Figure 2, the information obtained as a result of retrieving metadata from teacher’s XMI file is as follows:
1- Property information contains a set of actions taken on the forms (action no.: name of action) :( action1: update, action2: enter finger, action3: recognize process, action4: show welcome.
2- Flow information contains set of flow taken the forms (source type: source name, name of flow: -, target type: target name) and represent as teacher’s diagram (td):
1- initial: start, name: -, decision: need update(td1)
2- decision: need update, name: yes, action: update(td2)
3- decision: need update, name: no, merge: -(td3)
4- action: update, name: -, merge: -(td4)
5- merge: -, name: -, action: enter finger (td5)
6- action: enter finger, name: -, action: recognize process(td6)
7- action: recognize process, name: -, decision: check find(td7)
8- decision: check find, name: no, merge: -(td8)
9- decision: check find, name: yes, action: show welcome(td9)
10- action: show welcome, name: -, final: end(td10)
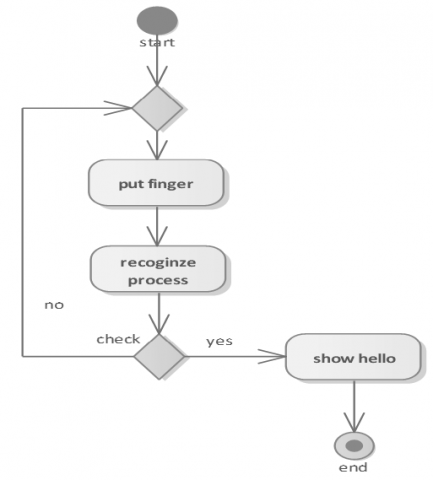
And based on Figure 3, the information obtained as a result of retrieving metadata from the student’s XMI file is as follows:
1-property information: (action1: put finger, action2: recognize process, action3: show hello)
2- Flow information and represent as student’s diagram (sd):
1- initial: start, name: -, merge: -(sd1)
2- merge: -, name: -, action: put finger (sd2)
3- action: put finger, name: -, action: recognize process(sd3)
4- action: recognize process, name: -, decision: check (sd4)
5- decision: check, name: no, merge: -(sd5)
6- decision: check, name: yes, action: show hello(sd6)
7- action: show hello, name: -, final: end (sd7)
Figure 3. Student1’s activity diagram for fingerprint system
To calculate the propriety similarity between the teacher's diagram and the student’s diagram, Table 1 was used to present the vector construction with propriety present or missing along with the propriety and vector similarity value in each diagram, and the Jaccard Similarity coefficient in Eq. (2) was used, and using WordNet and WuPalmer the prosperity similarity equalled 0.4444.
Table 1. The vector with propriety present or missing along with the propriety and vector similarity value for teacher’s diagram and student1’s diagram
|
Vector |
Update |
Enter |
Finger |
Recognize |
Process |
Show |
Welcome |
Put |
Hello |
|
teacher's diagram |
1 |
1 |
1 |
1 |
1 |
1 |
1 |
0 |
0 |
|
Student1’s diagram |
0 |
0 |
1 |
1 |
1 |
1 |
0 |
1 |
1 |
And created Table 2 that displays the flow information similarity. The first column insideleft is the flow information of the teacher's diagram. The top row is the low information of the student's diagram by applying Eq. (3). The similarity of flow information between the teacher's diagram and the student's diagram equals 0.5294.
Table 2. The flow information similarity for teacher’s diagram and student1’s diagram
|
|
sd1 |
sd2 |
sd3 |
sd4 |
sd5 |
sd6 |
sd7 |
|
td1 |
1 |
0.63 |
0.63 |
0.45 |
0.26 |
0.63 |
0.61 |
|
td2 |
0.45 |
0.61 |
0.62 |
1 |
0.8 |
0.68 |
0.82 |
|
td3 |
0.51 |
0.59 |
0.56 |
0.88 |
1 |
0.61 |
0.71 |
|
td4 |
0.23 |
0.84 |
0.88 |
0.91 |
0.33 |
0.82 |
0.81 |
|
td5 |
0.81 |
1 |
0.84 |
0.61 |
0.53 |
0.84 |
0.89 |
|
td6 |
0.82 |
0.89 |
1 |
0.62 |
0.42 |
0.73 |
0.81 |
|
td7 |
0.3 |
0.63 |
0.65 |
1 |
0.85 |
0.69 |
0.65 |
|
td8 |
0.43 |
0.62 |
0.63 |
0.11 |
1 |
0.62 |
0.63 |
|
td9 |
0.81 |
0.89 |
0.81 |
0.68 |
0.61 |
1 |
0.89 |
|
td10 |
0.91 |
0.89 |
0.81 |
0.65 |
0.71 |
0.88 |
1 |
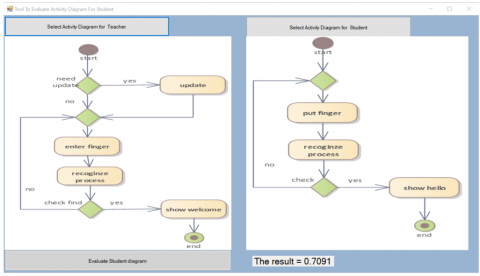
And after applying Eq. (1) to compute the similarity between the teacher’s diagram and student 1's diagram, it equals 0.7091, and the interface for the proposed tool is shown in Figure 4.
Figure 4. The interface for proposed tool
The proposed tool was applied to a more complex student2's activity diagram (containing many details) for the fingerprint system, as shown in Figure 5. To calculate the propriety similarity between the teacher's diagram and student 2’s diagram, Table 3 was used to present the vector construction with propriety present or missing along with the propriety and vector similarity value in each diagram, and the Jaccard Similarity coefficient in Eq. (2) was used, and using WordNet and WuPalmer the prosperity similarity equalled 0.5.
Figure 5. Student2’s activity diagram for fingerprint system
Table 3. The vector with propriety present or missing along with the propriety and vector similarity value for teacher’s diagram and student2’s diagram
|
Vector |
Update |
Enter |
Finger |
Recognize |
Process |
Show |
Welcome |
Modify |
Delete |
Add |
Generate |
Report |
|
Teacher's diagram |
1 |
1 |
1 |
1 |
1 |
1 |
1 |
0 |
0 |
0 |
0 |
0 |
|
Student2’s diagram |
1 |
1 |
1 |
1 |
1 |
0 |
1 |
1 |
1 |
1 |
1 |
1 |
And created Table 4 that displays the flow information similarity. By applying Eq. (3), the similarity of flow information between the teacher's diagram and student 2's diagram equals 0.5832. And after applying Eq. (1) to compute the similarity between the teacher’s diagram and student 2's diagram, it equals 0.7916.
Table 4. The flow information similarity value for teacher’s diagram and student2’s diagram
|
|
sd1 |
sd2 |
sd3 |
sd4 |
sd5 |
sd6 |
sd7 |
sd8 |
sd9 |
sd10 |
sd11 |
sd12 |
sd13 |
sd14 |
sd15 |
sd16 |
sd17 |
sd18 |
|
td1 |
1 |
0.21 |
0.45 |
0.63 |
0.26 |
0.82 |
0.34 |
0.71 |
0.82 |
0.99 |
0.62 |
0.44 |
0.89 |
0.63 |
0.71 |
0.63 |
0.44 |
0.21 |
|
td2 |
0.32 |
1 |
0.59 |
0.33 |
1 |
0.63 |
0.82 |
0.67 |
0.21 |
0.32 |
0.99 |
0.21 |
0.26 |
0.77 |
0.21 |
0.21 |
0.55 |
0.32 |
|
td3 |
0.53 |
0.62 |
0.42 |
0.82 |
0.44 |
0.62 |
0.67 |
1 |
0.44 |
0.53 |
0.85 |
0.34 |
0.82 |
0.53 |
0.34 |
0.82 |
0.34 |
0.53 |
|
td4 |
0.6 |
0.72 |
0.91 |
0.65 |
0.81 |
0.91 |
0.26 |
0.41 |
1 |
0.42 |
0.61 |
0.88 |
0.63 |
0.44 |
0.61 |
0.67 |
0.89 |
0.6 |
|
td5 |
0.51 |
0.41 |
0.61 |
0.71 |
0.41 |
0.44 |
0.71 |
0.53 |
0.81 |
1 |
0.72 |
0.62 |
0.88 |
0.21 |
0.67 |
0.82 |
0.77 |
0.71 |
|
td6 |
0.51 |
0.62 |
0.81 |
0.56 |
0.71 |
0.53 |
0.65 |
0.81 |
0.71 |
0.62 |
1 |
0.41 |
0.91 |
0.82 |
0.81 |
0.44 |
0.89 |
0.32 |
|
td7 |
0.53 |
0.42 |
1 |
0.21 |
0.65 |
0.71 |
0.21 |
0.61 |
0.85 |
0.99 |
0.56 |
1 |
0.26 |
0.65 |
0.99 |
0.21 |
0.71 |
0.44 |
|
td8 |
0.42 |
0.44 |
0.85 |
1 |
0.98 |
0.62 |
0.63 |
0.44 |
0.62 |
0.82 |
0.42 |
0.91 |
0.44 |
0.62 |
0.62 |
0.63 |
0.38 |
0.53 |
|
td9 |
0.53 |
0.62 |
0.89 |
0.44 |
0.62 |
0.82 |
0.99 |
0.74 |
0.26 |
0.53 |
0.53 |
0.62 |
1 |
0.53 |
0.72 |
0.54 |
0.75 |
0.82 |
|
td10 |
0.82 |
0.99 |
0.61 |
0.26 |
0.42 |
0.21 |
0.44 |
0.61 |
0.54 |
0.42 |
0.32 |
0.21 |
0.71 |
0.42 |
0.44 |
0.78 |
0.61 |
0.94 |
In this research, a database was created consisting of the answers of eight students in the second stage of the preliminary studies of the Software Department in the College of Computer Science and Mathematics at the University of Mosul, where they were tested by forming an activity diagram for the fingerprint system. The proposed automated evaluation of learners' diagrams has been applied, and the results are shown in Table 5.
Table 5. Similarity based ON PROPOSED method for 8 student
|
No. Student |
Simprop |
simfl |
Similarty Scor |
|
1 |
0.421 |
0.483 |
0.662 |
|
2 |
0.450 |
0.543 |
0.721 |
|
3 |
0.438 |
0.497 |
0.6872 |
|
4 |
0.459 |
0.925 |
0.921 |
|
5 |
0.211 |
0.262 |
0.342 |
|
6 |
0.473 |
0.696 |
0.821 |
|
7 |
0.312 |
0.418 |
0.521 |
|
8 |
0.451 |
0.528 |
0.715 |
|
9 |
0.332 |
0.521 |
0.593 |
|
10 |
0.521 |
0.627 |
0.835 |
|
11 |
0.437 |
0.619 |
0.747 |
|
12 |
0.51 |
0.825 |
0.923 |
|
13 |
0.291 |
0.762 |
0.672 |
|
14 |
0.534 |
0.803 |
0.936 |
|
15 |
0.459 |
0.226 |
0.572 |
To assess the proposed tool, we sent the proposed tool to the experts based on the teacher diagram (essential) and the student’s answers (eight answers). The number of experts was ten. The experts are lecturers in different universities. They have educational backgrounds in software engineering and have instructed and evaluated activity diagrams during their lectures. They hold a master’s or doctorate degree in software engineering. Eight of the experts recommended that the proposed tool is good and useful for faculty, and two recommended that it is not good. The experts recommended that the value of the threshold be equal to 0.69. Table 6 shows the similarity score that was calculated by the proposed method based on the value of the threshold and opinion of experts.
Table 6. Similarity score that calculated by proposed method based on the value of threshold and opinion experts
|
No. Student |
Similarity Score (threshold≥0.65) |
Opinion Experts |
|
1 |
Yes |
Yes |
|
2 |
Yes |
Yes |
|
3 |
Yes |
No |
|
4 |
Yes |
No |
|
5 |
No |
No |
|
6 |
Yes |
No |
|
7 |
No |
No |
|
8 |
Yes |
Yes |
|
9 |
No |
No |
|
10 |
Yes |
Yes |
|
11 |
Yes |
Yes |
|
12 |
Yes |
No |
|
13 |
Yes |
Yes |
|
14 |
Yes |
Yes |
|
15 |
No |
No |
The precision and recall measures [31] shown in Eqs. (4) and (5) were used to measure the accuracy of the proposed similarity.
$precision=\frac{t p}{t p+f p}$ (4)
$Recall=\frac{t p}{t p+f n}$ (5)
where: tp = true positive=11, fp =false positive=4 and fn=false negative=0.
The F- score, which is based on the precision and recall mesures, can be applied using Eq. (6).
$F_{ {score }}=2.\frac{{precision} * {Recall}}{{precision}+{Recall}}$ (6)
The above metrics show that the proposed method for calculating similarity of activity diagrams has a good index with a precision equal to 0.73, a recall equal to one and F core equal to 0.844. This shows that the proposed method works well.
For a variety of programming environments and development processes, UML diagrams are typically widely and frequently utilized in academic settings. Teachers and tutors find it quite difficult to deal with the manual examination of these diagrams. Automating assessment procedures appears to be a useful strategy for improving the educational process in this work. A tool is proposed to automatically evaluate and grade students' activity diagrams.
The suggested tool creates the student's grades after receiving the teacher's and student's answer diagrams. It has been evaluated and tested using a tool based on actual case scenarios, such as student and teacher diagrams contrasted using the similarity between properties and the flow information. Also consulted ten experts studying software engineering at various universities, and most of them recommended that it is a useful tool by applying the precision and recall scale. As a result, the tool met its goals and proved that it could offer reliable and consistent evaluations for the automated assessment of students' activity diagrams.
In future work, feedback could be provided to students to point out areas of deficiencies in activity diagrams. Additionally, an implementation could be extended to include additional types of diagrams.
The University of Mosul/College of Computer Sciences and Mathematics is acknowledged by the authors for providing facilities that enhanced the caliber of this piece of work.
[1] Modi, S., Taher, H.A., Mahmud, H. (2021). A tool to automate student UML diagram evaluation. Academic Journal of Nawroz University (AJNU), 10(2): 189-198. https://doi.org/10.25007/ajnu.v10n2a1
[2] Razoqi, S.A. (2021). Data modeling and design implementation for CouchDB database. AL-Rafidain Journal of Computer Sciences and Mathematics, 15(1): 39-53. https://doi.org/10.33899/csmj.2021.168252
[3] Dabdawb, M.M.A. (2024). Unified modeling language quantitative measures based on a behavioural model. Journal of Education & Science, 33(1): 90-98. https://doi.org/10.33899/edusj.2024.145662.1416
[4] Abdullatif, N., Kassem, S. (2020). Modelling of agent-based vehicle routing problem using unified modelling language. Journal Européen des Systèmes Automatisés, 53(5): 781-789. https://doi.org/10.18280/jesa.530604
[5] Simanjuntak, H. (2015). Proposed framework for automatic grading system of ER diagram. In 2015 7th International Conference on Information Technology and Electrical Engineering (ICITEE), Chiang Mai, Thailand, pp. 141-146. https://doi.org/10.1109/ICITEED.2015.7408930
[6] Jebli, R., El Bouhdidi, J., Chkouri, M.Y. (2024). A proposed algorithm for assessing and grading automatically student UML diagrams. International Journal of Modern Education and Computer Science, 16(1): 37-46. https://doi.org/10.5815/ijmecs.2024.01.04
[7] Fauzan, R., Siahaan, D., Rochimah, S., Triandini, E. (2018). Activity diagram similarity measurement: A different approach. In International Seminar on Research of Information Technology and Intelligent Systems (ISRITI), Yogyakarta, Indonesia, pp. 601-605. https://doi.org/10.1109/ISRITI.2018.8864284
[8] Nikiforova, O., Gusarovs, K., Kozacenko, L., Ahilcenoka, D., Ungurs, D. (2015). An approach to compare UML class diagrams based on semantical features of their elements. In ICSEA 2015: The Tenth International Conference on Software Engineering Advances, Barcelona, Spain, pp. 147-152. https://doi.org/10.13140/RG.2.1.3104.4889
[9] Adamu, A., Zainon, W.M.N.W. (2017). Similarity assessment of UML sequence diagrams using dynamic programming. In Lecture Notes in Computer Science, vol 10645. Springer, Cham. https://doi.org/10.1007/978-3-319-70010-6_25
[10] Bian, W., Alam, O., Kienzle, J. (2019). Automated grading of class diagrams. In ACM/IEEE 22nd International Conference on Model Driven Engineering Languages and Systems Companion (MODELS-C), Munich, Germany, Munich, Germany, pp. 700-709. https://doi.org/10.1109/MODELS-C.2019.00106
[11] Stikkolorum, D.R., van der Putten, P., Sperandio, C., Chaudron, M. (2019). Towards automated grading of UML class diagrams with machine learning. BNAIC/BENELEARN, 2491.
[12] Anas, O., Mariam, T., Abdelouahid, L. (2021). New method for summative evaluation of UML class diagrams based on graph similarities. International Journal of Electrical and Computer Engineering (IJECE), 11(2): 1578-1590. http://doi.org/10.11591/ijece.v11i2.pp1578-1590
[13] Song, S.H., Wang, Y., Wang, X., Lin, C., Hu, K. (2024). A deep learning-based approach to similarity calculation for UML use case models. Expert Systems with Applications, 251(1): 123927 https://doi.org/10.1016/j.eswa.2024.123927
[14] Cipriano, B.P., Fachada, N., Alves, P. (2022). Drop project: An automatic assessment tool for programming assignments. SoftwareX, 18(3): 1-7. https://doi.org/10.1016/j.softx.2022.101079
[15] Ahmed, D.R., Kamal, M.A., Kamal, R.A. (2022). Design and implement an application to measure the readiness of teachers to adopt E-learning in Mosul schools after pandemic COVID-19. Al-Rafidain Journal of Computer Sciences and Mathematics (RJCM), 16(1): 41-50.
[16] Pelánek, R. (2020). Measuring similarity of educational items: An overview. IEEE Transactions on Learning Technologies, 13(2): 354-366. https://doi.org/10.1109/TLT.2019.2896086
[17] Jebli, R., El Bouhdidi, R.J., Chkouri, M.Y. (2021). A proposed architecture of an intelligent system for assessing the student’s UML class diagram. International Journal of Emerging Technologies in Learning, 16(21): 4-12. https://doi.org/10.3991/ijet.v16i21.25105
[18] Mashau, P., Nyawo, J. (2021). The use of an online learning platform: A step towards e-learning. South African Journal of Higher Education, 35(2): 123-143. https://doi.org/10.20853/35-2-3985
[19] Cechák, J., Pelánek, R. (2021). Experimental evaluation of similarity measures for educational items. In Proceedings of the 14th International Conference on Educational Data Mining.
[20] Al-Jawaherry, M., Abdulmajeed, A.A., Mokdad, T. (2022). Developing a heuristic algorithm to solve uncertainty problem of resource allocation in a software project scheduling. Iraqi Journal of Science, 63(5): 2211-2229. https://doi.org/10.24996/ijs.2022.63.5.34
[21] Alreffaee, T.R., Dabdawb, M.M.A., Taha, D.B. (2021). Measure extendibility/extensibility quality attribute using object oriented design metric. Telecommunication Computing Electronics and Control, 19(5): 1507-1516. https://doi.org/10.12928/telkomnika.v19i5.19278
[22] Tavares, J.F., Costa, Y.M.G., Colanzi, T.E. (2021). Classification of UML diagrams to support software engineering education. In 2021 36th IEEE/ACM International Conference on Automated Software Engineering Workshops (ASEW), Melbourne, Australia, pp. 102-107. https://doi.org/10.1109/ASEW52652.2021.00030
[23] Manning, C.D., Bauer, J., Finkel, J., Bethard, S.J. (2014). The Stanford CoreNLP natural language processing toolkit. In Proceedings of 52nd Annual Meeting of the Association for Computational Linguistics: System Demonstrations, Baltimore, Maryland, pp. 55-60.
[24] Sunilkumar, P., Shaji, A.P. (2019). A survey on semantic similarity. In 2019 International Conference on Advances in Computing, Communication and Control (ICAC3), Mumbai, India, pp. 1-8. https://doi.org/10.1109/ICAC347590.2019.9036843
[25] Fauzan, R., Siahaan, D., Rochimah, S., Triandini, E. (2021). A different approach on automated use case diagram semantic assessment. International Journal of Intelligent Engineering and Systems, 14(1): 496-505. https://doi.org/10.22266/ijies2 021.0228.46
[26] Efendi, R., Samsudin, N.A., Deris, M.M., Ting, Y.G. (2018). Flu diagnosis system using Jaccard index and rough set approaches. Journal of Physics: Conference Series, 1004(1): 012014. https://doi.org/10.1088/1742-6596/1004/1/01201
[27] Bazhenov, A.N., Telnova, A.Y. (2023) Generalization of Jaccard index for interval data analysis. Measurement Techniques, 65: 882-890. https://doi.org/10.1007/s11018-023-02180-2
[28] Jacobs, A.M., Kinder, A. (2018). Features of word similarity. arXiv preprint arXiv:1808.07999. https://doi.org/10.48550/arXiv.1808.07999
[29] Fellah, A., Zahaf, A., ELci, A. (2024). Semantic similarity measure using a combination of word2vec and wordnet models. Indonesian Journal of Electrical Engineering and Informatics, 12(2): 455-464. https://doi.org/10.52549/ijeei.v12i2.5114
[30] Rakshit, R., Chakraborty, C., Chakraborty, U., Sarma, B. (2022). Automatic text summarization using WU-palmer measure and graph based sentence selection. Grenze International Journal of Engineering and Technology, 8(1): 320-325.
[31] Samsuddoha, M., Faisal, R.H. (2018). An approach for measuring similarity of UML class diagrams. Barishal University Journal Part 1, 5(1): 179-193.