Temitope E. Ogunbiyi![]() | Adedayo F. Adedotun*
| Adedayo F. Adedotun*![]() | Stephanie A. Ibidapo
| Stephanie A. Ibidapo![]() | Johnson A. Adeyiga
| Johnson A. Adeyiga![]() | Julius Remi Oluwadare
| Julius Remi Oluwadare![]() | Daniel Awojobi
| Daniel Awojobi![]() | Ugochukwu A. Mbata
| Ugochukwu A. Mbata![]() | Moyosore O. Agbesuyi
| Moyosore O. Agbesuyi![]()
© 2025 The authors. This article is published by IIETA and is licensed under the CC BY 4.0 license (http://creativecommons.org/licenses/by/4.0/).
OPEN ACCESS
The prediction of soil macro-nutrients level is critical for optimizing cash crop production, ensuring both economic viability and sustainable agricultural practices. Researchers have used several machine learning models to predict the nutrients for the good yield of the crops; however, the supply and demand based on nutrients that provide the good yield cannot be met. Based on this shortfall, this study aims to evaluate some machine learning techniques for predicting soil nutrient for cash crop production. The dataset was sourced from “Nigeria Soils Data” on Africa Geoportal and includes soil samples collected from various locations across Nigeria. The data were preprocessed to handle missing values, feature engineering to transform spectral data using Principal Component Analysis (PCA), normalization of data features, and the splitting of the dataset. Each model was trained on the preprocessed data and assessed using Mean Absolute Error (MAE), Mean Squared Error (MSE), Root Mean Squared Error (RMSE), and R² score. The performance evaluation results for MAE, MSE, R², RMSE under Nitrogen are: 0.029078, 0.002053, 0.710939, 0.045315 respectively. The result emphasizes the superior performance of Random Forest (RF) as it outperforms the remaining models within the metrics of MAE, MSE, R², RMSE even after employing approaches to improve individual model performance through bagging methods. These insights can help agricultural stakeholders determine which approaches to employ, leading to enhance crop production and promote more eco-friendly agricultural methods.
macro-nutrients, supervised learning, sustainable farming, bagging method, random forest, support vector machine, linear regression, hybrid model
Cash crops are plants grown primarily for sale and profit rather than personal use or sustenance. They significantly impact economies in developing countries and can enhance farmers’ livelihoods. Maize (corn) is indeed a significant cash crop in many parts of the world. It is grown not only for local consumption but also for its economic value in both domestic and international markets. According to the study [1], the adoption of environmentally-friendly maize production practices in Nigeria led to a 25% reduction in pesticide use and lower farmer exposure. Meanwhile, it has been estimated by the study [2] that increasing maize yields through improved varieties could generate an additional $200 million in annual economic benefits for Nigeria.
The productivity of cash crops like maize heavily depends on the nutrient level of the soil in which they are cultivated. Soil nutrients are crucial for plant life sustainability. The two main categories they fall into are micronutrients and macronutrients. Plants need significant quantities of macronutrients, to name a few, calcium (Ca), nitrogen (N), magnesium (Mg), potassium (K), sulfur (S), and phosphorus (P) [3]. These elements are vital for various physiological functions in plants, including growth, photosynthesis, and reproduction, which directly influence crop yield and quality. In addition, they need trace amounts of micronutrients like boron (B), manganese (Mn), iron (Fe), zinc (Zn), chlorine (Cl), molybdenum (Mo), and copper (Cu) [4]. Agricultural soil requires adequate proportions of necessary nutrients, such as potassium (K), phosphorus (P), and nitrogen (N), so as to support healthy plant growth and development [5]. Conventional soil nutrient analysis techniques are time-consuming and often not economical for large-scale applications. With the development of machine learning (ML) and advanced data analytics technologies, there is a promising opportunity to revolutionize how soil nutrient analysis is conducted. Supervised machine learning offers the ability to predict soil nutrient levels accurately and efficiently by learning from historical data, thus enabling better decision making for fertilizer application and soil management practices [6].
The decline of organic matter as well as macro-nutrients in the soil caused by continuous cropping is a major factor contributing to low maize yields, as it eventually results in a fall in sustainable soil productivity [7]. The widespread application of chemical fertilizers significantly boosted crop productivity [8]. However, this practice has become problematic as excessive use has negatively impacted both crop yield and soil fertility [9]. The mismatch between fertilizer recommendations and actual soil requirements has led to the overuse of these chemical products. However, the challenge lies in accurately predicting soil nutrient levels using more accessible data, which can significantly impact decision-making processes in agriculture.
Regardless of the critical role of soil macro-nutrients in cash crop production, there remains a gap in adopting modern, efficient, and scalable methods for soil macro-nutrient prediction. The traditional laboratory-based analysis methods are not feasible for real-time and large-scale applications, leading to suboptimal fertilizer usage and, consequently, affecting crop yield and environmental health. In addition, there aren't many thorough studies that evaluate the results of different supervised machine learning techniques from this scenario. Therefore, there is a need to evaluate the various models that help in predicting such nutrients. The motivation behind this research is in twofold. First, increasing agricultural output is vital in order to fulfill the world's rising food needs. Improving the accuracy of soil nutrient predictions can result in improved yields for crops and more eco-friendly agricultural methods. Secondly, the advancement in machine learning and data analytics presents an untapped potential to transform traditional agricultural practices into more efficient, technology-driven operations. Leveraging these technologies to predict soil nutrient levels and could significantly reduce costs, save time, and promote environmental sustainability by optimizing fertilizer use. The objectives of this study are: to implement several machine learning models for the prediction of soil nutrients level, to evaluate the different Machine Learning Techniques for their effectiveness, and to provide recommendation based on the evaluated Machine Learning for the best Model in predicting soil nutrients for Cash Crops (Maize) production.
Recent studies have explored various supervised learning models for predicting soil nutrient levels. Odebiri et al. [10] carried out an in-depth examination to investigate the ability of Neural Networks (NN) and Deep Learning (DL) methods in forecasting Soil Organic Carbon (SOC) levels based on indirectly gathered data. Shahare and Gautam [11] reviewed several machine learning methods to understand different aspects of soil characteristics.
Kumar et al. [12] investigated how machine learning methods could predict soil properties. They found that stochastic gradient boosting performed best in predicting Phosphorous levels compared to other methods like multiple linear regression and Random Forest. Additionally, Support Vector Regression showed exceptional accuracy specifically in predicting the phosphorous content of soil.
The main purpose of the study [13] was to discuss the application of artificial intelligence in analyzing soil nutrient data, highlighting challenges such as regional differences in soil qualities, data processing efficiency, high-dimensional hyperspectral data complexity, and natural light interference in soil pH prediction using smartphone cameras. It emphasizes the need for further research to develop advanced AI algorithms capable of handling complex soil nutrient data and integrating AI with sensor networks and remote sensing technologies for improved soil analysis. The review serves as a foundation for future exploration of artificial intelligence’s potential in soil nutrient analysis and suggests areas on continued investigation and development in the field.
Folorunso et al. [14] explored ML techniques for the forecasting of soil properties, crop production, and soil productivity, emphasizing the superior performance of Random Forest and deep learning compared to classical machine learning methods. It emphasizes challenges in predicting soil conditions and crop yield accurately due to factors like inaccurate data, regional variations, and the need for expert collaboration and model refinement. By leveraging machine learning techniques, such as RF and deep learning, in soil analysis, it is possible to optimize agricultural practices, enhance productivity, and manage land resources efficiently, especially in less developed nations facing challenges like limited resources and data availability.
Trontelj ml and Chambers [15] found that Artificial Neural Networks (ANN) performed the best for a local farm setting. However, when dealing with a larger, worldwide dataset of soil information, the most effective method was using a type of model called Least Squares Support Vector Machines (LS-SVM). They enhanced this approach by reducing the complexity of the data using 50 key features (Principal Components or PCs) and categorizing the data into multiple distinct groups. They discovered that Category III provided the most successful results among these categories. Gurubaran et al. [16] suggested a system which utilizes a multiple linear regression model for forecasting the nutrient level in the soil, providing valuable information on soil nutrient composition. With an accuracy of 78%, this approach is considered reliable for assessing crop fertility efficiently.
Akinola and Dowd [17] successfully predicted certain soil properties, such as calcium (Ca), with low error using cost-effective soil characteristics and advanced machine learning algorithms, in addition to pH prediction. This suggests that machine learning techniques hold great potential for accurately predicting soil properties, especially when combined with domain-specific knowledge and more data, thereby enhancing the effectiveness of soil property prediction methods. Several researchers have carried out related works in the area of prediction using supervised machine learning techniques; see authors [18-24] for comprehensive applications of these techniques in enhancing cash crop production.
While these studies demonstrate promising results, gaps remain in multi-nutrient predictions and in models' ability to generalize across different soil types. The following gaps were identified:
1. high-quality, diverse datasets for model training and validation, especially from different geographic regions and crop types were not collected.
2. Many papers that predicted soil properties did not provide specific ranges of these properties that are necessary for optimal crop growth, which may not be widely known among smallholder farmers.
3. Limited research on how machine learning predictions are integrated into practical decision-making tools for farmers.
This section outlines the methodology for predicting soil properties for cash crop production (Maize cultivation) using machine learning. Five different machine learning models were employed and they are: Random Forest (RF), Linear Regression (LR), Support Vector Machine (SVM), Hybrid model (combination of Linear Regression and SVM), and ensemble model (combination of RF, LR, and SVM). Radom Forest has been extensively utilised in the literature for prediction of crop yields while other basic machine learning algorithms have been sparingly used. in this study, RF was benchmarked with LR, SVM, hybridized LR and SVM, and ensembled RF, LR, and SVM. The rationale behind this selection is to know whether any of these models can perform better than RF.
The remainder of this section provides a thorough discussion of the model's design and architecture. The execution of the models comprised five principal processes, detailed as follows:
3.1 Dataset collection
The main dataset used in this research was obtained from the “Nigeria_Soils_Data” from Africa Geoportal. It contains 1545 rows and 21 Columns. This dataset comprises soil samples collected from various locations across Nigeria. This can be accessed over the website:
https://www.africageoportal.com/maps/CSI::iita-soil-data-nigeria/about.
The dataset includes both soil spectral measurements and several soil properties such as pH, Carbon, and others as target variables. Nitrogen, Phosphorus and Potassium are the three target variables for predictions. The columns in the dataset – Ca: Mehlich-3 extractable Calcium, Cu: Copper, Depth code, Depth: Soil depth, Farm, Project, Fe: Iron, K: Potassium, Latitude, Longitude, Mg: Magnesium, Mn: Manganese, N: Nitrogen, Na: Sodium, OC: Soil Organic Carbon, P: Mehlich-3 extractable Phosphorus, pH values, Zn: Zinc.
Since the targeted macro nutrients are Nitrogen, Phosphorus, and Potassium; N: Nitrogen, K: Potassium, and P: Mehlich-3 extractable Phosphorus were used as input among the several columns in the dataset. These input data are needed to train the models in readiness for the soil macro nutrients prediction using the testing dataset.
3.2 Data preprocessing
Data Cleaning was done by elimination of Outliers using the z-score method while missing data were dealt with by replacing them with the mean values through imputation of each feature.
Feature Engineering: Utilizing Principal Component Analysis (PCA) to transform spectral data in order to decrease dimensionality while retaining a significant portion of the variance in the data.
Normalization: Standardization of feature scales to ensure that no single feature dominates the model due to scale differences.
Standardized value = (original value – mean) / standard deviation
Encoding: converting classes of text data into numbers using label encoding
3.3 Model design and development
The cleaned data was run through the Support Vector Machine, Linear Regression, Random Forest Models as well as combinational model to form a hybrid and ensemble model. Specific features were selected as inputs into the model. Next, the data was divided into a training set and a testing set and trained using Random Forest, Linear Regression and Support Vector Machine algorithm. Bagging method was implemented in the hybrid model by training the models on different subsets of data and averaging their predictions to improve the overall accuracy. The Bagging method was implemented by creating multiple subsets of the training data through random sampling with replacement, training individual decision trees on each subset, and aggregating their outputs. This approach reduced variance, minimized overfitting, and improved model generalization. The Random Forest model, which utilizes Bagging, demonstrated superior predictive accuracy and stability compared to other models. Performance improvements were evident in accuracy, mean squared error, and R-squared values, confirming the effectiveness of Bagging in enhancing soil macro-nutrient prediction for cash crop production.
3.4 Model training and testing
The dataset was divided into testing (20%) and training (80%) subsets in order to assess the models accurately. Cross-validation was done by applying k-fold cross-validation with k set to 5 during training. The model testing was carried out through model evaluation using the hold-out testing set to determine the generalizability of every model beyond the observed data.
3.5 Performance evaluation
The following metric were used to evaluate the performance of the models:
Mean Absolute Error (MAE) is computed by averaging the absolute deviations of the projected values from actual values. A smaller MAE suggests a more accurate match between the model and the data, signifying that the predictions are more similar to the original values, whereas a larger MAE shows a less precise fit among the data and the model. Mathematically, it is represented as seen in Eq. (1):
$M A E=\frac{1}{n} \sum_{i=1}^n\left|y_i-y_i^{\circ}\right|$ (1)
where $n$ is number of observations, $y_i$ is actual value, and $y_i^{\circ}$ is predicted value.
Mean Squared Error (MSE) calculates the mean squared error between the estimated values and the true values. A small MSE suggests that the model is performing well by closely predicting the actual values. A large MSE indicates a significant difference between the expected and observed values, showing a lack of accuracy in the model. Mathematically, it is represented as seen in Eq. (2):
$M S E=\frac{1}{n} \sum_{i=1}^n\left(y_i-y_i^{\circ}\right)^2$ (2)
where, $n$ is number of observations, $y_i$ is actual value, and $y_i^{\circ}$ is predicted value.
Root Mean Squared Error (RMSE) is also a statistical metric that calculates the mean distance among the estimated values and the original values. It is computed by picking the square root of the mean of the squared difference among the estimated values and the original values. Root Mean Squared Error is often used for regression analysis tasks to measure the precision of the estimations made by a model. A lower RMSE value indicates that the model is more accurate, while a higher RMSE value shows that the model is less precise. Mathematically, it is represented as in Eq. (3):
$R M S E=\sqrt{\frac{1}{n} \sum_{i=1}^n\left(y_i-y_i^{\circ}\right)^2}$ (3)
where $n$ is number of observations, $y_i$ is actual value, and $y_i^{\circ}$ is predicted value.
R-squared (R²) Score is a statistical measure that evaluates the degree that the regression model aligns with the data observed. A value from 0 to 1, where higher values signify a stronger match. The r-squared value is determined by dividing the variance of the projected values by the variance of the original values. An r-squared value of 1 shows the model fits the data perfectly, whereas a value of 0 shows that the model doesn't fit the data. These metrics will offer a thorough insight into the model’s efficiency in terms of both prediction accuracy and error size across various dimensions. Mathematically, R2 is defined as seen in Eq. (4):
$R^2=1-\frac{S S_{r e s}}{S S_{t o t}}$ (4)
where $S S_{r e s}$ (Residual Sum of Squares) represents the sum of the squares of the discrepancies among the predicted values and the observed values is presented in Eq. (5):
$S S_{r e s}=\sum_{i=1}^n\left(y_i-y_i^{\circ}\right)^2$ (5)
$S S_{t o t}$ (Total Sum of Squares) represents the total sum of the squared deviations from the mean of the observed data, as shown in Eq. (6):
$S S_{t o t}=\sum_{i=1}^n\left(y_i-\bar{y}\right)^2$ (6)
where, $y_i$ is the actual value, $y_i^{\circ}$ is the predicted value, $\bar{y}$ is the mean of the actual values, and $n$ is the number of observations.
4.1 Implementation
The study delved into analysis of various machine learning models for the prediction of the soil nutrients for the optimal yield of maize as a cash crop. Five different machine learning models were employed and they are: Random Forest (RF), Linear Regression (LR), Support Vector Machine (SVM), Hybrid model (combination of Linear Regression and SVM), and ensemble model (combination of RF, LR, and SVM). The data used was collected from the “Nigeria_Soils_Data” from Africa Geoportal. It contains 1545 rows and 21 Columns. This dataset comprises of soil samples collected from various locations across Nigeria. The dataset was preprocessed by eliminating missing data using the mean values as replacement, feature selection, encoding of specific categories, and splitting the data. The dataset was divided into testing (20%) and training (80%) subsets in order to assess the models accurately and the application of k-fold cross-validation with k set to 5 during training. The model evaluation was carried out using the hold-out testing set to determine the generalizability of every model beyond the observed data. The model training had a runtime of 3,275 seconds (54.58Minutes) and had a total execution time of 95.8 seconds (1.60 Minutes). Performance metrics for each model were stored in individual dictionaries and computed finally for evaluation.
4.2 Result
This section presents the results of this research work.
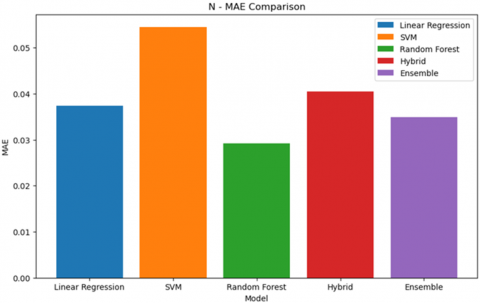
To assess the effectiveness of the models, R-squared Score, Mean Absolute Error, Mean Squared Error and Root Mean Squared error were employed as evaluation metrics. Table 1 shows the mean absolute error for all models with the value for each target variable. Random Forest (RF) as it outperforms the remaining models within the metric by having the least MAE on each target variable of 0.029078, 5.665326 and 31.973007 respectively.
Table 1. MAE result
|
Soil Property |
LR |
RF |
SVM |
HM |
EM |
|
Nitrogen |
0.037414 |
0.029078 |
0.054515 |
0.040440 |
0.034768 |
|
Phosphorus |
7.256044 |
5.665326 |
6.027469 |
6.228596 |
5.836416 |
|
Potassium |
50.155044 |
31.973007 |
41.261708 |
44.214035 |
39.713155 |
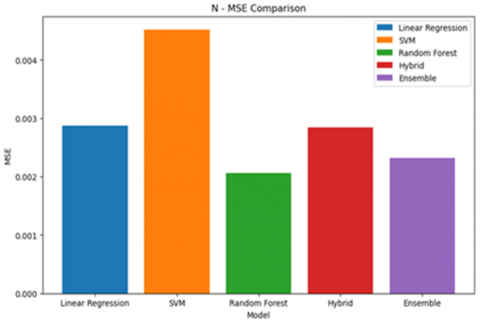
Table 2 shows the mean square error for all models with the value for each target variable. Random Forest (RF) as it outperforms the remaining models within the metric by having the least MSE on each target variable of 0.002053, 275.175849, 2295.658259 respectively.
Table 2. MSE result
|
Soil Property |
LR |
RF |
SVM |
HM |
EM |
|
Nitrogen |
0.002879 |
0.002053 |
0.004521 |
0.002848 |
0.002304 |
|
Phosphorus |
337.034887 |
275.175849 |
354.864800 |
338.184714 |
305.783481 |
|
Potassium |
5741.544328 |
2295.658259 |
4597.416964 |
4726.650135 |
3555.988820 |
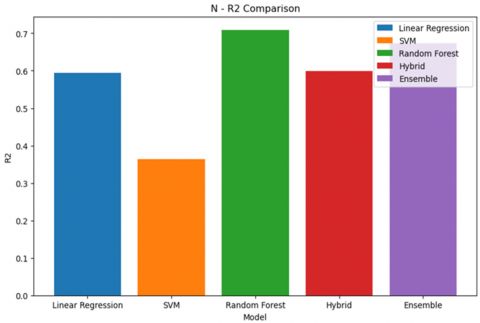
Table 3 shows the $R\ squared \left(R^2\right)$ score for all models with the value for each target variable. Random Forest (RF) as it outperforms the remaining models within the metric of R squared by having the closest value to 1 on each target variable of 0.710939, 0.310656, 0.654054 respectively.
Table 3. R2 score
|
Soil Property |
LR |
RF |
SVM |
HM |
EM |
|
Nitrogen |
0.594711 |
0.710939 |
0.363569 |
0.599112 |
0.675614 |
|
Phosphorus |
0.155692 |
0.310656 |
0.111027 |
0.152812 |
0.233980 |
|
Potassium |
0.134774 |
0.654054 |
0.307189 |
0.287715 |
0.464128 |
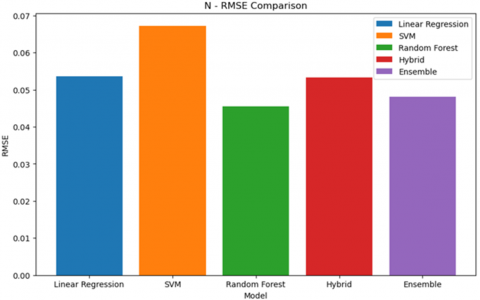
Table 4 shows the mean absolute error for all models with the value for each target variable. Random Forest (RF) as it outperforms the remaining models within the metric of RMSE by having the lowest value on each target variable of 0.045325, 16.588425, 47.913028 respectively.
Table 4. RMSE result
|
Soil Property |
LR |
RF |
SVM |
HM |
EM |
|
Nitrogen |
0.053658 |
0.045315 |
0.067239 |
0.053365 |
0.048004 |
|
Phosphorus |
18.358510 |
16.588425 |
18.837855 |
18.389799 |
17.486666 |
|
Potassium |
75.772979 |
47.913028 |
67.804255 |
68.750637 |
59.632112 |
4.3 Visualization of evaluation result
This section used bar chart to depict the performance evaluation metric results as shown in Figures 1-4.
Figure 1 shows how Random Forest performed better by having the lowest RMSE score of 0.045315 among all the respective models.
Figure 1. RMSE result
Figure 2. MSE result
Figure 2 shows how Random Forest does better by having the lowest MSE score of 0.002053 among all the respective models.
Figure 3. MAE result
Figure 4. R2 result
Figure 3 shows how Random Forest does better by having the lowest MAE score of 0.029078 among all the respective models
Figure 4 shows how Random Forest does better by having the lowest R Square score of 0.710939 among all the respective models.
4.4 Result discussion
This study examined the performance of five different machine learning models in the prediction of soil macro-nutrients (Nitrogen, Phosphorus, and Potassium) for cash crop optimal yield. The models used are Random Forest (RF), Linear Regression (LR), Support Vector Machine (SVM), Hybrid model (combination of Linear Regression and SVM), and ensemble model (combination of RF, LR, and SVM). The evaluation metrics used are MAE, MSE, RMSE, and $R^2$. The metrics are used to measure the precision and accuracy of the outcome against the observe values. Lower values of MAE, MSE, and RMSE signify higher prediction accuracy, while higher values indicate lower accuracy. Similarly, for the R² score, values approaching 1 reflect strong predictive performance, whereas values closer to 0 suggest poor accuracy. The result of this research emphasizes the superior performance of Random Forest (RF) as it outperforms the remaining models within the metrics of MAE, MSE, $R^2$, RMSE. The performance evaluation results for MAE, MSE, $R^2$, RMSE under Nitrogen are: 0.029078, 0.002053, 0.710939, 0.045315 respectively. The performance evaluation results for MAE, MSE, $R^2$, RMSE under Phosphorus are: 5.665326, 275.175849, 0.310656, 16.588425 respectively. The performance evaluation results for MAE, MSE, $R^2$, RMSE under Potassium are: 31.973007, 2295.658259, 0.654054, 47.913028 respectively.
Contrary to expectation as regard the combination of models to achieve higher accuracy and performance, the combinational models – especially the ensemble of LR, SVM and RF, was unable to outperform Random Forest as it on its own is an Ensemble Model. Also considered is the ensemble method which was bagging, played a huge role in the results.
The implication of these results on agricultural practices decision making can be aligned with the objective of this study. The objective is to determine the best machine learning model for the prediction of soil macro nutrients for cash crop optimal yield. The soil nutrients are vital in the optimal yield of crops and timely information on the quantity of these nutrients in the soil is key for a good harvest. To have a good information about these soil nutrients’ level, there is need for a better performed model with low MAE, MSE, RMSE and high $R^2$ values for high accurate and precise prediction. Otherwise, the crop yield will be low thereby having a negative impact on the farmers and the resultant effect on the populace because of the scarity of these crops. This suggests that lower agricultural yields result in increased demand, constrained supply, and steadily rising pricing for purchases. To prevent this ugly situation, a best performed machine learning model is needed in this regard for good agricultural decision making.
In summary, the superiority of Random Forest can be attributed to its ability to manage high-dimensional data effectively while reducing overfitting through ensemble learning techniques.
This research study examined five machine learning models for the best prediction of Nitrogen, Phosphorus, and Potassium (soil macro-nutrients) for optimal yield of maize as a cash crop. The prediction of soil nutrient levels is critical for optimizing cash crop production, ensuring both economic viability and sustainable agricultural practices. Researchers have used several machine learning models to predict the nutrients for the good yield of the nutrients, but with all these, the supply and demand based on nutrients that provide the good yield cannot be met.
Linear Regression, Support Vector Machine, Random Forest, hybridized LR and SVM, and Ensemble model (RF, LR, and SVM) were trained and tested with Nigeria_Soils_Data” from Africa Geoportal. The dataset was cleansed and splitted into ratio 80:20 for training and testing respectively. Four evaluation metrics (MAE, RSME, MSE, and $R^2$) were used for result comparison. In all, Random Forest outperformed all the other models. This result shows RF as the best model for the prediction of macro-nutrients levels in the soil.
5.1 Recommendation
The following recommendations were made upon conclusion of this research:
-Climate data should be made more accessible, as this would help to increase prediction accuracy.
-Soil data should be presented in a more easily accessible format to researchers and soil scientists.
-Other Ensemble learning types should be explore.
5.2 Future direction
In this article, RF has been upheld as the best performed model among the five other machine learning models. However, there is need to consider all nutrients needed for the optimal yield of cash crops with more basic machine learning models, deep learning models, and probably reinforcement model. This is necessary in good agricultural practices and decision making to prevent loss to farmer and for more food production at a cheaper rate to the populace. Also, real time soil data need to be considered to serve as a validating data set for the testing of the models.
The authors hereby acknowledge Covenant University Centre for Research, Innovation and Discovery (CUCRID) for their support toward the completion of this research.
[1] Ogundari, K., Ojo, S.O. (2005). The determinants of technical efficiency in mixed crop food production in Nigeria: A stochastic parametric approach. East Africa Journal of Rural Development, 21(1): 15-22. https://doi.org/10.4314/eajrd.v21i1.28368
[2] Ayinde, O.E., Ajewole, O.O., Adeyemi, U.T., Salami, M.F. (2018). Vulnerability analysis of maize farmers to climate risk in Kwara State, Nigeria. Agrosearch, 18(1): 25-39. https://doi.org/10.4314/agrosh.v18i1.3
[3] Niazi, P., Monib, A. (2023). Function of macronutrients in plant growth and human. International Journal of Scientific Development and Research, 8(4): 1265.
[4] Jat, R.K., Mukesh, K., Jat, M.L., Shivran, J.S. (2020). A review on use of micronutrients in tropical and subtropical fruit crops. International Journal of Current Microbiology and Applied Sciences, 9(5): 2744-2753. https://doi.org/10.20546/ijcmas.2020.905.315
[5] Masrie, M., Rosman, M.S.A., Sam, R., Janin, Z. (2017). Detection of nitrogen, phosphorus, and potassium (NPK) nutrients of soil using optical transducer. In 2017 IEEE 4th International Conference on Smart Instrumentation, Measurement and Application (ICSIMA), Putrajaya, Malaysia, pp. 1-4. https://doi.org/10.1109/ICSIMA.2017.8312001
[6] Islam, M.R., Oliullah, K., Kabir, M.M., Alom, M., Mridha, M.F. (2023). Machine learning enabled IoT system for soil nutrients monitoring and crop recommendation. Journal of Agriculture and Food Research, 14: 100880. https://doi.org/10.1016/j.jafr.2023.100880
[7] Zingore, S., Mafongoya, P., Nyamugafata, P., Giller, K.E. (2003). Nitrogen mineralization and maize yields following application of tree prunings to a sandy soil in Zimbabwe. Agroforestry Systems, 57: 199-211. https://doi.org/10.1023/A:1024887225450
[8] Kumar, R., Kumar, R., Prakash, O. (2019). Chapter-5 the impact of chemical fertilizers on our environment and ecosystem. In Research Trends in Environmental Sciences, pp. 71-85.
[9] Kumar, A., Kumar, N., Vats, V. (2018). Efficient crop yield prediction using machine learning algorithms. International Research Journal of Engineering and Technology, 5(6): 3151-3159.
[10] Odebiri, O., Odindi, J., Mutanga, O. (2021). Basic and deep learning models in remote sensing of soil organic carbon estimation: A brief review. International Journal of Applied Earth Observation and Geoinformation, 102: 102389. https://doi.org/10.1016/j.jag.2021.102389
[11] Shahare, Y., Gautam, V. (2021). Soil nutrient assessment and crop estimation with machine learning method: A survey. In Cyber Intelligence and Information Retrieval: Proceedings of CIIR 2021, pp. 253-266. https://doi.org/10.1007/978-981-16-4284-5_22
[12] Kumar, V., Malhotra, J.S., Sharma, S., Bhardwaj, P. (2022). Soil properties prediction for agriculture using machine learning techniques. Journal of Engineering Research and Sciences, 1(3): 9-18. https://doi.org/10.55708/js0103002
[13] Jain, S., Sethia, D. (2023). A review on applications of artificial intelligence for identifying soil nutrients. In Agriculture-Centric Computation: First International Conference, ICA 2023, Chandigarh, India, pp. 71-86. https://doi.org/10.1007/978-3-031-43605-5_6
[14] Folorunso, O., Ojo, O., Busari, M., Adebayo, M., et al. (2023). Exploring machine learning models for soil nutrient properties prediction: A systematic review. Big Data and Cognitive Computing, 7(2): 113. https://doi.org/10.3390/bdcc7020113
[15] Trontelj ml, J., Chambers, O. (2021). Machine learning strategy for soil nutrients prediction using spectroscopic method. Sensors, 21(12): 4208. https://doi.org/10.3390/s21124208
[16] Gurubaran, K., Poornesh, S., Shwetha, L.S., AMB, D.A., Vidhya, N., Ramesh, P., Bhuvaneswari, P.T.V. (2023). Machine learning approach for soil nutrient prediction. In 2023 IEEE Silchar Subsection Conference (SILCON), Silchar, India, pp. 1-6. https://doi.org/10.1109/SILCON59133.2023.10405095
[17] Akinola, I., Dowd, T. (2016). Predicting Africa soil properties using machine learning techniques. https://cs229.stanford.edu/proj2014/Iretiayo%20Akinola,%20Thomas%20Dowd,%20Predicting%20Africa%20Soil%20Properties.pdf.
[18] Adegoke, M.A., Adedotun, A.F., Odeyinde, T., Grace, A.O., Sotonwa, K.A., Aribisala, B.S., Oluwole, O.A., Onuche, O.G. (2024). Development of stroke prediction system using neural network with sigmoid activation function. Journal Européen des Systèmes Automatisés, 57(6): 1753-1760. https://doi.org/10.18280/jesa.570623
[19] Eweoya, I.O., Odetunmibi, O.A., Odun-Ayo, I.A., Agbele, K.K., Adedotun, A.F., Akingbade, T.J. (2023). Machine learning approach for the prediction of COVID-19 spread in Nigeria using SIR model. International Journal of Sustainable Development and Planning, 18(12): 3783-3792. https://doi.org/10.18280/ijsdp.181210
[20] Meqdad, M.N., Al-Qudsy, Z.N., Kadry, S., Haleem, A.S. (2024). Using neural networks to forecast the configuration of proteins. Ingénierie des Systèmes d’Information, 29(4): 1461-1468. https://doi.org/10.18280/isi.290419
[21] Dubaish, A.A., Jaber, A.A. (2024). Comparative analysis of SVM and ANN for machine condition monitoring and fault diagnosis in gearboxes. Mathematical Modelling of Engineering Problems, 11(4): 976-986. https://doi.org/10.18280/mmep.110414
[22] Adesina, O.S., Adedotuun, A.F., Adekeye, K.S., Imaga, O.F., Adeyiga, A.J., Akingbade, T.J. (2024). On logistic regression versus support vectors machine using vaccination dataset. Journal of the Nigerian Society of Physical Sciences, 6(1): 1092. https://doi.org/10.46481/jnsps.2024.1092
[23] Aromolaran, O., Aromolaran, D., Isewon, I., Oyelade, J. (2021). Machine learning approach to gene essentiality prediction: A review. Briefings in Bioinformatics, 22(5): bbab128. https://doi.org/10.1093/bib/bbab128
[24] Farchi, C., Farchi, F., Touzi, B., Mousrij, A. (2024). Sustainable multidimensional performance prediction by ANN-based supervised machine learning. Ingénierie des Systèmes d’Information, 29(3): 969-985. https://doi.org/10.18280/isi.290317