Ayodeji G. Abiodun*![]() | Obumneme Kelechi Ukandu
| Obumneme Kelechi Ukandu![]() | Akinsanya Seye Emmanuel
| Akinsanya Seye Emmanuel![]() | Chinaemerem Sonia Udechukwu
| Chinaemerem Sonia Udechukwu![]() | Oladapo Michael Olagbegi
| Oladapo Michael Olagbegi![]() | Thayananthee Nadasan
| Thayananthee Nadasan![]() | Olayemi Bakare
| Olayemi Bakare![]()
© 2025 The authors. This article is published by IIETA and is licensed under the CC BY 4.0 license (http://creativecommons.org/licenses/by/4.0/).
OPEN ACCESS
Heart disease is a significant global health issue, causing millions of deaths annually. Despite advancements in medical technology, early and accurate diagnosis remains challenging. This study aims to detect heart diseases using binary classification machine learning models. The methodology employed a Heart Failure Prediction Dataset from Kaggle, with no issues of duplicates, missing data, outliers, or multicollinearity. Five machine learning models, including K-Neighbor Classifier, decision tree, support vector machine, random forest, and logistic regression, were trained and tested. The random forest model with hyper-parameters 'n_estimators': list (range (5,40,3)), 'max_features': ['log2', 'sqrt'] yielded the highest accuracy rate of 87.5%, precision rate of 90.4%, recall rate of 87.9%, f1_score of 89.1%, and auc_score of 93.6%. These results indicate that the random forest model has a notable capacity for accurate heart disease prediction, offering potential benefits such as reduced mortality rates and improved patient outcomes. Further research is recommended to establish standard data collection and analysis methods and to develop prediction models that consider the unique characteristics of diverse populations.
binary classification, cardiovascular disease, diagnosis, feature selection, heart disease, machine learning
Heart diseases are atherosclerotic Conditions that impact the heart organ, which include ailments like arrhythmias, heart failure, and coronary artery disease [1]. Smoking, high blood pressure, raised cholesterol levels, bad eating choices, inactivity, and obesity all increase the chance of getting particular cardiac diseases. One of the most common cardiac disorders is coronary artery disease, which is identified by the constriction or obstruction of the coronary arteries, chest pain, heart attacks, and strokes that may result from it. Other heart issues include endocarditis, an inflammation of the inner layer of the heart, congestive heart failure, irregular heartbeats, congenital heart problems apparent at birth, and irregular heart rhythms [2]. The phrase "cardiovascular disease" encompasses conditions that affect the heart [3]. These heart-related disorders can be avoided or controlled with the help of medication if the patient adopts a healthy lifestyle.
Modern healthcare has come a long way, for example [2] made a considerable contribution to the global increase in average life expectancy by introducing intelligent algorithms with high accuracy levels in classifying different heart diseases. The complexity of addressing the changing demands of an aging population, as well as increased service demand and rising expenses, provides difficulties for healthcare systems. As a result, the healthcare sector has produced a vast amount of data about individuals, ailments, and diagnoses. Unfortunately, due to insufficient investigation and analysis, the entire potential of this material stays untapped. Medical experts have a fantastic potential to improve patient prognosis thanks to the expanding body of medical data. Healthcare professionals have been utilizing computers more and more in recent years to enhance decision assistance. For difficult jobs like deciphering genomic data and turning medical records into useful knowledge, machine learning has turned out to be a valuable technique in the healthcare industry.
The United States is one such country where heart disease remains the primary cause of death for individuals of all genders and across various racial and ethnic backgrounds. The alarming fact is that every 33 seconds a person dies of cardiovascular disease in the US [4]. Heart disease will have a significant impact because it will be responsible for 20% of all fatalities in 2021, killing about 695,000 people. Heart disease has a large financial impact as well; it costs the US $239.9 billion annually in healthcare costs, prescription drug costs, and the financial fallout from premature deaths [4].
Cardiovascular disease is not only a leading cause of death globally but also a major source of financial strain on healthcare systems. According to the American Heart Association, the expenses associated with treating cardiovascular conditions in the United States could surge to \$1.1 trillion by 2035, driven by rising disease rates [5]. Worldwide, cardiovascular diseases contribute over \$1 trillion annually in both direct medical costs and indirect losses, such as diminished workforce productivity. This economic burden is particularly severe in low- and middle-income nations, which account for approximately 75% of the global cases, thereby worsening existing financial disparities [6].
Table 1 illustrates research regarding heart disease and its impact on men who are African American, American Indian or Alaska Native, Hispanic, and white, this shows the statistics of heart disease on certain races in the United States.
Table 1. The percentages of heart disease deaths among the various ethnic groups (races) in 2021
|
Ethnic Group |
Death Rate (%) |
|
American Indian or Alaska Native |
15.5 |
|
Asian |
18.6 |
|
Black (Non-Hispanic) |
22.6 |
|
Native Hawaiin or Other Pacific Islander |
18.3 |
|
White (Non-Hispanic) |
18.0 |
|
Hispanic |
11.9 |
|
All |
17.4 |
In terms of annual mortality, cardiovascular diseases (CVDs) are the leading cause of death globally, outpacing all other causes [7]. A startling 31% of all fatalities worldwide in 2015 were attributable to CVDs, which claimed an estimated 17.7 million lives in that year alone. Within this sobering figure, coronary heart disease was responsible for about 7.4 million deaths while stroke claimed 6.7 million. Notably, low- and middle-income countries occupy the largest share in nearly 75 percent of CVD-related mortality. Unbelievably, 82% of the 17 million premature deaths from noncommunicable illnesses that occurred in 2015 occurred in these low-income areas, with cardiovascular diseases (CVDs) accounting for 37% of those deaths [8].
However, most cardiovascular diseases are preventable and many of them are due to Risk factors that can be changed, such as smoking, unhealthy eating habits, and being overweight, inactivity, and excessive alcohol consumption [9]. Early detection and management are essential for those with cardiovascular disease or those who have a high risk (as a result of conditions like hypertension, diabetes, hyperlipidemia, or pre-existing conditions), and they should include the proper counseling and pharmacological interventions.
Diagnosing heart disease accurately and swiftly remains a significant challenge in medicine despite advances in technology. While existing diagnostic tools have limitations, such as precision issues with electrocardiograms and the risks associated with invasive therapies, there is a pressing requirement for a dependable, non-invasive, and efficient diagnostic method that supports early detection. Machine learning algorithms offer promise in utilizing available data, including routine blood tests and patient demographics like age and gender, to predict future cardiac events accurately. However, previous research using other machine learning models has yielded suboptimal results due to limited datasets and lack of cross-validation, relying solely on baseline models. Leveraging the predictive power of ensemble models like random forests could address these limitations and improve diagnostic accuracy.
This study aims to detect heart disease using a predictive binary classification machine learning model. Therefore, the specific objectives of the study include:
1.1 Problem statement
Several studies have demonstrated the efficacy of machine learning techniques in predicting heart disease, achieving high levels of accuracy and reliability. For instance, models utilizing algorithms such as Support Vector Machines (SVM), Random Forests, and Gradient Boosting have reported accuracy rates exceeding 90%. These results suggest that machine learning can significantly enhance traditional diagnostic methods by providing more precise risk assessments and enabling personalized treatment plans tailored to individual patients.
Despite the promising results from various machine learning applications in heart disease detection, challenges remain in terms of model interpretability and integration into clinical practice. Ensuring that these models are transparent and understandable is crucial for gaining the trust of healthcare providers and patients alike. Therefore, this research aims to develop a binary classification machine learning model specifically designed for heart disease detection, focusing on achieving high predictive performance while maintaining interpretability. By addressing these critical aspects, this study seeks to contribute to the ongoing efforts to improve heart disease diagnosis and management through innovative technological solutions.
Heart disease continues to pose a significant threat to global health, and the integration of machine learning into diagnostic practices offers a viable pathway toward enhanced early detection and intervention strategies. This research endeavors to harness the power of machine learning to develop an effective binary classification model that can aid in identifying individuals at risk for heart disease, ultimately contributing to better health outcomes and reduced healthcare costs.
The research using machine learning and hyperparameter optimization [10], aimed to develop a robust predictive model for heart disease detection addressing both the absence or presence of cardiovascular disease (CVD) and its severity levels, utilizing methods such as Synthetic Minority Oversampling Technique (SMOTE), classifiers based on Machine Learning (ML), and optimization using Hyperband (HB). Methodologically, the study integrates optimization algorithms with data balancing techniques and ML approaches, conducting experiments on the Cleveland and Statlog datasets. Weaknesses include a lack of detailed discussion on potential limitations of the proposed methodology, such as the generalizability of results across diverse datasets or the computational resources required for implementing the optimization algorithms. Additionally, while the study compares results with prior research, it lacks a thorough analysis of potential confounding variables or biases in those comparisons, potentially affecting the validity of claims regarding the superiority of the proposed model.
Alalawi and Alsuwat [11] sought to compare various machine learning predictive models for CVD using patient data and preprocessing techniques. Methodologically, the study employs classifiers such as SVM, DT, LR, KNN, NB, and ANN, comparing their performance using metrics like Precision, Recall, F1-score, and Accuracy. Areas for improvement include the omission of potential biases arising from data collection methods or the selection of features, which could affect the generalizability of results. Furthermore, while the study presents comparative performance metrics, it lacks a thorough analysis of potential confounding variables or biases in those comparisons, potentially affecting the validity of claims regarding the superiority of the gradient-boosting model.
Study on the categorization of heart conditions through enhanced machine learning techniques [12], the objective is to develop an automated model for the early detection Utilizing machine learning for the detection of heart disease procedure, focusing on optimizing classification results and comparing various classifiers. It utilizes a diverse dataset compiled from five well-known cardiovascular disease datasets and employs data preprocessing methods like cleaning, outliers’ removal, and normalization to improve model effectiveness. Various machine learning models like Support Vector Machines, K-Nearest Neighbor, Decision Tree, and Random Forest are utilized, with hyperparameter optimization using the Random Search technique to fine-tune the models. Performance metrics like accuracy, precision, recall, specificity, and F1-score serve as evaluation criteria. The strength of the study includes a comprehensive approach to model development, but it has limitations including potential biases in the dataset, a lack of transparency, no discussion on dataset limitations, a focus on accuracy in model evaluation, and insufficient discussion on generalizability and data imbalance impacts.
The objectives of the study [13] are to predict heart disease using a combined machine learning model, that utilizes Decision Tree and Random Forest algorithms, and to provide an automated medical diagnosis method for early detection of heart disease. The methodology entails data gathering and cleaning from the Cleveland heart disease dataset, implementing machine learning algorithms like Decision Tree, Random Forest, and a Hybrid model, and evaluating the models' performance. The strength of the study lies in the implementation of a novel hybrid machine learning model, which attains an accuracy level of 88% in predicting heart disease. However, the limitations include the lack of exploration of deep learning algorithms, the focus on binary classification without considering multi-class problems, and the absence of discussion on possible biases or constraints in the dataset. Moreover, there is a need to refine error metrics calculation and discuss its results in comparison with the existing literature.
The research study [14] intended to forecast heart disease using machine learning methods, focusing on improving the accuracy achieved in previous works. It utilized five common ML models, including Decision Tree, Naïve Bayes, Random Forest, Support Vector Machine, and Logistic Regression, on a dataset obtained from Kaggle. By implementing data preprocessing techniques, model selection, and 10-fold cross-validation, the study sought to enhance accuracy levels. The results showed significant improvements in classifier accuracy compared to previous research, particularly with Decision Tree, Logistic Regression, and SVM models. The detailed methodology, model performances, and dataset selection demonstrated advancements in heart disease prediction. However, potential weaknesses may include the limited discussion on potential biases or limitations in the dataset and the absence of exploration of deep learning algorithms, which could be avenues for future research.
Despite the advancements made in heart disease prediction through machine learning models, several limitations persist in the existing studies. Many works rely on small or narrowly focused datasets, which compromises the generalizability of their models across more diverse populations. For instance, studies that utilize the Cleveland heart disease dataset often encounter issues with sample size, leading to overfitting and limited applicability in real-world settings [12]. Moreover, imbalanced datasets remain a critical challenge, as negative heart disease cases frequently outweigh positive ones, distorting performance metrics such as accuracy and precision [10].
Some studies have attempted to address this imbalance using techniques like Synthetic Minority Oversampling Technique (SMOTE), yet these solutions are not consistently applied across the literature, resulting in overestimated performance metrics [10, 11]. Additionally, the handling of missing data and outliers is not always transparent, which can impact the robustness of these models in practical use [12].
In contrast, this study leverages a larger and more diverse dataset, integrating multiple sources to overcome these generalizability issues. The study looks to incorporate cross-validation and hyperparameter optimization to improve model robustness and mitigate overfitting. By using ensemble methods such as Random Forests, addressing the issue of imbalanced datasets more effectively, providing a more accurate and interpretable model for heart disease prediction.
For this research purpose secondary data was considered, we utilized the dataset "Heart Failure Prediction Dataset" which can be accessed at the Kaggle database for heart disease prediction [15]. This dataset stands out because of its original integration of different datasets that were not previously combined. Using this vast dataset, an array of machine learning models was created and evaluated with the goal of forecasting and preventing heart illnesses.
K-Nearest Neighbors (KNN), Decision Trees (DT), Logistic Regression (LR), Support Vector Machines (SVM), and Random Forests selection for the detection of heart disease in this study are grounded in their theoretical suitability and practical effectiveness for binary classification tasks. KNN operates on a simple principle of classifying data points based on the majority class among their nearest neighbors, making it particularly useful for heart disease prediction where decision boundaries may not be linear. Its non-parametric nature allows it to adapt to various datasets, capturing local patterns effectively. Decision Trees offer significant advantages in interpretability, allowing for easy visualization of decision-making processes, which is crucial in clinical settings. Logistic Regression, being straightforward and computationally efficient, provides quick insights into the relationship between independent variables and the likelihood of heart disease, outputting probabilities that facilitate risk assessment. Support Vector Machines excel in high-dimensional spaces, making them suitable for medical datasets with numerous features; their ability to apply different kernel functions allows them to adapt to various data distributions while maintaining robustness against overfitting. Random Forests leverage multiple decision trees to improve predictive performance and reduce overfitting through an ensemble approach, offering valuable insights into feature importance that can guide clinical decision-making. By integrating these diverse methodologies, this research aims to develop an effective predictive model that identifies individuals at risk for heart disease while supporting clinical decisions through clear insights into risk factors and underlying patterns.
The research model used in the proposed study is illustrated in the subsequent Figure 1. This dataset is of particular interest because it combines five different cardiac datasets and shares eleven common attributes. As a result, it currently stands as the largest dataset that has been found for heart disease research. The five constituent datasets used in creating this dataset are represented in Table 2.
Figure 1. Proposed modelling strategy
Table 2. The five constituent datasets
|
Location |
Number of Entry |
|
Long Beach VA |
200 observations |
|
Cleveland |
303 observations |
|
Stalog (Heart) Data Set |
270 observations |
|
Hungarian |
294 observations |
|
Switzerland |
123 observations |
3.1 Data description
The combined dataset comprises data from five distinct cardiac datasets and encompasses a set of 11 shared attributes. It includes a total of 12 characteristics, with 11 independent features and 1 target feature serving as the dependent variable, this is represented in Table 3. With a substantial sample size of 918 observations, this dataset holds the potential for predicting and potentially preventing cardiac diseases.
Table 3. The 12 attributes and their description from the datasets
|
Attribute |
Description |
|
Sex |
The patient's sex, designated as either Male (M) or Female (F) |
|
Age |
The age of the patient in years |
|
Chest Pain Type |
The classification of the chest pain felt by the patient is as follows: Typical Angina (TA) - Chest discomfort caused by myocardial ischemia. Atypical Angina (ATA) - Chest discomfort that does not fit the typical angina criteria. Non-Anginal Pain (NAP) - It may resemble angina but has different underlying causes. Asymptomatic (ASY) - Transient disruption in myocardial perfusion without chest pain or typical angina symptoms. |
|
RestingBP |
The patient’s blood pressure when at rest (mm Hg). |
|
Cholesterol |
Serum cholesterol or total cholesterol in milligrams per deciliter (mg/dl). |
|
FastingBS |
Blood glucose level after fasting [1: if FastingBS > 120 mg/dl, 0: otherwise]. 1: Blood glucose level after fasting greater than 120 mg/dl. 0: Else. |
|
RestingECG |
Categorized as follows: Normal: Indicates a normal resting electrocardiogram. ST: Shows the existence of ST-T wave abnormalities, like T wave inversions and/or ST elevation or depression of more than 0.05 mV. LVH: Suggests potential presence of left ventricular hypertrophy as per Estes' criteria. |
|
MaxHR |
Maximum heart rate, represented by numbers from 60 and 202. Maximal heart rate refers to the highest numerical value of heart beats per sixty seconds, the heart can reach during vigorous physical activities. |
|
Exercise Angina |
Exercise-induced angina refers to chest pain experienced during physical exertion or situations where the heart is required to work harder. Categorized as; Y: Yes, indicating the presence of chest discomfort during physical exercise or stress. N: No, indicating the absence of exercise-induced angina. |
|
Old peak |
Exercise-induced ST depression in comparison to rest is illustrated by a numerical value recorded in depression. |
|
ST_Slope |
The classification of the slope of the ST segment during peak exercise is as follows: Up: Upsloping, indicating an upward slope. Flat: Flat, indicating a horizontal or no significant slope. Down: Downsloping, indicating a downward slope. |
|
Heart Disease |
Output class categorized as follows: 1: heart disease. 0: No heart disease |
3.2 Data preprocessing and implementation
In the process of the data preparation for model training, it is important to identify the nominal and ordinal categorical variables in the dataset:
1. Ordinal categorical variables—ST_Slope
2. Nominal categorical variables—ChestPainType, RestingECG, ExerciseAngina, Sex
An ordinal categorical variable is a type of categorical variable that has a specific ranking or order among its possible values. These variables lie between categorical and quantitative variables. For example, education level has a distinct order, such as "high school", "college", and "graduate school".
On the other hand, a nominal categorical variable consists of two or more categories without any inherent hierarchy or order [16]. There is no natural ranking between the categories. A binary variable, such as a yes-or-no question, is an example of a nominal categorical variable, with two distinct categories (yes or no) and no inherent ordering.
Since machine learning models can only process numerical features and cannot directly handle categorical attributes, it is necessary to transform ordinal and nominal qualitative variables to numeric representations. This process is known as feature encoding. By encoding these categorical variables into numerical features, the machine learning model can effectively utilize them for training and prediction purposes. For ordinal categorical variables, we use an ordinal encoder method, as shown below: Where, ordinal_variable = ["ST_Slope"] For nominal categorical variables, we use one-hot encoding method, as shown below: Where, nominal_variable = ["Sex", "ChestPainType", "RestingECG", "ExerciseAngina"].
While the Heart Failure Prediction Dataset provides a robust framework for model training, it is obsereved that the dataset primarily combines records from several hospitals in the U.S. and Europe, which may introduce demographic biases. For example, patients from low- and middle-income regions are underrepresented, limiting the model’s generalizability to a global population. Additionally, the dataset, though free of outliers and missing data, could still suffer from a class imbalance, with heart disease cases outnumbering non-cases. This imbalance might inflate performance metrics such as accuracy, which is why the study employed cross-validation and data-balancing techniques to ensure more reliable results across diverse populations.
3.3 Train-test split
The dataset has to be split into the training dataset and the test dataset to run a machine learning process. The test dataset is used to assess how effectively the machine learning model has learned and how correctly it can generate predictions, while the training dataset is needed in order to train the model. A split ratio of 80:20 was employed for the "Heart Failure Prediction Dataset," using an 80-20 divide applying 80% for training the model and 20% for the evaluation. The train-test divide is put into practice as follows:
(1) The feature "HeartDisease," which serves as the output or target variable, is assigned to a variable called "target_variable" for ease of implementation and understanding.
(2) The "target_variable," which contains the "HeartDisease" feature, is then removed from the dataset.
(3) The modified data is assigned to a variable called "x". Subsequently, the dropped "target_variable" is assigned to another variable called "y".
(4) This separation allows for the independent handling of input features which is encoded as "x" and the variable targeted is stored in "y" during the training and test processes of the machine learning model.
(5) TRAIN: x-train (734 records, 18 attributes), y-train (734 records), distribution of target (401 “heart disease” which is 1, 333 “No Heart Disease” which is 0).
(6) TEST: x-test (184 records, 18 attributes), y-test (184 records), distribution of target (107 “heart disease” which is 1, 77 “No Heart Disease” which is 0).
3.4 Split data scaling (Normalization)
To ensure consistency in how machine learning models interpret the features, the dataset underwent a process called normalization [17]. The process of modifying different characteristics in a dataset is known as feature scaling, also known as normalizing. Real-world data often contains features with different size, scope, and unit values. Feature scaling is necessary so that machine learning models can understand these features on a consistent scale.
Normalization, specifically min-max scaling, was applied to the dataset. This scaling technique involves shifting the values within each column so that they have a set range between 0 and 1 as their bounds [18]. By performing normalization, the dataset's features are brought to a common scale, allowing machine learning models to accurately analyze the dataset. This is crucial because features in the dataset may originally have different magnitudes, ranges, and units. The min-max scaling approach used in this study ensures that the values within each column are adjusted to fit within the range of 0 to 1, promoting consistent and standardized interpretation of the data.
3.5 Model building (Baseline models)
The process of building baseline models involves creating simple reference models that serve as a benchmark in a machine learning project. These models are typically straightforward and may not possess strong predictive capabilities. However, including baseline models is crucial for various reasons [19]. Below is the breakdown of the baseline model building:
1. In this study, baseline models were constructed using several algorithms imported from the scikit-learn library. The specific models used include the Random Forest Classifier from the sklearn.ensemble module, SVC (Support Vector Classifier) from the sklearn.svm module, Decision Tree Classifier from the sklearn.tree module, K-Neighbors Classifier from the sklearn.neighbors module, and Logistic Regression from the sklearn.linear_model module.
2. To train the baseline models, the X-train data (input features) and Y-train data (target variable) were fitted into each respective model. This step involves using the training data to teach the models to make predictions based on the input features.
3.6 Model building: Cross validation model
Several methods that can be used in machine learning, and one of them is the cross-validation method that is used to determine how well fitted a model is for a new-coming data. This involves a process of partitioning the data into two or more subsamples or folds and can be defined as below in other words, it can be defined as a process of data partitioning. The different samples of the given data are divided into one part- this is the validation partition, and the other parts of the data samples are used in training of the model. Thus, this procedure is carried out time and time again, such that each of the folds is used as the validation set [20]. In order to increase the reliability and validity of the results, the performance of the model is evaluated at different epochs and the results are averaged out.
Cross-validation solves the difficulty of overfitting where the model is excessively trained on the training data and will not work well when tested on other data. Cross validation can be used to have a better estimate of how well the model works on other unseen validation sets. The sort of cross-validation include k-fold, the leave-one-out, the stratified [21]. The modeling challenge, the data requirements, the size and kind of the data, and other elements all have a role in the method of choosing.
Implementing cross-validation in the context of model creation often entails the following steps:
1. Add cross-validation modules from the Scikit-Learn package, like StratifiedKFold and GridSearchCV from sklearn.model_selection.
2. Import evaluation metrics from the scikit-learn package, such as confusion_matrix, roc_curve, auc from sklearn.metrics, accuracy_score, recall_score, f1_score, and precision_score.
3. Fit the X-train and Y-train data into the cross-validation modules to train the models.
3.7 Comparison between cross-validation and train/test split in machine learning
Train/test split: It involves splitting the input data into two data sets which includes the training data set and the testing data set in a ratio of 70:30 or 80:20. The training data is used to develop the model while the test data is used to evaluate the model developed. The primary disadvantage of this approach is that it has fairly high variance.
1. Train Datasets: The train set consists of observations used to train the model, where each observation has a known dependent variable.
2. Test Data: The test data is a subset of the original data with similar characteristics, and is separate from the data used for training purposes. It is used to check the performance of the trained model by making predictions.
Cross-Validation dataset: Cross-validation decision is used to avoid the drawbacks of the train/test split approach. In this method, data is divided into a number of partitions and each partition is used as the training and testing sets in turns. It is for this reason that assessments are then taken and averaged in order to arrive at a more accurate conclusion. Cross-validation is most advantageous when it is used in the tuning step of a trained model and all features and records are utilized in the training and testing step, which makes it far superior to the train-test split method.
In the process of building a model for a certain task it is recommended to evaluate a performance of a certain type of a machine learning model. Some of these are confusion matrix, recall, precision and accuracy.
3.8 Model building: Cross validation model
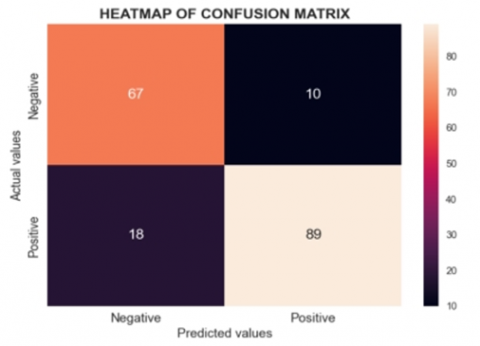
As indicated in the evaluation metrics, the effectiveness of the proposed model is determined by the confusion matrix, the recall rate, the precision, and the accuracy. The confusion matrix is an n × n matrix; the value of n being equal to total number of different target classes in the problem; helps in comparing the actual results with the results predicted by the ML model.
The matrix helps in comparing the actual values of the test set with the values that had been forecasted by the classifier [22]. In an effort to eliminate some level of error the aim is to increase True Negatives and True Positives and decrease False Negatives and False Positives. An optimal model will work towards the achievement of this balance.
True Negative (TN) is a state in which the machine learning model accurately predicts that a patient does not have heart disease, and the patient does not.
False Negative (FN) is a case whereby the model returns an indication that the patient has no heart disease while in the real sense he/she has the disease.
True Positive (TP) means that the model has classified a patient as having the heart disease when in fact the patient does have the disease.
False Positive (FP) means that the model produces results that indicate a certain patient have heart disease but in real sense he or she does not.
Accuracy is another measure that measures how correct the model is in the prediction it gives. However, accuracy is sometimes misleading especially when dealing with many class problems or datasets that have imbalanced classes.
Accuracy $=\frac{T P+T N}{T P+F P+T N+F N}$
A measure of how well a model distinguishes between positive cases, precision looks at the ratio of correctly identified positive cases to the total number of positive cases the model predicted, it is determined by the ratio of correctly deemed positives to the total of well classified positives and
Precision $=\frac{T P}{T P+F P}$
Recall quantifies how many accurately identified positive outcomes there are compared to all number of results in the true positive class. It reveals information on how well a model can locate relevant data.
Recall $=\frac{T P}{T P+F N}$
The F1-score is used to evaluate how well a model performs on a particular dataset, commonly in binary classification situations where data is grouped into "negative" and "positive" categories. The F1-score is determined by taking the harmonic mean of the model's precision and recall results, giving a comprehensive assessment of both measures.
F1-Score $=\frac{T P}{T P+1 / 2(F P+F N)}$
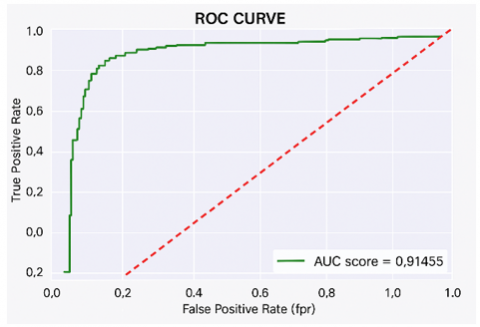
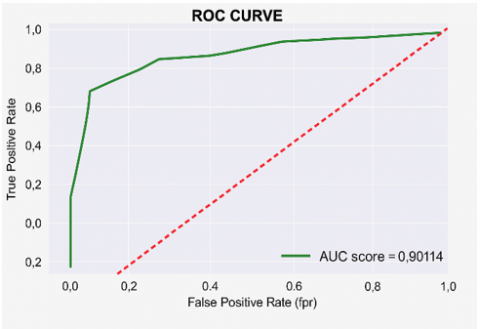
The AUC assesses the size of the 2D area under the ROC curve. It gives an indication of how well various threshold settings perform overall. The ROC curve shows how True Positive Rate and False Positive Rate are related, providing a visual representation of how well a classifier performs.
The performance and configuration results of the prediction classification models to predict heart diseases are displayed and examined in this section. In Table 4 the results for the baseline models are displayed. Figures 2-6 display the performance metrics comparison for all the baseline models.
Table 4. Compiled results of baseline models
|
Models |
Accuracy |
Precision |
Recall |
F1-Score |
AUC-Score |
|
Logistic Regression |
0.84 |
0.89 |
0.83 |
0.85 |
0.91 |
|
Support Vector Classifier |
0.86 |
0.90 |
0.85 |
0.88 |
0.90 |
|
K-Neighbor Classifier |
0.82 |
0.87 |
0.81 |
0.84 |
0.88 |
|
Decision Tree |
0.79 |
0.86 |
0.77 |
0.81 |
0.80 |
|
Random Forest Classifier |
0.88 |
0.89 |
0.89 |
0.89 |
0.94 |
Table 5. Compiled results of cross-validation models
|
Models |
Accuracy |
Precision |
Recall |
F1-Score |
AUC-Score |
|
Logistic Regression |
0.84 |
0.89 |
0.83 |
0.86 |
0.91 |
|
Support Vector Classifier |
0.84 |
0.89 |
0.83 |
0.86 |
0.91 |
|
K-Neighbor Classifier |
0.81 |
0.85 |
0.82 |
0.83 |
0.90 |
|
Decision Tree |
0.86 |
0.89 |
0.87 |
0.88 |
0.92 |
|
Random Forest Classifier |
0.87 |
0.90 |
0.87 |
0.89 |
0.93 |
Figure 2. Accuracy scores of baseline models
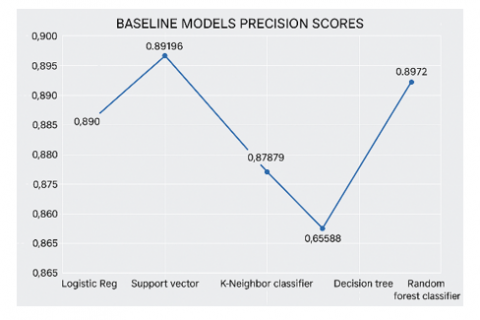
Figure 3. Precision scores of baseline models
Figure 4. Recall scores of baseline models
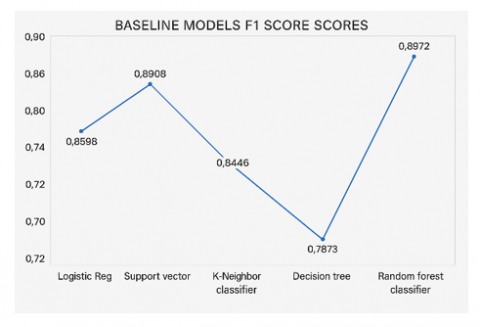
Figure 5. F1 scores of baseline models
Figure 6. AUC scores of baseline models
(a) Logistic regression model confusion matrix
(b) ROC curve of logistic regression model
(c) Support vector classifier confusion matrix
(d) ROC curve of support vector classifier
(e) K-Neighbor model confusion matrix
(f) ROC curve of K-Neighbor model
(g) Decision tree model confusion matrix
(h) ROC curve of decision tree model
(i) Random forest model confusion matrix
(j) ROC curve of random forest model
Figure 7. Heat map and ROC curve of all the cross-validation models
4.1 Model results for cross-validation models
As earlier discussed, the cross-validation models were implemented, Table 5 displays the compiled cross-validation models. The heat map for all the models was implemented and the Figures 5 to 7 show how they fared.
Table 4 provides a summary of the performance metrics for different baseline models in the Compiled Results section. Out of all these models, the decision tree model stands out as the least efficient, with accuracy, precision, recall, F1 score, and AUC score approximately at 79.9%, 86.5%, 77.6%, 81.8%, and 80.3% respectively. On the other hand, the random forest classifier model excels as the best performer, with around 88.0% accuracy, 89.7% precision, 89.7% recall, 89.7% F1 score, and 94.0% AUC score.
Figure 2 displays the accuracy scores comparison among all baseline models, where the Random Forest classifier baseline model had the top accuracy score of 0.88043. Coming in closely behind is the Support Vector classifier scoring 0.86413 for accuracy, with logistic regression achieving a score of 0.84239. The K-Nearest Neighbor classifier followed with 0.82609 accuracy, while the decision trees model had the lowest accuracy score of 0.79891. In terms of precision scores, the Support Vector model performed better than the rest, achieving a score of 0.90196, while Decision trees had the lowest precision at 0.86458. As for the F1 score, Random Forest tops the chart, followed by Logistics regression, which was closely followed by the Support vector model, then K-Neighbor, and lastly, the Decision trees model.
For the cross-validation, stratified k-fold cross-validation and GridSearchCV were used. Recall, that stratified k-fold cross-validation is a strategy that makes use of the idea of stratification, which entails reorganizing the data in such a manner that each fold or group has to contain all the dataset. GridSearchCV, a cross-validation technique, is a useful method for finding the best parameter values within a given grid. It requires the specification of both the model and the parameters. The technique offers precise predictions based on the chosen configuration by identifying the ideal parameter values.
Logistic Regression: Using the GridSearchCV, the logistic regression model has three hyper-parameters, with values {'solver': ['newton-cg', 'lbfgs', 'liblinear'], 'C': [100, 50, 20, 10, 1.0, 0.1, 0.01], 'max_iter': [1000]} respectively. These hyperparameters have a total of 21 combinations. After going through all combinations, an optimal combination of {'C': 20, 'max_iter': 1000, 'solver': 'newton-cg'} was produced. This optimal hyperparameter combination produced the highest performance of the logistic regression model.
Support Vector Classifier: Using the GridSearchCV, the support vector classifier model has three hyper-parameters, with values {'C': [0.1, 1, 10, 20, 50, 100, 200, 350], 'gamma': [1, 0.1, 0.01, 0.001, 0.0001], 'kernel': ['linear']} respectively. These hyperparameters have a total of 40 combinations. After going through all combinations, an optimal combination of {'C': 20, 'gamma': 1, 'kernel': 'linear'} was produced. This optimal hyperparameter combination produced the highest performance of the support vector classifier.
K-Neighbors Classifier: Using the GridSearchCV, the k-neighbor classifier model has two hyper-parameters, with values {'leaf_size': list(range(1,21)), 'n_neighbors': list(range(3,20))} respectively. After going through all possible combinations, an optimal combination of {'leaf_size': 1, 'n_neighbors': 11} was produced. This optimal hyperparameter combination produced the highest performance of the k-neighbors classifier model.
Decision Tree Classifier: Using the GridSearchCV, the decision tree classifier model has two hyper-parameters, with values {'max_depth': list(range(5,21)), 'max_leaf_nodes': list(range(2,100,2))} respectively. After going through all possible combinations, an optimal combination of {'max_depth': 5, 'max_leaf_nodes': 10} was produced. This optimal hyperparameter combination produced the highest performance of the decision tree classifier model.
Random Forest Classifier: Using the GridSearchCV, the random forest classifier model has two hyper-parameters, with values respectively. After going through all possible combinations, an optimal combination of {'max_features': 'log2', 'n_estimators': 32} was produced. This optimal hyperparameter combination produced the highest performance of the random forest classifier model.
5.1 Comparative analysis of machine learning models
When compared to the state-of-the-art models, the performance metrics achieved in this study demonstrate competitive efficacy, particularly in the context of clinical applicability. For instance, while Alotaibi's study reported a Decision Tree accuracy of 93.19% and SVM accuracy of 92.30% [14], the Random Forest model in this study achieved an accuracy of 87.5%, accompanied by a noteworthy AUC score of 93.6%, indicating strong discriminatory power. Notably, the emphasis on ensuring model interpretability and robustness enhances its potential for real-world implementation in clinical settings, an aspect that many existing studies often overlook. this models also exhibit a balanced performance across multiple metrics, with precision and recall rates highlighting the reliability in identifying at-risk patients—a crucial factor in medical decision-making. The dataset utilized in this research is characterized by its diversity, integrating data from multiple sources to enhance the generalizability of the findings across various demographics. While acknowledging the existing limitations, such as potential biases inherent in the dataset, the study lays a solid foundation for future research to explore advanced feature selection techniques and ensemble methods. By emphasizing the integration of cross-validation techniques and aligning with contemporary machine learning practices, this study not only contributes valuable insights but also reinforces the ongoing relevance of machine learning models in improving heart disease detection and patient outcomes.
For these machine learning models to be truly impactful, they must be seamlessly integrated into the clinical decision-making process. This could involve embedding predictive models into electronic health record systems (EHRs) or clinical software platforms that doctors already use. For example, when a patient’s data is entered into the EHR, the system could automatically run predictive models in the background and provide clinicians with risk scores or recommendations for further diagnostic testing or treatment. Additionally, models like Random Forest, which offer insights into feature importance, could help doctors understand which patient characteristics contribute most to the risk of heart disease, thereby enabling more personalized and targeted interventions.
5.2 Comparing performance metrics of all cross-validation models
Table 5 presents a comprehensive comparison of performance metrics across all cross-validation models, including accuracy, precision, recall, F1, and AUC scores.
Accuracy Score: The comparison of accuracy scores across all cross-validation models indicates that the random forest classifier achieves the highest accuracy at approximately 87.5%, followed by the decision tree classifier at 86.9%. Logistic regression and the support vector classifier both attain 84.8%, while the k-nearest neighbor classifier has the lowest accuracy at 81.5%.
Precision Score: The precision scores reveal that the random forest classifier performs best with approximately 90.4%, followed by logistic regression and the support vector classifier, both at 89.9%. The decision tree classifier scores 89.5%, while the k-nearest neighbor classifier has the lowest precision at 85.4%.
Recall Score: A comparison of recall scores highlights that the decision tree and random forest classifiers lead with an equal score of approximately 87.9%. Logistic regression and the support vector classifier both score 83.1%, whereas the k-nearest neighbor classifier records the lowest recall at 82.2%.
F1 Score: The evaluation of F1 scores shows that the random forest classifier achieves the highest score of approximately 89.1%, followed by the decision tree classifier at 88.7%. Logistic regression and the support vector classifier both score 86.4%, while the k-nearest neighbor classifier records the lowest F1 score at 83.8%.
AUC Score: The AUC score comparison demonstrates that the random forest classifier attains the highest score at approximately 93.6%, followed by the decision tree classifier at 92.3%. Logistic regression and the support vector classifier both score 91.5%, whereas the k-nearest neighbor classifier has the lowest AUC score at 90.1%.
From the results of the cross-validation models, the least overall performance model is the k-neighbor classifier, with approximated values of an accuracy score of 81.5%, precision score of 85.4%, recall score of 82.2%, F1 score of 83.8% and AUC score of 90.1%. While, the best overall performance model is the random forest classifier model, with approximated values of: accuracy score of 87.5%, precision score of 90.4%, recall score of 87.9%, F1 score of 89.1%, and AUC score of 93.6%.
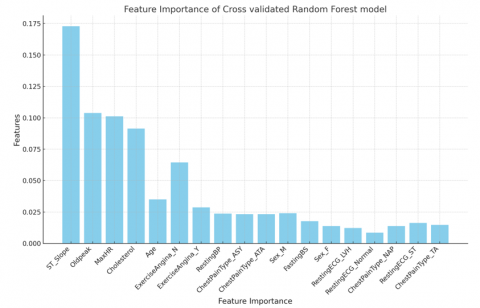
Figure 8. Feature importance of cross-validated random forest classifier model
5.3 Feature importance of optimal model
The idea of feature importance entails scoring input features to determine their importance in a particular model. The relative importance of each attribute is shown by these scores as illustrated in Figure 8. A high value suggests that a particular feature has a greater impact on the model's predictive capabilities to predict a given variable [23].
The feature importance analysis reveals the top five influential features in the dataset: ST_Slope, Oldpeak, MaxHR, Cholesterol, and Age using the random forest classifier, the model with the highest performance. This means that any increase in these features will increase the probability of the model predicting the presence of heart disease. As a result, it is advised that patients with a likelihood of developing heart diseases regularly monitor these features and take steps to reduce the weight of these features and any possibilities of an increase in weight. By doing so, it lowers the risk of developing heart disease. Even if the age element might be unavoidable, proactive management of the other features might assist minimize the risk of heart disease.
5.4 Implication of study finding
One of the primary benefits of employing machine learning algorithms is their ability to facilitate early detection of heart disease, which is crucial for effective intervention. Early identification allows healthcare providers to implement timely treatment strategies, potentially preventing the progression of the disease and reducing the risk of severe complications or mortality. This tailored approach not only improves patient management but also optimizes resource allocation within healthcare systems, as clinicians can prioritize interventions for those at the highest risk.
The implications of this study underscore the transformative potential of machine learning in early heart disease detection and risk stratification. By harnessing these advanced technologies, clinicians can enhance diagnostic accuracy, tailor treatment strategies, and contribute to more efficient healthcare delivery systems. As such, integrating machine learning into routine clinical practice represents a promising avenue for addressing the global burden of heart disease and improving patient care.
Machine learning models can augment existing Clinical Decision Support Systems (CDSS) by providing real-time data analysis and predictive insights. These systems can assist clinicians in interpreting diagnostic results, thereby reducing the potential for misdiagnosis and enhancing the overall quality of care. By integrating machine learning outputs into CDSS, healthcare professionals can receive recommendations for further testing or intervention based on predictive analytics, streamlining the decision-making process.
The research suggested using predictive classification machine learning models to make predictions for heart diseases. The predictive classification machine learning models were trained, executed, and examined on a combined heart disease dataset having 918 records and 18 attributes. using baseline models and cross-validated models (stratified k-fold and GridSearchCV) for the dataset. In conclusion, the results from both the baseline models and cross-validation models, illustrate that the random forest classifier model is more effective than the other models, in the prediction of heart diseases. The evaluation of the selected techniques was measured based on accuracy, precision, recall, f1-score, support, and area under the Receiver Operating Characteristic (ROC) curve.
This study makes several key contributions to the field of heart disease detection using machine learning. First, it employs a larger and more diverse dataset than many previous studies, improving the generalizability of the findings. Second, it advances the state-of-the-art by integrating cross-validation techniques and hyperparameter optimization, which have been underutilized in prior research. Third, this study highlights the importance of model interpretability, ensuring that the developed models can be feasibly integrated into clinical practice. The use of Random Forest not only maximizes predictive performance but also offers valuable insights into feature importance, making it easier for clinicians to trust and adopt machine learning tools in their daily workflows. These advancements significantly enhance the potential for machine learning to transform heart disease detection and management.
In conclusion, adopting the random forest classifier with hyper-parameters and values of {'n_estimators': list(range(5,40,3)), 'max_features': ['log2', 'sqrt']}, produced the best performance of: accuracy score of 87.5%, precision score of 90.4%, recall score of 87.9%, F1 score 89.1% and AUC score of 93.6%.
This indicates that the random forest has a higher ability to classify heart diseases, compared to other models. Hence, it is apparent that the proposed model has higher predictive performance and viability for diagnosing heart abnormalities, and may equally provide a valid medical support.
Nevertheless, the results must be scrutinized by professionals to verify their practicality in clinical research proceedings.
|
TA |
Typical Angina |
|
ATA |
Atypical Angina |
|
NAP |
Non-Anginal Pain |
|
ASY |
Asymptomatic |
|
ST |
ST-T wave abnormalities |
|
LVH |
Possible left ventricular hypertrophy |
|
MaxHR |
Maximum heart rate during physical activities beats per minute |
|
Y |
Yes |
|
N |
No |
|
RestingBP |
Resting Blood Pressure |
|
FastingBS |
Fasting Blood Sugar |
|
RestingECG |
Resting Electrocardiogram |
[1] Li, J.P., Haq, A.U., Din, S.U., Khan, J., Khan, A., Saboor, A. (2020). Heart disease identification method using machine learning classification in e-healthcare. IEEE Access, 8: 107562-107582. https://doi.org/10.1109/ACCESS.2020.3001149
[2] Tsintoni, A., Dimitriou, G., Karatza, A.A. (2020). Nutrition of neonates with congenital heart disease: Existing evidence, conflicts and concerns. The Journal of Maternal-Fetal & Neonatal Medicine, 33(14): 2487-2492. https://doi.org/10.1080/14767058.2018.1548602
[3] Xu, S., Ilyas, I., Little, P.J., Li, H., Kamato, D., Zheng, X., Ma, Q. (2021). Endothelial dysfunction in atherosclerotic cardiovascular diseases and beyond: from mechanism to pharmacotherapies. Pharmacological Reviews, 73(3): 924-967. https://doi.org/10.1124/pharmrev.120.000096
[4] Zhang, Y.B., Chen, C., Pan, X.F., Guo, J., Li, Y., Franco, O.H., Pan, A. (2021). Associations of healthy lifestyle and socioeconomic status with mortality and incident cardiovascular disease: Two prospective cohort studies. Bmj, 373(7): n604. https://doi.org/10.1136/bmj.n604
[5] American Heart Association. (2017). Cardiovascular disease: A costly burden for America projections through 2035. https://www.heart.org/-/media/Files/About-Us/Policy-Research/Fact-Sheets/Public-Health-Advocacy-and-Research/CVD-A-Costly-Burden-for-America-Projections-Through-2035.pdf.
[6] Laslett, L.J., Alagona, P., Clark, B., Drozda, J.P., Saldivar, F., Wilson, S.R., Poe, C., Hart, M. (2012). The worldwide environment of cardiovascular disease: Prevalence, diagnosis, therapy, and policy issues. Journal of the American College of Cardiology, 60(25): S1-S49.
[7] World Health Organization. (2024). The top 10 causes of death. https://www.who.int/news-room/fact-sheets/detail/the-top-10-causes-of-death.
[8] Vogel, B., Acevedo, M., Appelman, Y., Merz, C.N.B., Chieffo, A., Figtree, G.A., Mehran, R. (2021). The Lancet women and cardiovascular disease commission: Reducing the global burden by 2030. The Lancet, 397(10292): 2385-2438. https://doi.org/10.1016/s0140-6736(21)00684-x
[9] Curigliano, G., Lenihan, D., Fradley, M., Ganatra, S., Barac, A., Blaes, A., ESMO Guidelines Committee. (2020). Management of cardiac disease in cancer patients throughout oncological treatment: ESMO consensus recommendations. Annals of Oncology, 31(2): 171-190. https://doi.org/10.1016/j.annonc.2019.10.023
[10] Abdellatif, A., Abdellatef, H., Kanesan, J., Chow, C.O., Chuah, J.H., Gheni, H.M. (2022). An effective heart disease detection and severity level classification model using machine learning and hyperparameter optimization methods. IEEE Access, 10: 79974-79985. https://doi.org/10.1109/ACCESS.2022.3191669
[11] Alalawi, H.H., Alsuwat, M.S. (2021). Detection of cardiovascular disease using machine learning classification models. International Journal of Engineering Research & Technology, 10(7): 151-157. https://doi.org/10.17577/IJERTV10IS070091
[12] Kadhim, M.A., Radhi, A.M. (2023). Heart disease classification using optimized machine learning algorithms. Iraqi Journal for Computer Science and Mathematics, 4(2): 31-42. https://doi.org/10.52866/ijcsm.2023.02.02.004
[13] Kavitha, M., Gnaneswar, G., Dinesh, R., Sai, Y.R., Suraj, R.S. (2021). Heart disease prediction using hybrid machine learning model. In 2021 6th International Conference on Inventive Computation Technologies (ICICT), Coimbatore, India, pp. 1329-1333. https://doi.org/10.1109/ICICT50816.2021.9358597
[14] Alotaibi, F.S. (2019). Implementation of machine learning model to predict heart failure disease. International Journal of Advanced Computer Science and Applications, 10(6): 37. https://doi.org/10.14569/ijacsa.2019.0100637
[15] Kaggle. (2021). Heart Failure Prediction Dataset. https://www.kaggle.com/datasets/fedesoriano/heart-failure-prediction.
[16] Xiong, Z., Cui, Y., Liu, Z., Zhao, Y., Hu, M., Hu, J. (2020). Evaluating explorative prediction power of machine learning algorithms for materials discovery using k-fold forward cross-validation. Computational Materials Science, 171: 109203. https://doi.org/10.1016/j.commatsci.2019.109203
[17] Huang, L., Qin, J., Zhou, Y., Zhu, F., Liu, L., Shao, L. (2023). Normalization techniques in training DNNs: Methodology, analysis and application. IEEE Transactions on Pattern Analysis and Machine Intelligence, 45(8): 10173-10196. https://doi.org/10.1109/tpami.2023.3250241
[18] Azizjon, M., Jumabek, A., Kim, W. (2020). 1D CNN based network intrusion detection with normalization on imbalanced data. In 2020 International Conference on Artificial Intelligence in Information and Communication (ICAIIC), Fukuoka, Japan, pp. 218-224. https://doi.org/10.1109/ICAIIC48513.2020.9064976
[19] Liu, F., Li, G., Zhao, Y., Jin, Z. (2020). Multi-task learning based pre-trained language model for code completion. In Proceedings of the 35th IEEE/ACM International Conference on Automated Software Engineering, Australia, pp. 473-485. https://doi.org/10.1145/3324884.3416591
[20] Marcot, B.G., Hanea, A.M. (2021). What is an optimal value of k in k-fold cross-validation in discrete Bayesian network analysis? Computational Statistics, 36(3): 2009-2031. https://doi.org/10.1007/s00180-020-00999-9
[21] Van der Vliet, R., Selles, R.W., Andrinopoulou, E.R., Nijland, R., Ribbers, G.M., Frens, M.A., Kwakkel, G. (2020). Predicting upper limb motor impairment recovery after stroke: A mixture model. Annals of Neurology, 87(3): 383-393. https://doi.org/10.1002/ana.25679
[22] Aldino, A.A., Sulistiani, H. (2020). Decision tree C4. 5 algorithm for tuition aid grant program classification (Case study: Department of Information System, Universitas Teknokrat Indonesia). Jurnal Ilmiah Edutic: Pendidikan dan Informatika, 7(1): 40-50. https://doi.org/10.21107/edutic.v7i1.8849
[23] Covert, I., Lundberg, S.M., Lee, S.I. (2020). Understanding global feature contributions with additive importance measures. Advances in Neural Information Processing Systems, 33: 17212-17223.