Andi Hardianto*![]() | Marimin
| Marimin![]() | Luky Adrianto
| Luky Adrianto![]() | Idqan Fahmi
| Idqan Fahmi![]()
© 2024 The authors. This article is published by IIETA and is licensed under the CC BY 4.0 license (http://creativecommons.org/licenses/by/4.0/).
OPEN ACCESS
The Unitary State of the Republic of Indonesia (NKRI) is the most prominent nation with an archipelago. Indonesia has an area of 8,300,000 km2, with 16,056 islands registered. Indonesia's coastline reaches 108,000 km2, the second longest in the world. According to that, Indonesia needs well-developed and efficiently managed seaports. The number of seaports, according to the National Port Master Plan, is 636 Ports, of which the government operates 566 Ports as public ports (Non-Commercial Ports). The utilization of this port is shallow because an adequate market or hinterland does not support it. Non-commercial ports managed by the government must innovate to finance port operations and maintenance of port facilities. Innovations and breakthroughs can be made by improving port governance and optimizing the port service business. Improving port business processes to increase the optimization and utilization of ports requires port development strategies that must be formulated precisely. Port development strategies involve the identification of typologies and mapping the level of utilization of non-commercial ports based on typologies; This study uses machine learning methods to answer research objectives.
machine learning, non-commercial port, typology, utilization
The Unitary State of the Republic of Indonesia (NKRI) is the biggest nation with an archipelago. Indonesia has an area of 8,300,000 km2, with 16,056 islands registered. Indonesia's coastline reaches 108,000 km2, the second longest in the world [1]. Geostrategically, Indonesia's location is particularly beneficial, located throughout two oceans (the Pacific Ocean and the Indian Ocean), two continents there are Australia and Asia, and on the world's busiest marine commerce route (the Malacca Strait).
Sea transportation is a part of the National Transportation System, which performs an essential and strategic function of passenger movement, goods, and services domestically and abroad. Sea transportation is also the lifeblood of the economic, social, cultural, defence, and security sectors and a means of increasing and equalizing people's welfare. One of the subsystems of maritime transportation, port are utility support the movement of cargo and people over the sea lane. Furthermore, ports have a big part in advocating for a reliable and efficient maritime transportation system [2]. Being the world's largest archipelago, Indonesia needs well-developed and efficiently managed seaports. A well-managed and efficient sea transportation system is essential for an archipelagic country like Indonesia to increase economic competitiveness and maintain territorial stability [3]. The number of seaports, according to the National Port Master Plan, is 636 Ports, of which the government manages 566 ports that are not cultivated (Non-Commercial Ports). The government contains non-commercial ports to serve the frontier, outermost, innermost, and border areas that other modes of transportation have not reached. The function of non-commercial ports is currently only used for loading and unloading goods for the needs of the surrounding community and used as a docking facility for pioneer ships serving passenger movements, especially in areas where land and air transportation networks are inadequate. The utility of this port is shallow because an adequate market or hinterland does not support it. The available port capacity cannot be utilized optimally due to the low number of ship visits and loading and unloading of goods. The initial purpose of constructing this port is as a sea transportation infrastructure that opens up the isolation of an area. In addition, port development is expected to create new markets and economic growth centres (encouraging trade). Non-commercial ports are the backbone of transportation in connecting areas not yet reached by land and air transportation. The Central Bureau of Statistics records the movement of goods and sea transportation passengers as follows Table 1.
Table 1. Recapitulation of the flow of ship visits, goods, and passengers at non-commercial ports in 2016-2020
|
No. |
Year |
Ship Call (Unit) |
Good (Ton) |
Passenger |
||
|
Unload |
Load |
Depart |
Arrive |
|||
|
1 |
2016 |
550.766 |
111.718.609 |
18.729.847 |
12.472929 |
12.698.589 |
|
2 |
2017 |
522.399 |
112.383.355 |
201.405.385 |
13.244.096 |
13.680.248 |
|
3 |
2018 |
494.885 |
131.914.674 |
235.795.658 |
16.006.497 |
16.041.781 |
|
4 |
2019 |
567.567 |
137.370.216 |
217.371.723 |
17.368.782 |
17.354.024 |
|
5 |
2020 |
417.396 |
116.787.294 |
235.887.310 |
7.626.507 |
7.422.101 |
To maintain the readiness of port operations to serve sea transportation needs, reliable port facilities are always in prime condition. The problems of non-commercial ports currently managed by the government are low utility, low facility readiness and reliability, and low port service income levels due to the limited government budget for managing the port. Comparative data on the budget requirements for port management and non-tax state revenue can be observed in the following Table 2.
Table 2. Comparison of non-commercial port budget requirements and revenues
|
No. |
Year |
Dgst Budget (Trillion) |
Budget for Operation and Maintenance (Trillion) |
Revenue (Trillion) |
Deviation (Trillion) |
|
1 |
2017 |
11,60 |
8,7 |
3,4 |
5,3 |
|
2 |
2018 |
12,84 |
9,6 |
3,7 |
5,9 |
|
3 |
2019 |
9,90 |
7,4 |
3,9 |
3,5 |
|
4 |
2020 |
11,40 |
8,6 |
3,7 |
4,9 |
|
5 |
2021 |
8,90 |
6,68 |
4,16 |
2,5 |
Non-commercial ports managed by the government must innovate to finance port operations and maintenance of port facilities. Innovations and breakthroughs can be made by improving port governance and optimizing the port service business. Improvements in port administration, such transfer of authority, can boost port efficiency [4]. The Port Authority is now more independent and capable of conducting business, as opposed to only performing organizational duties [5]. Many nations have set up structural changes in the port sector, such as industrialization, restructuring, and the division of the administration's port management role. These changes are meant to increase service quality and port efficiency.
It is necessary to raise the non-commercial port utilities' still-poor performance. A number of indicators are used to evaluate port productivity. Port performance indicators enhance port functionality and provide information for assessing port growth [6]. Ha et al. [7] categorizes the port's effectiveness into six groups: customer loyalty, financial abilities intermodal integration, basic operations, auxiliary duties, and environment. Carbone and Martino [8] describe managing sea transportation logistics and it is essential to consider its multifaceted nature. It connects with ecological, societal, financial, and organizational variables and includes a solution-oriented port's ability to maximize its current resources and generate more income will be impacted by its increased efficiency.
The complexity of the parameters for increasing port productivity cannot be resolved by making a single decision. Because of its nature as an archipelagic country with natural wealth and a population spread over various islands, sea transportation is the most effective means of serving passengers and goods. A large number of ports and a limited budget are problems that affect the performance of non-commercial port services. In its operations, non-commercial ports only serve pioneer ships scheduled to stop at the port based on the route determined by the Ministry of Transportation. Apart from the pioneer ship service, the port is only used to berth fishing boats and cargo ships that contain the local population's basic needs. This port function can be optimized by innovating or expanding the port business and improving port governance. To optimize and increase the utilization of ports from different market potentials, evaluating the business processes that have been running is necessary. The continuity of port services in Indonesia needs business process evaluation to earn adequate income and serve the public interest. The current port business process is for ships to come and dock at the pier, unload goods, and load goods if a later ship leaves the dock to sail back. Indonesia already has a seaport classification system in a hierarchy of main ports, collectors, regional feeders, and local feeders. The port hierarchy is viewed from several aspects, such as the service scale, range of services, transfer volume cargo, port facilities, and service capacity. Based on the existing conditions, several ports did not meet the criteria for the port hierarchy as previously determined. Of course, it impacts the non-optimization of operational processes and the construction and development of existing ports. Too close the distance between ports in certain areas is less effective because of the gate of a site, and the cargo that enters or exits will divide into two regions with more operational costs. This grouping overrides the unique characteristics of each port because each port has various aspects. As an archipelagic country, Indonesia requires port facilities as supporting infrastructure for transportation, movement of goods, and movement of passengers. This causes the number of ports to be large and spread out. Each port has different characteristics and roles, so it is necessary to cluster and classify them to make management more effortless. Port classification and clustering are important because they help in mapping existing maritime infrastructure and resources, enabling government and industry stakeholders to allocate resources efficiently for port development. By understanding the characteristics and role of each port in a regional or global context, classification helps in more efficient transportation and logistics planning, increases port competitiveness, and stimulates economic growth through increased trade and investment activity. In addition, clustering also enables the identification of environmental and security risks associated with port operations, enabling the development of strategies to reduce negative impacts on the environment and strengthen operational security. Thus, port classification and clustering are essential for regional economic growth and achieving environmentally sustainable and efficient maritime infrastructure. This research aims to map the utilization level of non-commercial ports based on typology port operations using the K-Means Clustering type clustering method.
A port is essentially an area designated as an arrival point for the loading and unloading marine freight [9]. Seaports are the most practical option for loading and unloading watercraft, ships, ferries, and other terminal activities. Ports are always near the water to allow interaction between land and water transportation activities and accommodate vessels and other water vehicles [10]. Ports are business and production facilities that contribute to a country's socioeconomic development, influenced by adjustment in society and economy characterized by required expansion in the nations through nation-state involvement to improvements in logistics, economics, organizations, and the setting of commerce liberalization technology. The power and size of modern ships obscure their early duty. The port enables freights and passengers to move from one kind of conveyance to another, from a vessel to land transportation or to the other way [11]. Seaports as vital logistical hubs for global trade. As a result, because all maritime enterprises must pass via their facilities, where the method of transportation is changed from water to land, seaports are crucial to the logistics chain [12]. The seaport serves as a gateway for connecting areas and nations as one of the maritime transportation infrastructures. Indonesia's port infrastructure is the most critical in defining the country's economic path. Indonesia depends heavily on port reliability to enable upward mobility and inter-island trade because Indonesia is an archipelagic country [13]. Ports are territories connected by a waterway that connects to the ocean's surface, sea, or stream as entities. They have the necessary infrastructure and technological capabilities to handle the cargo type. Its primary objective is to give various levels of protection to ships, allowing goods transporting from one mode of transportation to another [14]. A Port is also defined as maritime infrastructure that provides access to seagoing ships [15].
The port is one of the most essential trade networks in the commerce process for inter-island and worldwide trade. Harbor is a place to carry out activities of moving goods from one place to another that transporting via sea transportation routes, where the process originates from origin to destination. The function of the harbour can be mentioned as a meeting place (interface), gateway (gateway), industrial entity (industry entity), and a meeting place for various modes of transportation. Four port functions consist of Gateways; The port is called the point of entry because it is an official area for trade activity. Customs and quarantine procedures must be followed at the points of entry and exit of goods, so a process has been arranged at the port. Link (chain), The presence of a seaport essentially promotes cargo transfer between forms of land transportation (inland transport) and modes of marine transportation (maritime transport), distributing products as fast and efficiently as feasible in and out of customs areas. Gateway is a country or location because a ship can enter a country/region through the port of the country or region concerned. The interface is meant by interface here: in the flow, the distribution of goods inevitably has to pass repeatedly across the port area, once at the points for loading and once at the unloading ports.
If the port is held well, this industry entity will expand and develop additional commercial categories, transforming the port region into an industrial port zone, which will grow shipping companies engaged in the field, agency, warehousing, trucking, etc. The port role has progressed from the conventional procedure of assisting as an additional detailed link comprehensive supplies network as part of global distribution systems, with transportation and loading activities [16]. Roa Perera et al. [14] divides port criteria into several types based on the basin's depth and the cargo amount. Their research defines the seven port types: Port Terminal, Pier, Deepwater Seaport, Harbor, Off-shore, Canal, and River Port, according to the amount of cargo. Fonseca et al. [17] define ports as minor, load points, and regional and international pivot ports. These ports are categorized based on their position, hinterland, and capacity.
Various countries implemented different categorization schemes in port segregation and have been combined to generate the widely known port classification schemes. The various categorization standards utilized by numerous nations in port segmentation were merged to create the widely known port classification frameworks. For example, Ding et al. [18] classified Ireland ports as small, medium, and large ports performing yearly freight volumes of over one million tonnes, medium-sized harbours managing every year shipment amounts of between one hundred and fifty thousand and one million tonnes, and tiny ports handling annual cargo volumes of less than one hundred and fifty thousand tonnes [18]. In contrast, administrative significance was used to classify India's ports as significant, intermediate, and small. Temporal cargo volume changes were used instead, providing a consistent basis for several applications. The administration obtains port traffic data and plans, designs, and operates port infrastructure [19]. Based on the Department of Transport [20] the major ports in the United Kingdom handle at least one million tonnes of cargo annually, while the minor ports handle less than one million tonnes of cargo annually. The EU statistics taxonomy categorizes port sizes based on the port area's dimensions, primary activities, and port company operations. Small ports manage less than or equal to 10 million tons of cargo handled yearly, while medium-sized ports manage more than ten and up to 50 million tons of freight annually [21]. Ports must carefully analyze the governance model best suited to their unique needs and circumstances in order to maximize performance, and they must periodically review and evaluate their governance structures to make sure they successfully support the port's operations [22]. The World Bank [23] states that port management responsibilities can be modeled in four different ways. The management model is different from labor, asset ownership, and port service delivery.
Indonesian National Port System is a system that includes responsibilities, operations, categories, and structure, a national port strategy plan, and port sites, as well as intra- and intermodal connectivity and collaboration with various sectors. It describes port development based on economic area, geography, geographic region comparative advantage, and natural conditions. National Port Master Plan grouping ports into Main Ports, Collecting Ports, and Feeder Ports. Main Port is a port whose primary purpose is to handle activities such as national and global maritime transportation, the transhipment of national and worldwide marine freight in large numbers, as the starting point of travellers and commodities, and also for ferry transport with regional area service coverage. Collector Port is a port that's primary objective is to provide local sea shipping operations, such as transhipment for medium local movement and as the origin of persons or commodities, as well as ferry transport with a regional service area. A feeder port is primarily responsible for handling national maritime transport and inadequate local maritime transshipments, is a feeder for the main port and collection port, and serves as the entry point of people and goods alongside other transit intersections with service coverage within the province. Indonesian ports are divided into commercial and non-commercial ports based on how they are managed. Commercial ports are operated by the private sector, namely port business entities, while non-commercial ports are governed by the government, in this case, the Directorate General of Sea Transportation.
It is necessary to raise the non-commercial port utilities still-poor performance. Port performance is evaluated using several types of criteria. Vaggelas [24] lays established standards for evaluating port performance, such as expenses, operation time, reliability of infrastructure, connectivity, and access, and ability to operate when needed. The primary elements that serve as criteria for service users in choosing a port are satisfaction, flexibility, price, and service time. The results of port performance measurements can be used as a guide in increasing port competitiveness [25]. Mickiene and Valioniene [26] assesses the effectiveness of government-owned ports and the national economy's effects on port operations. Today, ports serve as the hubs of international trade, provide value-added services to various stakeholders, and serve as meeting places for carriers and shippers. So, the idea of port performance has evolved significantly over time. The methods for evaluating port performance were divided into three categories by Bichou [27] performance measurement, economic implications, efficient frontier approach, and technology capability. One of these ways highlighted the port's service performance. Many scholars believe that the infrastructure's length, design, and upkeep are essential in determining the port's infrastructure and superstructure's quality.
Earlier studies concentrated on port revenue and effectiveness operational issues since they substantially impact a port's competitiveness [28]. The average performance at terminals/berths was utilized by Cabral and de Sousa Ramos [28] to evaluate the performance of Brazilian seaports. Rozar et al. [29] make their selection based on competitiveness criteria like improving the efficiency of material handling facilities, improving flexibility (loading), lowering the cost of loading and unloading, improving labour productivity, improving the location of stockpiles, increasing trucking productivity, reducing the lead time for loading, enhancing service quality, and lowering the processing time for loading and unloading.
According to the time ship services are provided while in port, the port's efficiency can be utilized to gauge the service offered to users (ships and goods). The high port performance demonstrates the port's capacity to deliver good services. There is a close relationship between port efficiency and other port functioning parameters. Thus, the performance of the port affects its efficacy [30]. In realizing a sustainable port, port performance assessment is not limited to its productivity but must consider social and environmental factors (contribution to the surrounding community). Port performance indicators are significant for port authorities. They can be utilized to enhance port services and act as a priority foundation for future port expansion planning [7].
Data mining is the procedure of obtaining information from enormous quantities of data. A method called clustering divides data into groupings so that data in a group has a uniform type. With this technique, data can be grouped or class clustered, where objects with something in the joint can be compared to other things. Classification algorithms in data mining are capable of managing massive amounts of data. It can form hypotheses about categorized class names, arrange information based on training sets and class labels, and identify newly available information. The K-means algorithm is an algorithm that can classify what types and groups of data it is based on the centroid point closest to the data information. This K-means algorithm aims to group data by striving for similarity or similarity of information data in clusters. Rozar et al. [29] apply cluster analysis to evaluate the level of competition in Malaysian ports and divide 18 Malaysian ports into two distinct classes based on various performance metrics. Azzam et al. [31] determine a new port category system based on port qualities and features from a strategic standpoint. The K-means clustering technique was used to carry out the port classification process at many stages. Twenty-five characteristics with 62 elements were found and used to evaluate and categorize ports worldwide. Classification seeks to anticipate the target class as accurately as possible. During training, the classification technique discovers the relationship between the supplied attribute and the outcome characteristic to develop a model. Data mining scenarios generate a lot of information. The decision tree method works great if the data collection is well-categorized and has few nodes. Each path in a decision tree, beginning at the root, is characterized by a data-separating process until a Boolean value is created at the next branch point. It is a stacked arrangement of information connections via linkages and nodes. When using relations for the organization, nodes reflect purposes. A decision tree is a technique for supervised machine learning for problem-solving in classification and regression. Iteratively, decision trees are constructed by applying split criteria at each node to divide the training records into subsets with an outcome variable. Ghiasi et al. [32] developed a decision tree to classify models for medical diagnosis. Tangirala [33] applied the Decision Tree Classifier Algorithm to assess the impact of the GINI Index and Information gained on classification. Kang er al. [34] use a red tide surveillance approach utilizing decision tree classification to more correctly identify the red wave prevalence area.
Orange is a data mining software that is organized hierarchically. Lower-level operations, such as chance examination, data screening, and attribute assessment, are incorporated into more complicated algorithms, such as classification tree learning techniques. Data Analysis and preparation includes data cleaning and selection, inference, feature manipulation (discretization, continuation, normalization, scaling, and scoring), choosing attributes, and categorization using different supervised machine learning algorithms (tree, forest, instance-based, and Bayesian approaches), and regression with lasso regression Orange's script library serves as the foundation for the company's visual programming platform, which includes interface components engaging data visualization using graphical users [35]. Machine learning, used in data science, is a computer programming process that learns from previous experiences. Machine learning aims to create algorithms for summation that learn directly or indirectly from data. Machine learning algorithms may predict, classify, and make decisions, among other things. Machine learning is an artificial intelligence subject study that has grown in popularity important aspect of data science. Orange's research will be used as part of the data mining process, with the primary objective being to obtain the most efficient and effective design determined by the algorithm's examination results. Machine learning starts with constant training data as input. Clustering ports using machine learning techniques can significantly enhance productivity and efficiency in port operations. By leveraging advanced algorithms, such as k-means clustering or hierarchical clustering, on vast datasets encompassing port characteristics, operational metrics, and environmental factors, stakeholders can identify patterns and relationships among ports that were previously obscured. This data-driven approach allows for the creation of clusters based on similarities in infrastructure, cargo handling capabilities, geographical location, and other relevant attributes. Once ports are grouped into clusters, decision-makers can gain valuable insights into best practices, performance benchmarks, and areas for improvement within each cluster. By analyzing cluster-specific trends and patterns, port authorities and operators can tailor their strategies and investments to address specific needs and challenges, thereby optimizing resource allocation and enhancing operational efficiency [36]. Port clustering aims to minimize competition by promoting collaboration, specialization, and synergy among neighboring ports. Instead of viewing nearby ports solely as competitors, clustering encourages them to cooperate and complement each other's strengths, thereby maximizing collective efficiency and effectiveness. By clustering ports based on shared attributes, such as geographic proximity, market specialization, or infrastructure connectivity, stakeholders can identify opportunities for collaboration and resource-sharing that benefit all ports within the cluster. Port clustering minimizes competition is by promoting specialization and differentiation among ports within the same cluster. Rather than all ports competing for the same types of cargo or market segments, clustering allows each port to focus on its unique strengths and competitive advantages. As an illustration, a specific port within a cluster might focus on managing containerized cargo, as one focuses on bulk commodities or liquid chemicals. This specialization reduces direct competition among ports within the cluster and enables them to capture a larger share of their respective markets [37].
This study aims to classify port types based on their utility level. Classification using the decision tree method and grouping based on port hierarchy using K-means cluster with the Orange application. Clustering Stage in K-Means as follow:
(1) Ascertain the desired number of clusters, k (the value is arbitrary).
(2) Generate k arbitrary values regarding the first cluster center (axis).
(3) Calculate the separation between every centroid and the input data using the Euclidean distance formula until the closest distance of each data to the centroid is found. The following is the Euclidian Distance equation:
$d(x i, \mu j)=\sqrt{\Sigma(x i-\mu j)^2}$ (1)
(4) Filter the data according to how close each one is to the centroid (the shortest distance).
(5) Revise the figure formula is used to calculate the new centroid value from the cluster's average.
$\mu j(t+1)=\frac{1}{N s j} \Sigma j \in s j^{x j}$ (2)
(6) Continue doing steps 3 through 5 until none of the cluster members are different. Meanwhile, the decision tree algorithm is as follows:
Basically, we need two mathematical tools to implement the complete decision tree algorithm:
(1) Entropy
A basic principle in the concept of information, it quantifies the significance of data in relation to its volume. Consider x to be our training set, which consists of both positive and negative samples. In this classification, x's entropy is:
$H~\left( x \right)=-p+log2~p+-p-log2~p$ (3)
(2) Information gain
Similar ideas are used within knowledge theory, where the initial sample entropy is obtained in order to calculate the information yield for every feature. For training set x and its attribute y, the Information Gain formula is:
$G~\left( x,y \right)=H~\left( x \right)-\underset{i\in value~\left( y \right)}{\overset{{}}{\mathop \sum }}\,|\frac{\text{ }\!\!\Delta\!\!\text{ }yi}{\text{ }\!\!\Delta\!\!\text{ }y}|~H\left( yi \right)$ (4)
3.1 Stage of research method
The Orange application is software that can use as a tool to measure air pollution, which is open source. Orange provides programming visuals based on collecting, interpreting, machine learning, and data presentation components. The Orange app was developed in 1996 at Ljubljana University and the Jožef Stefan Institute. The research methodology is systematic steps to be carried out during the research. Stages of the research method, as seen in the Figure 1.
Figure 1. Stage of research method
3.2 Port utility data index dataset
The dataset taken for the data mining process is taken from the Directorate General of Sea Transportation. Port data collected includes port name, port hierarchy, port facilities, port operations, port budget and revenue, and port coordinates. Out of 350 non-commercial ports, 200 ports have complete data. The data is incomplete in other ports, and some ports are under construction with unlimited data. The data is preliminary for other ports; some ports are under construction.
3.3 Data preparation
Data preparation is done through a cleaning process data (cleaning). The data cleansing process is done to omit inconsistent data or remove unnecessary attributes. Data Checking (Cleaning Process Data) In this research, relationships are sought several attributes of existing data. Because not all tables are used so it is necessary cleaning of the data to be processed is carried out really relevant to that needed. why data needs to be cleaned before processing? This happens because usually the data that will not be used yet, the reasons include:
(a) Incomplete: lack of values attribute or other specified attributes.
(b) Noisy: contains errors or values deviant outliers that don't consistent with other data.
(c) Inconsistent: internal discrepancy use of codes or names.Here good data quality is based on good decisions and data warehouse requires data quality integration consistent.
At this stage the data cleaning process using two tools, namely, Microsoft Excell and Orange. The data attribute shown in Table 3.
Table 3. The data attribute
|
No. |
Attribute |
Type |
|
1 |
Port Name |
Text |
|
2 |
Port Hierarchy |
Text |
|
3 |
Port Code |
Text |
|
4 |
Depth (- MLWS) |
Numeric |
|
5 |
Capacity (DWT) |
Numeric |
|
6 |
Length of Jetty (M) |
Numeric |
|
7 |
Warehouse (M2) |
Numeric |
|
8 |
Open yard (M2) |
Numeric |
|
9 |
Ship Call |
Numeric |
|
10 |
Outbound Passenger |
Numeric |
|
11 |
Inbound Passenger |
Numeric |
|
12 |
Amount Of Unloading Cargo |
Numeric |
|
13 |
Amount Of Loading Cargo |
Numeric |
|
14 |
Budget |
Numeric |
|
15 |
Revenue |
Numeric |
|
16 |
Human Resources |
Numeric |
|
17 |
Latitude |
Numeric |
|
18 |
Longitude |
Numeric |
|
19 |
Revenue Criteria |
Category |
When considering variables for clustering ports, it's important to include a diverse range of factors that capture the multifaceted nature of port operations, characteristics, and contexts. By incorporating these diverse data variables, stakeholders can perform comprehensive analyses to identify clusters of ports with similar characteristics, operational profiles, and competitive advantages. This, in turn, can inform strategic decision-making, resource allocation, and collaborative initiatives. The data used is non-commercial port data in the form of loading and unloading, facilities and income for the last 5 years. Here's a list of potential data variables for clustering ports.
3.4 Preprocess
Preprocessing is frequently required before data mining. Data preprocessing refers to the techniques used to prepare raw data for further processing. Preparing information for data mining aims to format data more straight forwardly and helpfully for user needs, with indicators, and produce greater precision in the outcomes. Reduce calculating the time required for complex issues, and make data values less substantial lacking altering the data it contains. Data preprocessing explain processes that handle raw data in order to prepare subsequent procedural processes. There are several methods used for preprocessing such as:
(a) Sampling, selecting a subset representative of the big data population;
(b) Discretization, a component for information elimination, but it has significant value on its own, particularly for figures;
(c) Remove missing;
(d) Continuize;
(e) Impute;
(f) Feature selection.
During the data preprocessing process, there were no missing values in the data, so this was only done data selection only. Missing values in instance data will disrupt the classification process. Some classification models cannot be processed because there are missing data and values. At this stage, the researcher tries to create a process of classification rules on data mining using decision trees. The algorithm, the classification will use that data to generate knowledge. The knowledge to be generated Classification is to classify ports according to the revenue. The researcher takes the attribute port operation, budget, and revenue in this process. The initial stage to the end of the classification process is with a decision tree using Orange. The clustering process will be performed on Orange, the process of grouping data to determine the High, Medium, and Small Income Ports category.
3.5 Data mining
At this stage, the researcher tries to create a process of classification rules on data mining using decision trees. The algorithm, the classification will use that data to generate knowledge. The knowledge to be generated Classification is to classify ports according to the revenue. The researcher takes the attribute port operation, budget, and revenue in this process. The initial stage to the end of the classification process is with a decision tree using Orange. The clustering process will be performed on Orange, the process of grouping data to determine the High, Medium, and Small Income Ports category.
With port data, ports will be grouped with high, medium, and low incomes. Grouping based on attributes in the form of parameters such as facility, operational, and revenue data. These attributes will be processed through Orange using a k-means algorithm to generate clusters. Testing the K-Means Algorithm on Orange, the testing process is carried out without changing the Orange app. As for the tests carried out, namely by using the k-means algorithm. Following the process is carried out in Figure 2.
Figure 2. Widget flow view on Orange application
The results of the process of testing the accuracy of the tree algorithm using the "Test and Score" in the Orange application obtained an accuracy of 95.5%, F1 Score of 95.4%, precision of 95.5%, recall of 95.5%, specificity of 87.3%, and get AUC value (Area Under Curve) of 96.1%. The AUC value is a calculated value of the performance of a classification data index. The more significant the AUC value, the better the performance index data used. A significant AUC value of 96.1% indicates that the index performance classification data includes Good Classification. The result of widget test and score can be seen in Figure 3.
Figure 3. Result of widget test and score
Based on the data mining process flow using Orange software, the data mining process in this study is the first to determine the training data on the dataset used where the training data used in this study are as many as 202 port data. Next is to enter the algorithm used in data mining processing, where using the decision tree algorithm is marked with the widget "tree". Views on the widget "tree" can be seen in the Figure 4.
Figure 4. Widget tree
Figure 5. Result of decision tree
Based on the Figure 5, from 201 classified port data with the decision tree algorithm, there are 100 ports equal, with 49.8 % having high revenue. Ports categorized as low income are 101 ports or 50.2 % of 107 ports, with increased revenue. 93.5% of them require an optimization strategy, while 6.5% require development because of insufficient facilities. Then from 101 low-income ports, 83.5% needed promotion because the facilities were sufficient, but ship visits were not significant. 11 Ports with low-income categories and inadequate facilities also require a merger with their nearest port. Because if it is developed, it will increase investment costs which may not necessarily be offset by increased income.
4.1 Clustering
The K-Means technique is a non-hierarchical grouping approach that can divide existing data into one or more categories. This approach divides data sets into groups, producing power with the qualities in 1 cluster. In contrast, Image segmentation means partitioning the images into various groups or groups that feature the same or have some similarities. K-means is a method of grouping the image partitions into groups such that at least one part of the cluster contains an image with the central area from the used part. K-Means Algorithm Process, the stages in the clustering algorithm process use the K-Means method to choose the number of clusters k. There are many ways to initialize inner cluster centres, but the primary choice at the cluster level is random. Allocate all data/objects into the nearest cluster. K-Means clustering widget design using Orange Data Mining as shown in Figure 6.
Figure 6. Widget flow view of K-mean clustering on Orange application
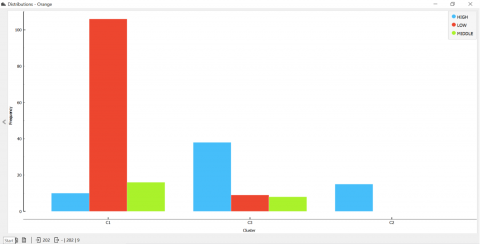
Figure 7 indicated the total distribution of port clusters based on their utility. Cluster 1 has three ports with a high utility category, 61 with low utility, and 5 with medium utility. Cluster 2 has four ports with high productivity, 17 medium, and 45 with low utility. Cluster 3 consists of 58 with high utility, one port is categorized as a port with low productivity, and two ports have medium productivity. If further analyzed, it can be concluded that low-productivity ports inhabit Cluster 1, cluster 2 groups ports with medium utility, and Cluster 3 is a collection of ports with high utility. The distribution of port cluster strategy can be seen in Figure 8.
Figure 7. The distribution of port clusters based on their utility
Figure 8. The distribution of port clusters based on the development strategy
The data obtained will be inputted and analyzed based on objects. Then it will be connected using the appropriate widget with what will be used and needed in this study. At the selection, stage will select the required data. The data is then adjusted as needed. Data in this research consists of 19 attributes with 201 data records. The sets of data preprocessing in this study use widgets preprocessing data by Normalizing features on Orange tools and then selecting Normalize to the interval [-1,1]. Table data is the result of displaying which attributes are set to be displayed as output in the select column widget. A series of port data processing uses the K-Means algorithm with the Orange application. Based on the K-Means Clustering results displayed in the scatter plot widget, 3 clusters are obtained. The distribution of ports in the cluster can be seen in the following Figure 9.
Figure 9. Typology according to the national port master plan
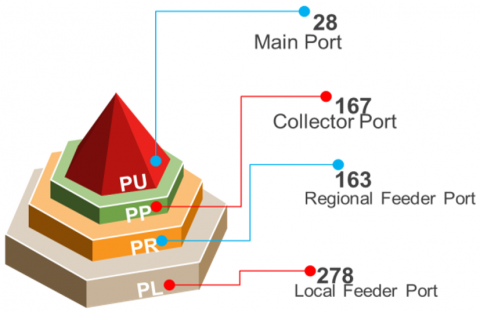
The Indonesian National Port Order is a port system responsible for operations, kinds, port structures, the National Port Master Plan, port sites, and within and intermodal connectivity and relationships with various stakeholders. National Port Plan is a national port framework that specifies port development based on socioeconomic region, geographical location, competitive edge, and environmental variables. The port has a role as the nodes in the transport network corresponding to their hierarchy, The gateway for economic activity, a place of training for changing modes of transportation, supporting industrial or trading activities, loading point of freight distribution, fabrication, and consolidation, and realizing the archipelagic outlook and state sovereignty. The Indonesian port is classified into Main port, Collector Port, and Feeder Port. Based on this classification ports in Indonesia are divided into 28 main ports, 164 collector ports, 166 regional feeder ports, and 278 local feeder ports.
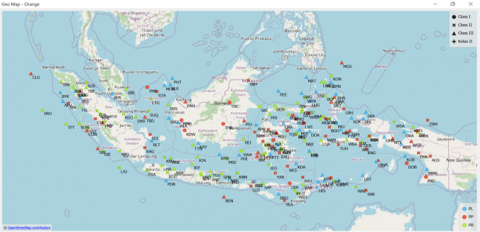
However, the classification standards are arranged in a hierarchical form. Where the ports that are included in the highest hierarchy will be has a high level of each attribute/characteristic compared to other ports the hierarchy is classified as being below the port. Standard model of grouping his type of approach does have the advantage of clear and applicable standards to almost every port. However, the weakness is that it ignores characteristics unique to each port or does not open up space for grouping by using other variables/indicators. Because it may port with a hierarchy below may have higher attributes on other indicators or variables compared with ports included in the high hierarchy. Given that there is a gap in Standardization of port classification and research related to classification have not received attention which is intense in research themes around ports, to fill this gap The clustering method can be used to further group ports comprehensive and detailed. One of the advantages of the deep clustering method port grouping, namely this method can accommodate the need for grouping ports multi-dimensionally. With the advantage of being multi-dimensional like this, the indicators/variables used in grouping can be changed. In Figure 10, a clear comparison shows that the results of the existing typology are overlaid with the new typology. There is a port that has a high class according to the old port typology, but after evaluation it turns out that its utility is low and falls into the Class III category according to the Non-Commercial Port New Tipology. The distribution can be seen in Figures 10 and 11. The Classification of ports according to the new criteria shown in Table 4.
Figure 10. The distribution of ports in the cluster
Figure 11. The map of comparation existing port typology with new typology
Table 4. New port typology
|
Tipology |
Revenue |
Ship Call |
Utility |
|
Class I |
> 5 B |
> 2000 call |
>50.000 Ton |
|
Class II |
500 M - 5 B |
500-2000 call |
25.000 - 50.000 Ton |
|
Class III |
0 s/d 500 M |
0-500 call |
0 - 25.000 Ton |
In the context of port typology mapping in Indonesia, several ports can have combined characteristics depending on economic development, infrastructure and local development strategies. Therefore, the government and relevant stakeholders need to deeply understand each port's role and function to plan sustainable and coordinated development. Overall, port typology mapping in Indonesia creates a diverse picture of the role of each port in the national logistics and transportation ecosystem, from significant ports that are major trade gateways to local ports that serve remote communities. Each port impacts economic growth, distribution of goods, and inter-island connectivity. By understanding these differences, the government and stakeholders can develop appropriate strategies to increase efficiency, competitiveness and the positive impact of each port type in supporting sustainable development throughout Indonesia. The distribution of non-commercial port typologies in Indonesia includes 25% of non-commercial ports located in the western part of Indonesia, namely Sumatra Island, Java Island, West Kalimantan Province and Central Kalimantan Province. The number of non-commercial ports in central Indonesia is 42% spread across Bali, West Nusa Tenggara and East Nusa Tenggara. Meanwhile, the % of non-commercial ports in eastern Indonesia, including Maluku and Papua, is 33%.
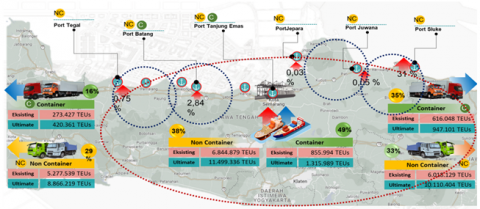
Figure 12. Port hinterland competition
As can be seen in Figure 12, the capacity of Tanjung Emas Port has reached 855.994 TEUs, currently only around 57% is filled. The total generation in the Central Java hinterland area reached 1.3 million TEUs. Meanwhile, for non-containers, the results of the real demand survey also show that total non-container demand is still below the capacity of the ports on the north coast of Central Java. Analyzing port hinterland competition through clustering entails a comprehensive examination of various factors influencing the interplay between ports and their surrounding regions. Hinterland competition is a critical aspect of port management and maritime logistics, as it directly impacts a port's market share, operational efficiency, and overall competitiveness. By applying clustering techniques to understand hinterland competition, stakeholders can gain valuable insights into the distinct characteristics and dynamics of different port regions, thereby enabling more informed decision-making and strategic planning.
Clustering, in the context of port hinterland competition, involves grouping ports and their respective hinterlands based on shared attributes, such as geographic location, market specialization, infrastructure connectivity, and economic drivers. By categorizing ports into clusters, analysts can identify similarities and differences among competing port regions, facilitating a deeper understanding of their competitive strengths and weaknesses. This approach allows stakeholders to assess the relative attractiveness of different port hinterlands, identify emerging trends, and anticipate future challenges and opportunities.
One key aspect of clustering port hinterland competition is the recognition of regional variations in market demand, supply chain dynamics, and logistics infrastructure. Different port clusters may cater to distinct market segments, such as containerized cargo, bulk commodities, or specialized goods. For example, ports located in proximity to major manufacturing centers may specialize in handling containerized exports, while ports situated near resource-rich areas may focus on bulk cargo shipments. By clustering ports based on their market specialization, stakeholders can tailor their strategies to capitalize on unique market opportunities and competitive advantages. Furthermore, clustering enables stakeholders to assess the effectiveness of transport and logistics networks in connecting ports to their hinterlands. Ports within the same cluster may share similar transportation corridors, distribution channels, and multimodal infrastructure, influencing their accessibility and competitiveness. For instance, ports located along well-established trade routes or connected to efficient rail and road networks may have a competitive edge over ports with limited transportation connectivity. By clustering ports based on their transportation accessibility and connectivity, stakeholders can identify infrastructure gaps and investment priorities to enhance regional connectivity and competitiveness. In addition to market specialization and transportation connectivity, clustering port hinterland competition also involves considering factors such as port governance, regulatory frameworks, and institutional capacities. Ports within the same cluster may face similar regulatory environments, legal frameworks, and administrative procedures, shaping their operational flexibility and regulatory compliance. Moreover, clusters may exhibit varying degrees of institutional coordination and collaboration among port authorities, government agencies, and private sector stakeholders, influencing their ability to adjust shifting market dynamics and regulatory requirements. By clustering ports based on their governance structures and institutional capacities, stakeholders can identify opportunities for policy harmonization, regulatory reform, and collaborative initiatives to improve port competitiveness and efficiency. This holistic approach enables stakeholders to navigate the challenges and opportunities of port hinterland competition effectively, fostering sustainable growth, and prosperity in maritime trade and logistics.
The results of this research are expected to assist the government in creating port clusters in planning port development and preparing ship network plans. Typology of non-commercial ports based on the criteria of utility, income and number of ship visits, are classified as Class I ports with criteria for annual revenue of more than 5 (five) billion rupiah, ship visits of more than 2000 calls per year and utilities of more than 50,000 tons per year. For class II ports, the criteria for annual income are 500 (five hundred) million to 5 (five) billion rupiah, ship visits are more than 500 to 2,000 calls per year, and utilities are more than 25,000 to 50,000 tons per year. Meanwhile, class III ports have annual revenues of less than 500 (five hundred) million rupiah, ship visits of less than 500 calls per year, and utilities of less than 25,000 tons annually. Mapping the utility level of non-commercial ports both by cluster and classification, it was found that of the 202 ports studied, 55.94% (113 ports) had low utility or productivity, 11.88% (24 ports) were in the medium productivity port category, and 32.18% (65 ports) are classified as high productivity ports. In addition, classification leads to port optimization. Port with low utility but adequate facilities required promotional steps. This step includes informing the port capacity business owners who need port facilities, synergizing with the regional government regarding the need for food to be transported by sea, and working with shipping agents to direct ships to the port. For ports classified as ports with inadequate facilities, it is necessary to develop port facilities under the port master plan. A port cluster aims to increase ports' efficiency, productivity, and competitiveness in a particular area. By combining port resources and facilities in one coordinated group, the ports can support each other and benefit from mutual benefits. The port cluster also aims to improve connectivity and integration between ports and other transportation networks, thereby increasing the efficiency of the distribution of goods and passengers. In addition, by forming a port cluster, the government and other stakeholders can more easily coordinate infrastructure development, safety standards, and regulations across the ports in the group. The port cluster can reduce investment costs and improve overall operational security. The ultimate goal of a port cluster is to create an ecosystem that will enable ports in the region to function as efficient logistics centres, compete with international ports, and contribute to regional and national economic growth. Thus, the port cluster is expected to increase economic growth, create jobs, and provide social and economic benefits to the surrounding communities. This research is limited to the classification of non-commercial ports, meaning ports operated by the government. It can be further investigated to identify port optimization strategies from strategies that can be realized in accurate action plans to optimize ports. Port clustering is limited to the port utility level, where future research can expand the clustering criteria, for example, from income level, sustainable operation level, and level of pollution resulting. In the future, implementing national ports will face many challenges of extraordinarily rapid changes from global and national strategic developments. Policies for implementing national ports in the future must be adaptive to the development of these challenges and expect it to be possible to compete and make the proper contribution to the growth and equity of national development in all fields. At this time, the world is beginning the fourth industrial revolution. Which significantly boosts port service efficiency through smart port. In the next 10-20 years, the face of modern ports will change a lot compared to current conditions, where the role of robots working through sophisticated and integrated computing systems will become increasingly dominant. The industrial revolution will be a big challenge for ports in Indonesia, which are still operating with old technology (obsolete) and relying on human resources with service systems that have not been integrated. Competition will be increasingly stringent, encouraging strategic alliances between countries and between business entities to support capacity and competitiveness. Domestically, the dream of realizing Indonesia as a World Maritime Fulcrum, proclaimed by the President, provides a distinct challenge for the national shipping industry, including ports, to be more capable of playing a role on the world stage while continuing to carry out the functions of national connectivity and domestic maritime logistics. In the next five years, the development of national sea transportation will be focused on three things, namely: providing equal connectivity to Disadvantaged Regions, Borders, and Outer Islands, support for priority areas, and increasing the efficiency of maritime logistics in the country through Strategic Priority Projects: Integrated Main Port Network supported by an interconnected shipping network (in the form of a loop). Therefore, various strategic issues (internal problems) in the port sector must be resolved immediately to address the challenges above. Port optimization clustering and classification is a strategic approach that aims to increase the competitiveness of ports by optimizing existing resources, infrastructure, and services.
Ports play a significant role in the global supply chain and serve as the main gateway for international trade and distribution of goods. Therefore, increasing the competitiveness of ports is crucial for the economic growth of a country or region. Port optimization clustering and classification are closely related concepts and aim to increase these ports' efficiency, productivity, and competitiveness. Clusterization is based on the idea that adjacent ports can support each other and improve efficiency through collaboration. The ports are closely connected physically and logistically in the port cluster to form an integrated ecosystem. One benefit of port clustering is coordinating joint infrastructure investments to increase connectivity and efficiency in distributing goods and passengers. Clustering allows ports to share facilities and resources, reducing operational costs and service time. The region becomes more appealing by having efficient and coordinated port clusters for foreign enterprises and investors. Port classification focuses on identifying the unique characteristics of each port and dividing them into categories based on size, capability, and specialization. This approach helps develop a suitable strategy for each port type, increasing its performance and competitiveness. By classifying ports based on size and field, an appropriate development strategy can be established to maximize the potential of each port. Classification helps understand customers' unique demands and needs across different types of ports so that services can be improved according to their requirements. Classification helps allocate resources efficiently based on the priorities and needs of each port. The category identifies the infrastructure required to support specific ports' growth and capacity building. Integration of port optimization clustering and classification can create a holistic approach to increasing port competitiveness. In this integration, ports in certain areas are classified based on size and specialization and then grouped into port clusters to support collaboration between them. The benefits of clustering and classification integration enable ports with similar characteristics to share experiences, best practices, and technologies that can improve operational efficiency and productivity. With an integrated approach, the ports in the cluster can compete better with ports in other regions or neighbouring countries.
The results of this research provide implications for the management of non-commercial ports as follows; Port clustering in the context of government management significantly impacts operational efficiency and logistics services. By integrating several ports under government auspices, the potential for resource optimization becomes more real. Joint management of infrastructure, loading and unloading equipment and storage areas can result in significant cost efficiencies. Collaboration between businesses, including port operators, shipping agents and logistics service providers, can be improved, paving the way for better coordination in supply chains. The government can also be important in facilitating joint investment to develop port infrastructure and supporting facilities. Overall, government-managed port clustering can not only improve operational efficiency and logistics services but also support regional economic growth and environmental sustainability. Collaboration between agencies and supporting regulations are key to the success of this strategy. Port optimization grouping and classification is a strategic approach that aims to increase port competitiveness by optimizing existing resources, infrastructure and services. Policymakers can use the model that has been prepared to be applied in planning and developing non-commercial ports.
In this study, researchers had several limitations, including the results of this research are only limited to the design of conceptual models and ideal models that have not yet reached actual implementation and accurate program plans. However, the results of this research can be used as a reference in determining strategies. The ports studied are limited to non-commercial ports that have port master plan data and port operational data. Future studies can improve this research by using more accurate data to determine the model and optimization strategy. The research targets can be expanded to commercial ports.
I want to thank Mr Marimin, Mr Luky Adrianto, and Mr Idqan Fahmi for their advice and instruction regarding improving article writing.
[1] Zikra, M. (2015). Climate change impacts on Indonesian coastal areas. Procedia Earth and Planetary Science, 14: 57-63. https://doi.org/10.1016/j.proeps.2015.07.085
[2] Clark, X., Dollar, D., Micco, A. (2004). Port efficiency, maritime transport costs, and bilateral trade. Journal of Development Economics, 75(2): 417-450. https://doi.org/10.1016/j.jdeveco.2004.06.005
[3] Jinca, M.Y. (2011). Sea transportation, system, and case study analysis. Surabaya. Brilian International. https://openlibrary.org/books/OL25068253M/Transportasi_laut_Indonesia.
[4] Brooks, M.R. (2004). The governance structure of ports. Review of Network Economics, 3(2): 168-183. https://doi.org/10.2202/1446-9022.1049
[5] Brooks, M.R., Pallis, A.A. (2008). Assessing port governance models: process and performance components. Maritime Policy & Management, 35(4): 411-432. https://doi.org/10.1080/03088830802215060
[6] United Nations Conference on Trade and Development. (1976). Port Performance Indicators. Geneva (CH): United Nations Publication. https://unctad.org/.
[7] Ha, M.H., Yang, Z., Notteboom, T., Ng, A.K., Heo, M.W. (2017). Revisiting port performance measurement: A hybrid multi-stakeholder framework for the modelling of port performance indicators. Transportation Research Part E: Logistics and Transportation Review, 103: 1-16. https://doi.org/10.1016/j.tre.2017.04.008
[8] Carbone, V., Martino, M.D. (2003). The changing role of ports in supply-chain management: An empirical analysis. Maritime Policy & Management, 30(4): 305-320. https://doi.org/10.1080/0308883032000145618
[9] Palmer, S. (2020). History of the ports. International Journal of Maritime History, 32(2): 426-433. https://doi.org/10.1177/0843871420921266
[10] Owoputi, A.E., Owolabi, O.O. (2020). Seaport development as an agent for economic growth and international transportation. European Journal of Logistics, Purchasing, and Supply Chain Management, 8(1): 19-34. https://doi.org/10.37745/ejlpscm/vol8.no1.pp19-4.2020
[11] Hlali, A., Hammami, S. (2017). Seaport concept and services characteristics: Theoretical test. The Open Transportation Journal, 11(1): 120-129. https://doi.org/10.2174/1874447801711010120
[12] Pileggi, S.F., Indorf, M., Nagi, A., Kersten, W. (2020). CoRiMaS—An ontological approach to cooperative risk management in seaports. Sustainability, 12(11): 4767. https://doi.org/10.3390/su12114767
[13] Yudhistira, M.H., Sofiyandi, Y. (2018). Seaport status, port access, and regional economic development in Indonesia. Maritime Economics & Logistics, 20: 549-568. https://doi.org/10.1057/s41278-017-0089-1
[14] Roa Perera, I., Peña, Y., Amante García, B., Goretti, M. (2013). Ports: Definition and study of types, sizes and business models. Journal of Industrial Engineering and Management (JIEM), 6(4): 1055-1064. http://dx.doi.org/10.3926/jiem.770
[15] de Boer, W., Mao, Y., Hagenaars, G., de Vries, S., Slinger, J., Vellinga, T. (2019). Mapping the sandy beach evolution around seaports at the scale of the African continent. Journal of Marine Science and Engineering, 7(5): 151. https://doi.org/10.3390/jmse705015
[16] Amin, C., Mulyati, H., Anggraini, E., Kusumastanto, T. (2021). Impact of maritime logistics on archipelagic economic development in eastern Indonesia. The Asian Journal of Shipping and Logistics, 37(2): 157-164. https://doi.org/10.1016/j.ajsl.2021.01.004
[17] Fonseca, T. (2021). Towards a better port industry by Peter W. de Langen. Routledge, 20: 265-268. https://doi.org/10.1007/s13437-021-00238-y
[18] Ding, Z.Y., Jo, G.S., Wang, Y., Yeo, G.T. (2015). The relative efficiency of container terminals in small and medium-sized ports in China. The Asian Journal of Shipping and Logistics, 31(2): 231-251. https://doi.org/10.1016/j.ajsl.2015.06.004
[19] Sahu, P.K., Padhi, A., Patil, G.R., Mahesh, G., Sarkar, A.K. (2019). Spatial temporal analysis of freight flow through Indian major seaport system. The Asian Journal of Shipping and Logistics, 35(1): 77-85. http://dx.doi.org/10.1016/j.ajsl.2019.03.01
[20] Departement of Transport. (2021). UK Port Freight Statistics. https://uk-ports.org/dft-port-freight-annual-statistics-2021.
[21] Gerlitz, L., Meyer, C. (2021). Small and medium-sized ports in the ten-t network and nexus of Europe’s twin transition: The way towards sustainable and digital port service ecosystems. Sustainability, 13(8): 4386. https://doi.org/ 10.3390/su13084386
[22] Hardianto, A., Marimin, Adrianto, L., Fahmi, I. (2023). The trend of parameters for evaluating port performance: A systematic literature review. International Journal of Transport Development and Integration, 7(3): 257-266. https://doi.org/10.18280/ijtdi.070309
[23] World Bank. (2003). World bank port reform toolkit. Washington, DC (US): World Bank. https://documents.worldbank.org/en/publication/documentsreports/documentdetail/120991468762301637/port-reform-toolkit.
[24] Vaggelas, G.K. (2019). Measurement of port performance from the users' perspective. Maritime Business Review, 4(2): 130-150. https://doi.org/10.1108/MABR-08-2018-0024
[25] Rezaei, J., van Wulfften Palthe, L., Tavasszy, L., Wiegmans, B., van der Laan, F. (2018). Port performance measurement in the context of port choice: An MCDA approach. Management Decision, 57(2): 396-417. https://doi.org/10.1108/MD-04-2018-0482
[26] Mickiene, R., Valioniene, E. (2017). Evaluation of the interaction between the state seaport governance model and port performance indicators. In Forum Scientiae Oeconomia, 5(3): 27-43. https://doi.org/10.23762/FSO_vol5no3_17_2
[27] Bichou, K. (2006). Review of port performance approaches and a supply chain framework to port performance benchmarking. Research in Transportation Economics, 17: 567-598. https://doi.org/10.1016/S0739-8859(06)17024-9
[28] Cabral, A.M.R., de Sousa Ramos, F. (2014). Cluster analysis of the competitiveness of container ports in Brazil. Transportation Research Part A: Policy and Practice, 69: 423-431. https://doi.org/10.1016/j.tra.2014.09.005
[29] Rozar, N.M., Sidik, M.H., Razik, M.A., Kamaruddin, S.A., Rozar, M.K.A.M., Usman, I., Alown, B.E. (2022). A hierarchical cluster analysis of port performance in Malaysia. Maritime Business Review, 8(3): 194-208. https://doi.org/10.1108/MABR-07-2020-004
[30] Dayananda, S.K., Dwarakish, G.S. (2020). Measuring port performance and productivity. ISH Journal of Hydraulic Engineering, 26(2): 221-227. https://doi.org/10.1080/09715010.2018.1473812
[31] Azzam, I.A., Al-Khatib, S.F., Albataineh, W.M. (2021). Strategic port classification: International clustering-based approach for decision-making optimization. Journal of Public Affairs, 21(1): e1963. https://doi.org/10.1002/pa.1963
[32] Ghiasi, M.M., Zendehboudi, S., Mohsenipour, A.A. (2020). Decision tree-based diagnosis of coronary artery disease: CART model. Computer Methods and Programs in Biomedicine, 192: 105400. https://doi.org/10.1016/j.cmpb.2020.105400
[33] Tangirala, S. (2020). Evaluating the impact of GINI index and information gain on classification using decision tree classifier algorithm. International Journal of Advanced Computer Science and Applications, 11(2): 612-619. https.doi.org/10.14569/IJACSA.2020.0110277
[34] Kang, Y., Song, J.L., Bian, M.M., Feng, H.P., Salama, M. (2022). Red tide monitoring method in coastal waters of Hebei Province based on decision tree classification. Applied Mathematics and Nonlinear Sciences, 7(1): 43-60. https://doi.org/10.2478/amns.2022.1.00051
[35] Demšar, J., Curk, T., Erjavec, A., Gorup, Č., Hočevar, T., Milutinovič, M., Polajnar, M., Toplak, M., Staric, A., Stajdohar, M., Umek, L., Zagar, L., Zbontar, J., Zitnik, M., Zupan, B. (2013). Orange: data mining toolbox in Python. the Journal of machine Learning research, 14(1): 2349-2353.
[36] Filom, S., Amiri, A.M., Razavi, S. (2022). Applications of machine learning methods in port operations-A systematic literature review. Transportation Research Part E: Logistics and Transportation Review, 161: 102722. https://doi.org/10.1016/j.tre.2022.102722
[37] Bai, X., Lam, J.S.L. (2015). Dynamic regional port cluster development: Case of the ports across Taiwan Strait. GeoJournal, 80: 619-636. https://doi.org/10.1007/s10708-014-9567-5