Enam A. Salman![]() | Rabab S. Abdoon
| Rabab S. Abdoon![]() | Loay E. George*
| Loay E. George*![]()
© 2024 The authors. This article is published by IIETA and is licensed under the CC BY 4.0 license (http://creativecommons.org/licenses/by/4.0/).
OPEN ACCESS
Cancer is an acute disease that kills many people around the world, so early detection is a vital need. This study aims to investigate the effectiveness of techniques used in detecting, isolating and extracting tumors in PET/CT images using clustering techniques: K-means, Fuzzy C-mean, and hybrid technique. The results showed that the applied methods were sufficient to detect, isolate and extract areas of the tumor. The calculated tumor area was compared with the nuclear medicine specialist demarcation area, and the percent relative difference ranged between 0.135%-4.86%. As well as the results indicated that implementing the hybrid technique reduced the elapsed time required, and the reduction percentage ranged between 43.03%-97.45%.
clustering, hybrid, tumors, PET/CT, K-means, FCM
Positron emission tomography (PET) is a non-invasive nuclear medical imaging technique specializing in studying the human body's functional characteristics. Provide an in vivo measurement of tumor biological processes; cancer detection is crucial to the aim of initiating treatment, economic burden, prolonging survival and reducing mortality [1]. is widely used to detect metabolically active lesions, especially in oncology FDG PET/CT [2].
In clinical oncology, of the target tumor is essential accurate segmentation. The positron emission tomography (PET)/computed tomography (CT) scanner effectively combines anatomical information from computed tomography with functional information from PET for accurate tumor identification, which can comprehensively describe tumor volumes. As integrated PET/CT has become a reference imaging technique, many current automated methods still segment the tumor into high-contrast, low-resolution images without considering the complementary knowledge of low-contrast, but high-resolution CT images. Current methods can be classified into types Different. The most common method is threshold, area growth, graph-based, unsupervised learning, and statistical methods [3].
Common clinical applications of PET include neuroscience, oncology, brain imaging, and cardiology. When injected into a patient, the dose of the radioisotope is selectively concentrated in the tissue of interest in the body. Tissues with more active cells usually reveal a higher metabolic rate. Among the many isotope-labeled or stable isotopes, PET radiotracers widely used in evaluating many tumors is the 18F-fludeoxyglucose (FDG) glucose analogue. Well, as in planning radiotherapy. Increased uptake of FDG in tissues with a high metabolic rate, such as areas of tumor or inflammation. Show these areas as areas of high intensity in the PET images. Accordingly, positron emission tomography studies are frequently used in tumor imaging [4].
PET and CT images are highly diagnostic to distinguish between lymphoma disease sites of physiological uptake and non-lymphatic inflammation. Computerized tomography (PET/CT) is a powerful tool widely used to predict and evaluate response to treatment and for the accurate diagnosis of oncological patients. Use the metabolic information of PET images and the spatial information of the CT scan to develop a file-automated detection framework. Tumor detection is performed by extracting a high SUV area based on PET/CT images and its inclusion in the detection scheme based on CT images [5].
Instead of being read separately by a nuclear medicine doctor and radiologist, PET and CT images are analyzed simultaneously. PET/CT assessment and primary PET/CT alignment are done with image recording techniques rather than visually aligned. Identifying changes in the original tumor site and modelling the changes as a function of spatial location serial PET/CT image registration offers new opportunities. Image registration is the process of image formatting a baseline PET/CT (still image) with a PET/CT (motion picture) assessment alignment system with a transformation model. The transformed motion picture is called a "twisted image." With an integrated PET/CT scanner, most PET/CT images are obtained [6].
Image segmentation is usually the first step of most analysis procedures. Image segmentation entails dividing or separating the image into regions with similar characteristics that are represented by grouping a group of pixels that share similar characteristics, such as density and texture. The image luminance amplitude for a monochrome image and color components for a color image is most basic attribute for segmentation. Also useful features for image segmentation are image edges and texture [7].
Many researchers have worked in this way; for example, Jamal et al. This study presents lung tumor detection and analysis using a powerful segmentation technique, Fuzzy C-mean Clustering, based on objective function minimization. Also, a new method for predicting who will develop idiopathic lung cancer from early-stage positron emission tomography was studied-a proposed technical differentiation between abnormal and normal tissue based on histopathological information (examination of both malignant and benign tissues microscopic ). using positron emission tomography and color tissue images The proposed technique was applied to the lung to obtain early detection of cancerous lung tissue. to find the similarity between any measured data and the centern organic function development relies on iterative optimization, which improves the aggregation process [8].
K-means clustering suggested a highly reproducible method for identifying different functional structures of dynamic [18F] brain images for FET-PET compared to manual ROI plotting to investigate the image reconstruction algorithm and scanner used [9].
Hagos et al. [10], because of its fast computation, implemented the Simple Linear Iterative Assembly (SLIC) algorithm. They studied a rapid tumor segmentation method in positron emission tomography (PET) using superpixels. To identify the tumor and non-tumorigenic superpixels, they applied a set of means k on the distance vector. The proposed approach has been implemented in MATLAB 2016 [10].
Lian et al. [3] proposed an unsupervised 3D method for automatic tumor segmentation in PET images and the SECM spatial evidence aggregation algorithm. A context-specific term has been proposed for iterative quantification of the discrepancy between PET and CT division. In addition to accurately marking the image pixels for dependable guidance. For more details, refer to the following sources [11-15].
This study adopted a set of PET/CT images to investigate the efficient performance of clustering techniques to detect, isolate and extract abnormal regions. The implemented methods were K-means, Fuzzy C-means, and a proposed hybrid technique.
This work aims to investigate the effecincintly of three segmentation methods that were introduced to detect, isolate and extract the abnormal regions that belong to tumors. The implemented methods, which are K-means, Fuzzy C-means, and a proposed hybrid technique, were implemented with the aid of the programming system MatLab.
Different techniques have been used for image classification and segmentation. One of these techniques is the K-means method, which is one of the successful methods used for clustering, which divides the input data into separate groups called clusters. The data is divided into these groups using K-means according to their common features, for example, density. The number k of desired combinations must be determined in advance. This process groups data points that share similar features as one group or group, while other data points that share other features from the first groups are grouped into another group or group. Therefore, the accuracy of the K-means technique is subject to the initial selection of central points called centroids or seeds. Thus, the K-means are sensitive to the first representation of the initial random structure of the centroids. For optimal performance, it must first be distributed in a certain way [16].
Data mining analysis, a commonly used method for K-clustering, is therefore a way to measure vectors arising from signal processing. The goal of K-clustering is to partition n observations into K clusters; The part of the block that serves as the prototype of the block is all the observations. The K-means approach is commonly used, which is an iterative process that starts with the initial partitioning and then converges to the best results while minimizing the sum of squared error (SSE) [17].
The drawbacks and advantages of the K-means algorithm.
(1) The advantages of K-means clustering include its ease of interpretation, ability, and guarantee of convergence to scalability.
(2) The drawbacks of K-means clustering include the need to pre-determine the number of clusters, the risk of getting stuck in local minima, its inability to handle noise or outliers and its sensitivity to initial cluster centroids.
Let x = {xi}, i = 1, n be the set of n d-dimensional points to be clustered into a set of K clusters, C = {ck, k = 1, k}. K-means algorithm finds a partition such that the squared error between the points in the cluster is minimized and the empirical mean of a cluster . Let Xi be the mean of cluster uk. The squared error between the points in cluster uk and Xi, the Eq. (1) shows that [18].
$J_{c_k}=\sum_{\mathrm{x} i \in \mathrm{ck}}\|X i-u k\|^2$ (1)
The benefit of applying K-means to all K groups is to reduce the sum of the squared error. Eq. (2) shows that [18].
$J(c)=\sum_{k=1}^k \sum_{\mathrm{xi} \in \mathrm{ck}}\|X i-u k\|^2$ (2)
where, J(ck) is K clusters, J(c), K-means is to minimize the sum of the squared error over all K clusters, $\|X i-u k\|^2$ is the squared error between uk and the points in cluster ck.
The following steps can summarize the procedure of this method:
(1) Input image.
(2) Implementing K -Means with numbers of clusters (4, 5, 6 and 7) and PET/CT images
(3) Selecting the segment of the abnormality.
(4) Applying morphological processes, if needed, like opening with structure element of disk-shaped of different radius ranging between (1-18) depending on the processed images.
(5) Calculating the area of the refined extracted tumors regions.
Fuzzy C-means Clustering, FCM is an unsupervised clustering algorithm that is applied to many problems, including classifier design, feature analysis, and clustering. A method of processing data is called fuzzy logic, after giving the partial membership value for each pixel in the image. The membership value of the flux group ranges from 0 to 1. Thus, defining flux groups is a process that allows for intermediate values; That is, a member of one camouflage group is also a member of other camouflage groups in the same image. The C-Mean (FCM) algorithm is the most popular method used for image segmentation because it has strong ambiguity properties and can retain much more information than hard segmentation methods because it relies on probability, as well as has more ability to handle uncertainty and noise [7].
The distance between the data points and the cluster centers is formed for each cluster that is formed. The FCM algorithm is a clustering method that allows one piece of data to belong to two or more groups; The data set is then grouped into n groups, where each data point in the data set for each group belongs to a certain threshold in the FCM. For example, a data point that is located far from the center of a cluster will have a low degree of belonging or membership in that cluster. A data point that is located near the center of the cluster will have a high degree of belonging or membership to that cluster. For centers of mass, starting with an initial guess, aim to determine each group's average location [8]. It requires a large amount of memory to collect large data, so it may take a long time to compile FCM [19].
To group the pixels into one group, exclusively solid grouping methods are used. However, FCM allows pixels in multiple groups based on membership grades. The sum of the membership of each data point in the given data sets must be equal to each other. Suppose X = {x1, x2, x3..., xn} is the set of data points and C = {c1, c2, c3, ..., cn} is the set of centers. Update membership and cluster center for each iteration 3. The following Eqs. (3) and (4) show [12, 20].
$\mu_{i j}=\frac{1}{\sum_{k=1}^c\left(\frac{d i j}{d i j}\right)^{\left(\frac{1}{(m-1)}\right)}}$ (3)
$c=\sum_{i=1}^n\left(\frac{\left.(u i j)^m \chi i\right)}{(u i j)^m}\right)$ (4)
where, dij represents the distance between the center of cluster j and data i. The number of groups is c. M represents the ambiguity index. μij represents the membership of data i in cluster center j. n represents the number of data points. cj represents the jth center of mass. The following steps can summarize the procedure of this method:
(1) Input image.
(2) Implementing FCM with numbers of clusters (4,5, 6 and 7) and PET/CT images.
(3) Selecting the segment of the abnormality.
(4) Applying morphological processes, if needed, like opening with structure element of disk-shaped of different radius ranging between (1-19) depending on the processed images.
(5) Calculating the area of the refined extracted tumors regions.
In this technique, the centers of the final clusters, which were reached using the K-means method, are adopted, and they are taken as proposed centers for the FCM method. This is instead of the FCM algorithm starting from random centers, and the convergence in this method is the convergence and reaching the optimal separation in a short time, and the resulting separation results are The two stages of filtering the image points and linking them to the groups they belong to are based on the principle of high probability, that implementing the hybrid technique reduced the elapsed time required.
In this work three segmantion method ware plamantel to clusturs the explmanted image under study to extract tumor region and the procedure can be summarized as show in the block diagram of Figure 1.
Figure 1. Block diagram of the proposed work
Our only reference is the rdologist delineation, and from the rdologist delineation enables him to calculate the tumor area and compare these results with our results to determine the accuracy of the methods adopted in extracting the tumor areas.
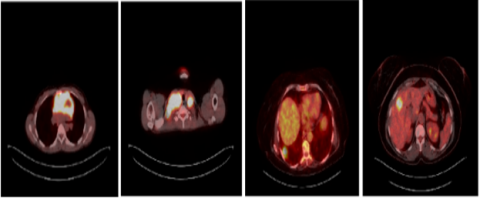
The experimental data set is four images; the first and second images are for lymph nodes, the third is for lungs, and the fourth is for the liver—these images were taken from Amal Al-Hayat Hospital for Oncology and Hematology, Iraq. Figure 2 shows these input images.
Figure 2. Experimental images of lymph nodes, lung, and liver in hybrid technology of PET/CT
In this section, the results of the three adopted techniques for detecting, isolating, and extracting the affected areas are presented as follows:
6.1 K-means clustering method
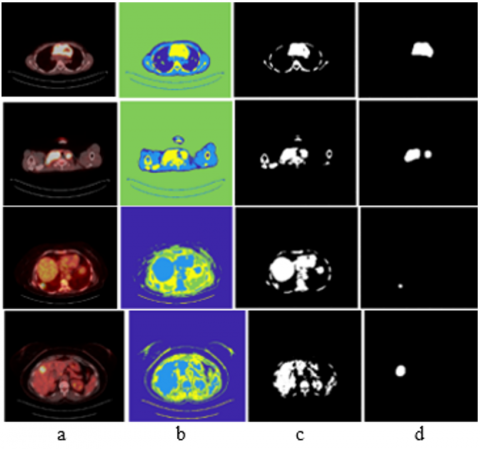
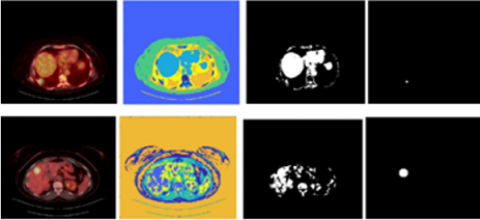
Clustering K-means was applied on PET/CT images with different numbers of clusters (4, 5, 6 and 7) to segment the experimental images. Figures 3-6 show the results of these steps.
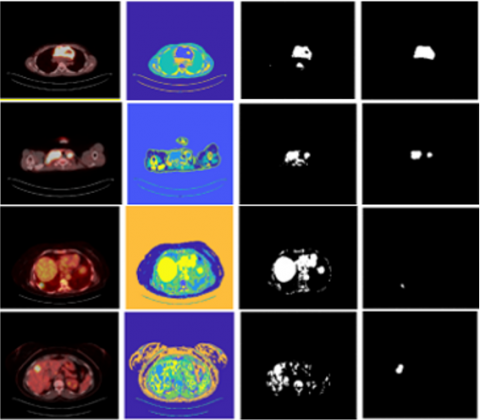
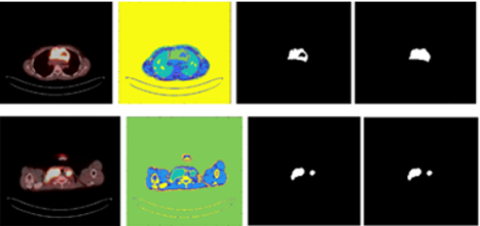
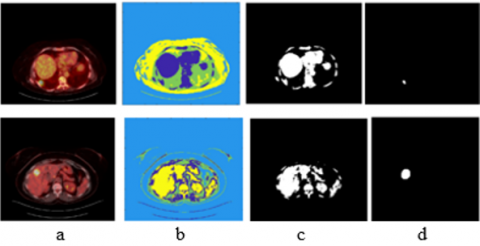
Figure 3. The results of applying the K-means with four clusters
Note: a represents our input images, b shows the segmented images, and c represents the part that belongs to the affected area. d shows the tumor area extracted after several morphological operations
Figure 4. The results of applying the K-means with five clusters
Note: a represents our input images, b shows the segmented images, and c represents the part that belongs to the affected area. d shows the tumor area extracted after several morphological operations
Figure 5. The results of applying the K-means with six clusters
Note: a represents our input images, b shows the segmented images, and c represents the part that belongs to the affected area. d shows the tumor area extracted after several morphological operations
Figure 6. The results of applying the K-means with seven clusters
Note: a represents our input images, b shows the segmented images, and c represents the part that belongs to the affected area. d shows the tumor area extracted after several morphological operations
In Figures 3-6, the first column(a) represents our input images, the second column(b) shows the segmented images, the third column(c) represents the part that belongs to the affected area. The fourth column(d) shows the tumor area extracted after applying several morphological operations. The results showed an appropriate extraction of the affected areas. According to a nuclear medicine specialist consultation, number five is the number of the appropriate cluster for extracting tumor areas.
6.2 FCM clustering method
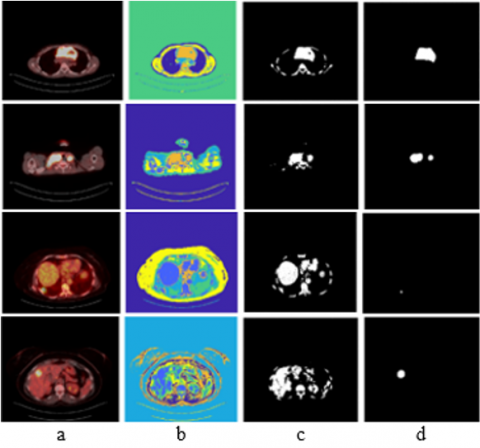
Clustering FCM was applied with different clusters (4, 5, 6, and 7). These clusters were used to divide the experimental images and get the best extraction. Figures 7-10 present the results of this step.
|
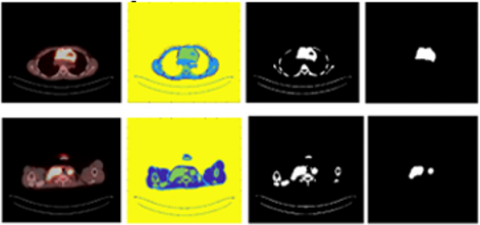
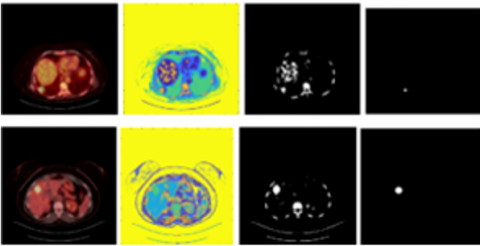
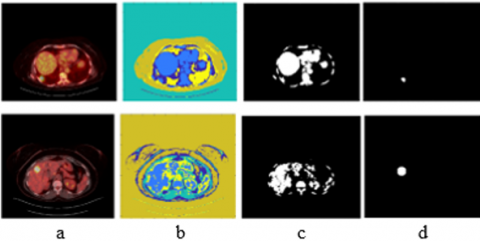
Figure 7. The results of applying FCM with four clusters Note: a represents our input images, b shows the segmented images, and c represents the part that belongs to the affected area. d shows the tumor area extracted after several morphological operations |
Figure 8. The results of applying FCM with five clusters Note: a represents our input images, b shows the segmented images, and c represents the part that belongs to the affected area. d shows the tumor area extracted after several morphological operations |
|
Figure 9. The results of applying FCM with six clusters Note: a represents our input images, b shows the segmented images, and c represents the part that belongs to the affected area. d shows the tumor area extracted after several morphological operations |
Figure 10. The results of applying FCM with seven clusters Note: a represents our input images, b shows the segmented images, and c represents the part that belongs to the affected area. d shows the tumor area extracted after several morphological operations |
In Figures 7-10, the first column(a) represents our input images, the second column(b) shows the segmented images, and the third column(c) represents the part that belongs to the affected area. The fourth column(d) shows the tumor area extracted after applying opening morphological operation. The results showed appropriate insulation and extraction of the affected areas. According to the nuclear medicine specialist consultation, six are the appropriate clusters for extracting tumor areas using FCM.
6.3 Hybrid technique
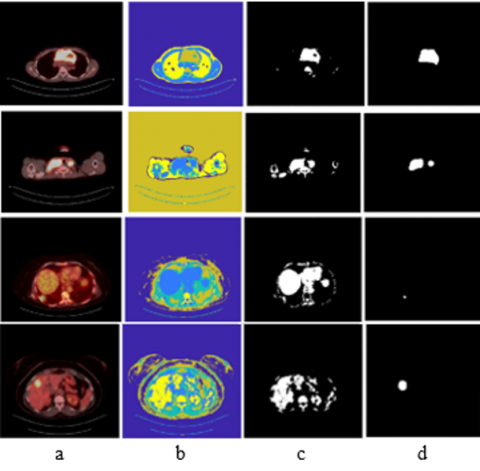
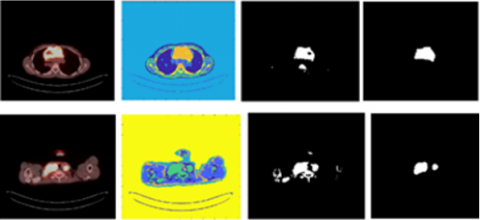
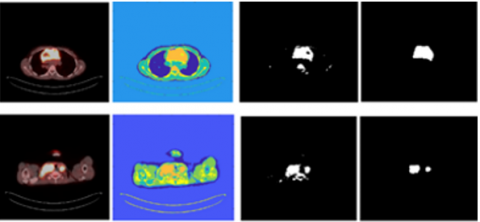
The clustering Hybrid technique was applied with different clusters (4, 5, 6 and 7) to segment the adopted images; we applied the K-means of 3 clusters for the first split image and adopted the values [254.7839, 15.2311, 226.0810]. These values were used for FCM with 3 clusters. We also implemented K-means with 4 clusters for the first split image and adopted the values [229.9274, 254.8665, 7.3211, 143.7955]. These values were used for FCM with four clusters, and so on, for the rest of the images and the rest of the number of clusters in the same method. Figures 11-14 present the results of this step.
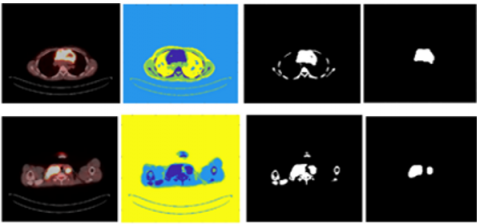
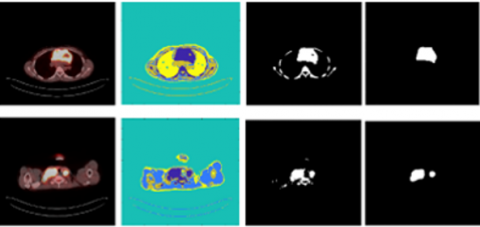
In Figures 11-14, the first column(a) represents our input images, the second column(b) shows the segmented images, and the third column(c) represents the part that belongs to the affected area. The fourth column(d) shows the tumor area extracted after applying several morphological operations. The results showed an appropriate extraction of the abnormal areas. The number six is the number of the appropriate cluster for extracting tumor areas according to a nuclear medicine specialist consultation.
|
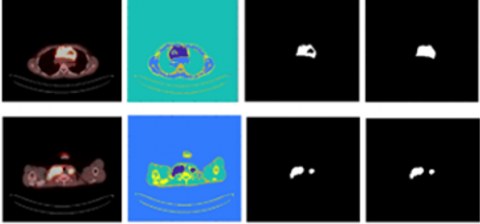
Figure 11. The results of applying the hybrid with four clusters Note: a represents our input images, b shows the segmented images, and c represents the part that belongs to the affected area. d shows the tumor area extracted after several morphological operations |
Figure 12. The results of applying the hybrid with five clusters Note: a represents our input images, b shows the segmented images, and c represents the part that belongs to the affected area. d shows the tumor area extracted after several morphological operations |
|
Figure 13. The results of applying the hybrid with six clusters Note: a represents our input images, b shows the segmented images, and c represents the part that belongs to the affected area. d shows the tumor area extracted after several morphological operations |
Figure 14. The results of applying the hybrid with seven clusters Note: a represents our input images, b shows the segmented images, and c represents the part that belongs to the affected area. d shows the tumor area extracted after several morphological operations |
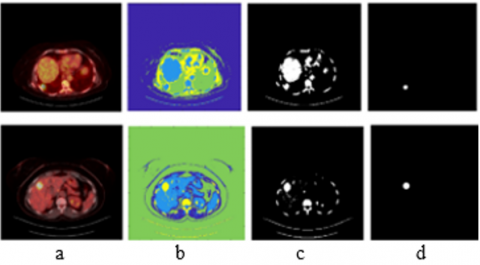
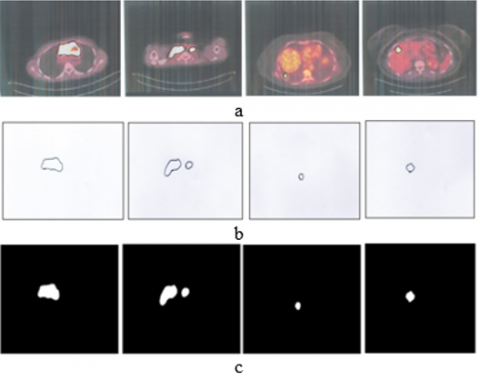
In this step, a manual identification of abnormal areas were made by a radiologist. The delineated images were processed by taking the contours that represented border of the abnormal regions. This process were done by applying a function of filling region of the contouring object that represents the abnormal regions (tumor). The delineated regoins were extracted and then their surface area were calculated to a doped them as a ground truth to compare these areas values with these of the presented methods in order to investigate the performance quality of the implemented segmentation methods. Figure 15 shows the results of these steps for PET/CT images.
Figure 15. Nuclear medicine specialist identifies abnormal areas from PET/CT images of lymph nodes, lymph nodes, lung, and liver, respectively
Note: a represents images under study. b Doctor's planning. c represents the extracted regions according to the doctor's delineation.
In Figure 15, the first row shows the radiologist delineation of the abnormal regions, the second row represents the delineation contour only, while the last row illustrates the filled delineation abnormal regions after applying some image processing functions. The second and the third rows are resulted from applying processing operation on the images of the first row.
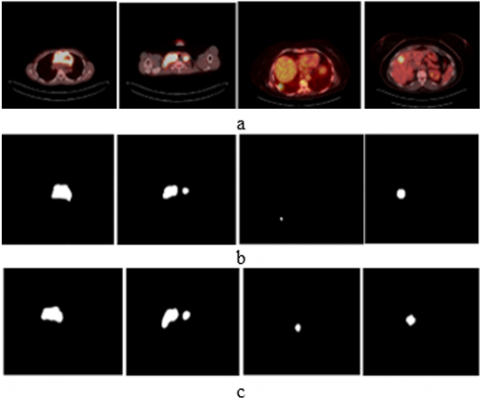
In Figure 16, the first row(a) represents images under study, the second row(b) is the tumor extraction using K- means algorithm, and the third row (c)represents the extracted regions according to the doctor's delineation.
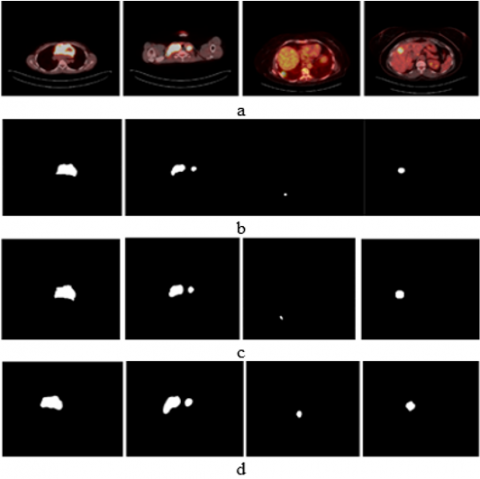
After applying the FCM and hybrid technique with a number of clusters (6), the extracted tumor regions were compared visually with the extracted region depending on the doctor's delineation, According to a consultant specializing in nuclear medicine, the results showed an appropriate excision of the tumor areas. Figure 17 illustrates this visual comparison.
In Figure 17, the first row(a) represents the images under study, the second row(b) represents the FCM-extracted tumor, the third row (c) is the hybrid tumor extraction, and the fourth row(d) represents the physician's extraction of tumor areas. According to a consultant specializing in nuclear medicine, the results showed an appropriate excision of the tumor areas.
The nuclear medicine specialist demarcation area was calculated for the three techniques and compared with our extracted tumor areas, and the percent relative difference ranged between (0.135 - 4.86) %.
Automated techniques are the best in delineating abnormal areas in medical images, objective They do not depend on variables, unlike manual demarcation, which is subject to circumstances and varies from one doctor to another.
The extracted surface areas of infected regions were calculated and presented in Table 1.
The elapsed time extracted for implementing K-means, FCM, and hybrid techniques was calculated and presented in Table 2.
The percent relative reduction time of the hybrid technique concerning FCM was calculated and presented in Table 3. Table 3 shows that the hybrid technique reduced the elapsed time with a percent relative reduction ranging from (43.03-97.45) %.
Figure 16. The results of tumor extraction compared to the doctor's extraction with five clusters
Note: a represents images under study, b is the tumor extraction using the K- means algorithm, and c represents the extracted regions according to the doctor's delineation.
Figure 17. The results of tumor extraction compared to the doctor's extraction with six clusters
Note: a represents the images under study, b represents the FCM-extracted tumor, c is the hybrid tumor extraction, and d represents the physician's extraction of tumor areas.
Table 1. Surface (in pixels) areas calculated for tumor areas extracted with three techniques PET/CT image
|
Image No. |
Number of Clusters |
|||||
|
Four |
Five |
|||||
|
K-means |
FCM |
Hybrid |
K-means |
FCM |
Hybrid |
|
|
1 |
5179 |
4720 |
5272 |
5128 |
4151 |
5163 |
|
2 |
3922 |
3263 |
3963 |
3658 |
2547 |
3496 |
|
3 |
281 |
350 |
175 |
125 |
214 |
302 |
|
4 |
1502 |
697 |
1769 |
1425 |
697 |
1425 |
|
Image No. |
Number of Clusters |
|||||
|
Six |
Seven |
|||||
|
K-means |
FCM |
Hybrid |
K-means |
FCM |
Hybrid |
|
|
1 |
5019 |
4138 |
4905 |
4934 |
4138 |
4989 |
|
2 |
2610 |
2530 |
3308 |
2600 |
2530 |
2049 |
|
3 |
139 |
109 |
85 |
118 |
117 |
136 |
|
4 |
1036 |
697 |
1297 |
1279 |
672 |
893 |
Table 2. Elapsed time (in seconds) of implementing K-means, FCM, and the hybrid technique for PET/CT images
|
Image No. |
Number of Clusters |
|||||
|
Four |
Five |
|||||
|
K-means |
FCM |
Hybrid Method |
K-means |
FCM |
Hybrid Method |
|
|
1 |
1.36 |
8.03 |
1.65 |
0.98 |
7.43 |
3.19 |
|
2 |
0.97 |
4.50 |
1.59 |
1.44 |
4.95 |
2.82 |
|
3 |
0.72 |
6.97 |
1.25 |
0.84 |
9.97 |
1.94 |
|
4 |
1.85 |
7.41 |
2.65 |
1.68 |
6.15 |
2.98 |
|
Image No. |
Number of Clusters |
|||||
|
Six |
Seven |
|||||
|
K-means |
FCM |
Hybrid Method |
K-means |
FCM |
Hybrid Method |
|
|
1 |
1.54 |
11.58 |
2.10 |
1.38 |
9.79 |
3.68 |
|
2 |
1.47 |
8.08 |
2.06 |
1.46 |
9.66 |
2.26 |
|
3 |
1.22 |
8.52 |
2.11 |
0.99 |
9.97 |
2.25 |
|
4 |
1.38 |
8.24 |
3.50 |
1.62 |
9.49 |
2.54 |
Table 3. The elapsed time and percent relative reduction time of the hybrid technique for PET/CT images
|
Image No. |
Number of Clusters |
|||||
|
Four |
Five |
|||||
|
FCM |
Hybrid Method |
% Rel. reduction of time |
FCM |
Hybrid Method |
% Rel. reduction of time |
|
|
1 |
8.03 |
1.65 |
97.452 |
7.43 |
3.19 |
57.065 |
|
2 |
4.50 |
1.59 |
64.666 |
4.95 |
2.82 |
43.030 |
|
3 |
6.97 |
1.25 |
82.065 |
9.97 |
1.94 |
80.541 |
|
4 |
7.41 |
2.65 |
64.237 |
6.15 |
2.98 |
51.544 |
|
Image No. |
Number of Clusters |
|||||
|
Six |
Seven |
|||||
|
FCM |
Hybrid Method |
% Rel. reduction of time |
FCM |
Hybrid Method |
% Rel. reduction of time |
|
|
1 |
11.58 |
2.10 |
81.865 |
9.79 |
3.68 |
62.410 |
|
2 |
8.08 |
2.06 |
74.504 |
9.66 |
2.26 |
76.604 |
|
3 |
8.52 |
2.11 |
75.234 |
9.97 |
2.25 |
77.432 |
|
4 |
8.24 |
3.50 |
57.524 |
9.49 |
2.45 |
74.183 |
The accuracy, sensitivity, and specificity of the implemented segmentation methods were calculated; the results are shown in Table 4.
Table 4. Accuracy, sensitivity and specificity of segmentation methods
|
Methods |
Accuracy % |
Sensitivity % |
Specificity % |
|
K-means |
89 |
75 |
25 |
|
FCM |
100 |
81 |
19 |
|
Hybrid |
75 |
75 |
25 |
In this work, K-means, FCM, and hybrid technique combine the two algorithms by adopting the centroids of K-means-accessed end clusters as initial centres of the FCM algorithm; these techniques were performed with 4, 5, 6 and 7 clusters to extract abnormal regions in PET/CT. The results showed that the applied methods were sufficient to detect, isolate and extract areas of the tumor, which has proved especially useful in oncology; the hybrid technique successfully reduces the elapsed time of FCM by a relative value of (23.46 - 49.62) %. The nuclear medicine delineation area was calculated for the three techniques and compared to our extracted tumor areas, and the percent relative difference ranged between (0.135 - 4.86) %. The five is the appropriate cluster number for extracting tumor areas by K means. At the same time, for FCM and hybrid, six is the number of the appropriate clusters to extract tumor regions; the best extraction method was Fuzzy C-means.
The authors thank Dr Karar Obaid Al-Mansory, head of the nuclear medicine department at Amal Al-Hayat Hospital for cancer diseases, for his delineation of tumor regions and for his consultation and reviewing the tumor extraction using the adopted techniques. The authors also thanked the Amal Al-Hayat Specialized Hospital for Cancer Diseases / Al-Najaf Al-Ashraf for providing PET/CT images.
[1] Gambhir, S.S., Czernin, J., Schwimmer, J., Silverman, D.H., Coleman, R.E., Phelps, M.E. (2001). A tabulated summary of the FDG PET literature. Journal of Nuclear Medicine, 42(5S): 1S-93S.
[2] Kawauchi, K., Furuya, S., Hirata, K., Katoh, C., Manabe, O., Kobayashi, K., Watanabe, S., Shiga, T. (2020). A convolutional neural network-based system to classify patients using FDG PET/CT examinations. BMC Cancer, 20: 227. https://doi.org/10.1186/s12885-020-6694-x
[3] Lian, C., Ruan, S., Denœux, T., Guo, Y., Vera, P. (2017). Accurate tumor segmentation in FDG-PET images with guidance of complementary CT images. In 2017 IEEE International Conference on Image Processing (ICIP), Beijing, China, pp. 4447-4451. https://doi.org/10.1109/ICIP.2017.8297123
[4] Rundo, L. (2021). Computer-assisted analysis of biomedical images. arXiv preprint arXiv:2106.04381. https://doi.org/10.48550/arXiv.2106.04381
[5] Yousefirizi, F., Decazes, P., Amyar, A., Ruan, S., Saboury, B., Rahmim, A. (2022). AI-based detection, classification and prediction/prognosis in medical imaging: Towards radiophenomics. PET Clinics, 17(1): 183-212. https://doi.org/10.1016/j.cpet.2021.09.010
[6] Lu, W., Wang, J., Zhang, H.H. (2015). Computerized PET/CT image analysis in the evaluation of tumour response to therapy. The British Journal of Radiology, 88(1048): 20140625. https://doi.org/10.1259/bjr.20140625
[7] Alwan, A.A.H. (2023). Utilizing multi image processing techniques to detect and isolate abnormalities in medical images. Master's thesis, University of Babylon, Iraq.
[8] Geweid, G.G., Abdallah, M.A., Hassan, A.M. (2020). Improved malignant diagnosis using fuzzy C-means based on histopathological of PET-CT lung images. In Proceedings of the 2020 12th International Conference on Bioinformatics and Biomedical Technology, Xi’an, China, pp. 99-105. https://doi.org/10.1145/3405758.3405784
[9] Abualhaj, B. (2017). [18F] FET-PET brain image segmentation using K-means: Evaluation of five cluster validity indices. Doctoral dissertation. https://doi.org/10.11588/heidok.00023560
[10] Hagos, Y.B., Minh, V.H., Khawaldeh, S., Pervaiz, U., Aleef, T.A. (2018). Fast PET scan tumor segmentation using superpixels, principal component analysis and K-means clustering. Methods and Protocols, 1(1): 7. https://doi.org/10.3390/mps1010007
[11] Nishio, M., Kono, A.K., Kubo, K., Koyama, H., Nishii, T., Sugimura, K. (2015). Tumor segmentation on 18F FDG-PET images using graph cut and local spatial information. Open Journal of Medical Imaging, 5(3): 174-181. https://doi.org/10.4236/ojmi.2015.53022
[12] Meena, A., Raja, R. (2013). Spatial fuzzy C means pet image segmentation of neurodegenerative disorder. arXiv preprint arXiv:1303.0647. https://doi.org/10.48550/arXiv.1303.0647
[13] Xu, Z.Y., Gao, M.C., Papadakis, G.Z., Luna, B., Jain, S., Mollura, D.J., Bagci, U. (2018). Joint solution for PET image segmentation, denoising, and partial volume correction. Medical Image Analysis, 46: 229-243. https://doi.org/10.1016/j.media.2018.03.007
[14] Islam, M.R., Beni, M. S., Ito, S., Gotoh, S., Yamaya, T., Watabe, H. (2022). An analysis scheme for 3D visualization of positron emitting radioisotopes using positron emission mammography system. Applied Sciences, 12(2): 823. https://doi.org/10.3390/app12020823
[15] Boursier, C., Zaragori, T., Bros, M., Bordonne, M., Melki, S., Taillandier, L., Blonski, M., Roch, V., Marie, P.Y., Karcher, G., Imbert, L., Verger, A. (2023). Semi-automated segmentation methods of SSTR PET for dosimetry prediction in refractory meningioma patients treated by SSTR-targeted peptide receptor radionuclide therapy. European Radiology, 33(10): 7089-7098. https://doi.org/10.1007/s00330-023-09697-8
[16] Kadhim, W.D., Abdoon, R.S. (2020). Hybrid Clustering technique to detect bone tumor. NeuroQuantology, 18(8): 80-85. https://doi.org/10.14704/nq.2020.18.8.NQ20208
[17] Jahwar, A.F., Abdulazeez, A.M. (2020). Meta-heuristic algorithms for K-means clustering: A review. PalArch's Journal of Archaeology of Egypt/Egyptology, 17(7): 12002-12020.
[18] Jain, A.K. (2010). Data clustering: 50 years beyond K-means. Pattern Recognition Letters, 31(8): 651-666. https://doi.org/10.1016/j.patrec.2009.09.011
[19] Hoseini, F., Mortezaie Dekahi, G. (2019). High performance implementation of fuzzy C-means and watershed algorithms for MRI segmentation. Journal of Advances in Computer Research, 10(1): 11-24.
[20] Bezdek, J.C. (2013). Pattern Recognition with Fuzzy Objective Function Algorithms. Springer Science & Business Media.