Kishorebabu Dasari*![]() | Srinivas Mekala
| Srinivas Mekala![]() | Jhansi Rani Kaka
| Jhansi Rani Kaka![]()
© 2024 The authors. This article is published by IIETA and is licensed under the CC BY 4.0 license (http://creativecommons.org/licenses/by/4.0/).
OPEN ACCESS
Distributed Denial of Service (DDoS) stands as a critical cybersecurity concern, representing a malicious tactic employed by hackers to disrupt online services, network resources, or host systems, rendering them inaccessible to legitimate users. DDoS attack detection is essential as it has a wide-ranging impact on the field of computer science. This is quantitative research to evaluate Multilayer Perceptron (MLP) classification algorithm with different optimization methods and different activation functions on UDP-based DDoS attack detection. The CIC-DDoS2019 DDoS evaluation dataset, known for its inclusion of modern DDoS attack types, was instrumental in this study by the Canadian Institute for Cyber Security. The CIC-DDoS2019 dataset encompasses eleven DDoS attack datasets, which are UDP, UDP-Lag, NTP, and TFTP datasets were utilized in this investigation. This study proposes a novel feature selection approach. It specifically targets datasets related to UDP-based DDoS attacks. The approach aims to identify groups of features that share the uncorrelated characteristic. It means None of the features within a subset have a significant relationship with each other as measured by three correlation methods: Pearson, Spearman, and Kendall. To further validate the proposed approach, the researchers conducted experiments on a specially crafted DDoS attack dataset. MLP classification algorithm along with ADAM optimization method and Tanh activation function produce the better results for UDP-based DDoS attack detection. This combination produces the better accuracy values of 99.97 for UDP Flood attack, 99.77 for UDP-Lag attack, 99.70 for NTP attack, 99.93 for TFTP attack and 99.76 for UDP customized DDoS attack.
Distributed Denial of Service (DDoS) attacks, machine learning, neural network classifier, multilayer perceptron, correlation methods, convex optimization methods, activation functions
The alarming rise of cyberattacks targeting internet-connected devices has become a pressing concern, with Distributed Denial-of-Service (DDoS) attacks being a major culprit. As detailed in sources [1] DDoS attacks [2] overwhelm systems with a deluge of malicious traffic originating from a multitude of compromised devices. DDoS attacks aim to cripple a specific system or server by overwhelming it with a flood of malicious traffic. This onslaught can render the victim completely inaccessible (service failure) or significantly slow it down (service degradation). The consequences of such an attack can be severe, leading to financial losses, server outages, and putting immense pressure on IT staff to restore normal operations. There are two primary types of DDoS attacks: reflection-based and exploitation-based. The key difference lies in how they target vulnerabilities. Reflection-based DDoS attacks exploit weaknesses in internet communication. In a reflection-based DDoS attack, attackers exploit weaknesses in third-party servers. They trick these servers into sending massive responses by forging the source address in packets to appear as if they originated from the victim's IP address. This bombardment of responses overwhelms the victim's system, causing a denial-of-service. These protocols can be application-layer or transport-layer protocols used for basic communication. The victim is flooded with legitimate responses, but from the wrong source, making it hard to identify the attacker. Exploitation-based DDoS attacks target specific weaknesses in the victim’s system or software. These weaknesses can be in application-layer protocols or transport-layer protocols that handle basic communication. Similar to reflection attacks, the attacker hides behind legitimate communication, making it difficult to identify them. This research emphasizes the detection of DDoS attacks based on UDP, specifically targeting NTP, TFTP, UDP, and UDP-Lag attacks.
A UDP flood [3] constitutes an exploitation-based DDoS attack, where an extensive volume of UDP packets is directed towards a specific server with the intent to inundate its processing and response capacities.
The UDP-Lag attack [4] is a sneaky trick used by some gamers to slow down their opponents. It disrupts the connection between a player and the game server, giving the attacker an unfair advantage. There are two ways to launch a UDP-Lag attack: Lag Switch and Bandwidth Hogging Software. Lag Switch is a special piece of hardware that disrupts the flow of data between the player and the game server. Imagine it like a faulty on/off switch for your internet connection. Bandwidth Hogging Software is a program that eats up a lot of internet bandwidth on the attacker's network. By hogging the bandwidth, there's less available for other users, causing their connection to slow down.
The Network Time Protocol (NTP) [5] is like a universal clock for computers on the internet. It keeps everyone synchronized. Attackers exploit publicly available NTP servers. These servers are designed to respond to requests with a much bigger chunk of data. The attacker sends a tiny request to the NTP server with the victim's IP address spoofed as the source. The tricked server then sends a huge response back to the victim, overloading their system with useless traffic.
The Trivial File Transfer Protocol (TFTP) [6] facilitates the transfer of firmware and configuration files among networked devices.
Primary challenges [7] in DDoS detection are early detection, less computation and accuracy in detection. If DDoS attacks not detect early its consequences create very huge financially in financially and damage reputation. Conventional DDoS detection methods like data mining and statistical methods not detect early and not detect more accurately. This research employs quantitative methods to assess classification evaluation metrics for detecting UDP-based DDoS attacks using Multilayer Perceptron. Three optimization methods are evaluated, each paired with four different activation functions. This study tackles DDoS attack detection by finding a special set of features. Uncorrelated Features that act independently of each other. Imagine features like different colored lights on a traffic light - they all tell a different part of the story. Three different techniques (Pearson, Spearman, and Kendall) to identify these independent features, like looking at the traffic light from three different angles. By looking at the features identified by all three methods, we find a smaller set of highly reliable features. This is like the intersection of the three views of the traffic light, giving us the clearest picture. This approach leverages a focused set of informative features to achieve swift and accurate DDoS attack detection. By utilizing a more concise data selection, the method reduces overall resource requirements.
In this segment, we introduce UDP-based DDoS attacks and outline the objectives of this study. Section 2 dives deep into the heart of this study: our proposed method for detecting DDoS attacks. It covers all the essential steps. The Overall Approach (Framework), it explains the big picture of our method, laying out the different components that work together. The Step-by-Step Process (Algorithm), it breaks down the method into clear, sequential steps, like a recipe for DDoS attack detection. Preparing the Data (Preprocessing), it discusses how we get the data ready for analysis, ensuring it's in the best shape for our method to work effectively. The Workhorse (Multilayer Perceptron), it introduces the Multilayer Perceptron, a powerful classification tool we use to identify DDoS attacks. Fine-Tuning the Machine (Activation Functions and Optimization Methods), it explores different ways to adjust the Multilayer Perceptron to achieve the best possible performance in detecting attacks. The evaluation metrics for classification, along with the results and discussions based on experimental findings, are detailed in Section 3. Lastly, Section 4 summarizes the key findings and takeaways from this investigation into DDoS attack detection.
The framework of the proposed model is illustrated in Figure 1.
2.1 Dataset
This study utilizes the CICDDoS2019 dataset [8], a comprehensive resource compiled by the Canadian Institute for Cybersecurity at the University of New Brunswick. It comprises eleven distinct DDoS attack datasets provided in PCAP file format. These PCAP files converted into a CSV file format by CICFlowmeter. This study use UDP, UDP-Lag, NTP and TFTP UDP-based DDoS attack datasets. Each dataset contains 87 network traffic features and millions of records. Experiments also performed on customized UDP-based DDoS attack dataset.
2.2 Preprocessing
Before feeding data into a machine learning model, we need to do some prep work. This process, called preprocessing. Preprocessing [9] helps improve the accuracy and efficiency of the model. It involves making data suitable for the model by eliminating socket features that exhibit variability across networks, addressing missing and infinity values to clean the data. Encode the class labels for normal traffic (benign) and attack traffic into a language the model understands. In this case, normal traffic becomes "0" and attack traffic becomes "1". This simplifies things for the model. All the feature values on a similar scale. Standardizing the features ensures they all contribute equally to the model's analysis.
2.3 Feature selection
In this study, relevant features [10] are selected for the model to enhance performance. This is achieved through the use of variance threshold and correlation methods. Remove features that don't provide any useful information. These can be features with no variation (constant) or features that almost never change (quasi-constant). If two features are highly correlated (meaning they move together), consider only one. To find these related features, use three different methods (Pearson, Spearman, and Kendall) and remove features with a correlation score very close to +1 or -1, where these values indicate very strong positive or negative relationships correspondingly.
To measure how closely related two features are, the Pearson correlation coefficient [11] is determined by Eq. (1).
$r=\frac{\sum\left(x_i-\bar{x}\right)\left(y_i-\bar{y}\right)}{\sqrt{\sum\left(x_i-\bar{x}\right)^2 \sum\left(y_i-\bar{y}\right)^2}}$ (1)
where,
xi ,yi: the sample values of the x and y features,
$\bar{x}$ and $\bar{y}$: the mean values of the x and y features,
r: is the correlation coefficient.
The Spearman correlation coefficient [12], similar to Pearson's, measures how related two features are, but it focuses on the order or ranking of the data points rather than their actual values. It is determined by Eq. (2).
$\rho=1-\frac{6 \sum d_i^2}{n\left(n^2-1\right)}$ (2)
where,
n: total observations,
di: variation between the consecutive ranks,
ρ: is correlation coefficient.
The Kendall correlation coefficient [13] assesses the strength and direction of the relationship between two features by considering how often the order of one variable changes in the same (positive correlation) or opposite (negative correlation) direction as the other. It is determined by Eq. (3).
$\tau=\frac{N_c-N_d}{\frac{n(n-1)}{2}}$ (3)
where,
Nc, Nd: the number of concordant and discordant correspondingly,
$\tau$: the correlation coefficient.
2.4 Multilayer perceptron
Imagine a powerful learning machine called a Multilayer Perceptron (MLP) [14]. It works like a complex web of interconnected processing units, similar to the network of neurons in a brain. These processing units are called neurons, and they are grouped into layers. Each neuron in one layer can connect to any neuron in the next layer, allowing for complex information flow. The first layer (input layer) receives raw data from the features we're interested in. The final layer (output layer) acts like a decision maker, with one neuron for tasks like predicting a single value or classifying data into two categories (like normal vs. attack traffic). For more complex classifications with multiple categories, there would be multiple output neurons (one for each category). Layers in between the input and output layers are called hidden layers. These layers play a critical role in learning patterns from the data, but how they work is determined by the training process itself, making them quite adaptable.
Neurons in our Multilayer Perceptron (MLP) [15] are like tiny decision-makers. But how do they decide when to fire up and contribute to the final output? That's where activation functions come in! Activation functions act like gatekeepers, determining whether a neuron should send its signal onward based on the information it receives. This study explores different activation functions, like linear, logistic, Tanh, and ReLU, to see which ones work best for our MLP in detecting DDoS attacks.
The linear activation function is also called the Identity function [16]. In this approach, a neuron's output directly reflects its input. Mathematically, it can be represented as:
$f(x)=x$ (4)
The Logistic Activation Function [17] squeezing information between 0 and 1. As the input increases, the output approaches 1.0, while decreasing input values lead to an output closer to 0.0. This function is commonly utilized in models requiring probabilistic predictions. Mathematically, it can be represented as:
$f(x)=\frac{1}{1+e^{-x}}$ (5)
The Tanh (Hyperbolic Tangent) activation function [18] processes any real value as input and yields an output ranging between -1 and 1. As the input increases, the output tends towards 1.0, and for decreasing input values, it tends towards -1.0. Mathematically, it can be represented as:
$f(x)=\frac{\left(e^x-e^{-x}\right)}{\left(e^x+e^{-x}\right)}$ (6)
The ReLU (Rectified Linear Unit) activation function [19] is a nonlinear function. When the input is positive, it directly outputs the input; otherwise, it outputs zero. Mathematically, it can be represented as:
$f(x)=\max (0, x)$ (7)
This research investigates how different optimization techniques can improve a neural network's ability to detect DDoS attacks. Optimization, in this context, refers to fine-tuning the network's internal settings to achieve the best possible performance. The study compares three specific optimization methods SGD, L-BFGS, and ADAM [20] used in conjunction with a multilayer perceptron classifier to see which one yields the most effective DDoS attack detection system.
This study examines SGD [21] as a potential optimization method for DDoS attack detection using a neural network. SGD is known for its efficiency in training large machine learning models, particularly those involving linear classifiers and convex loss functions. It's also praised for its ease of implementation. However, SGD requires careful adjustment of internal settings (hyperparameters) and the number of training cycles to achieve optimal results. Additionally, its performance can be affected by the way data features are scaled.
The LBFGS method [22] is like a smart assistant helping us train our neural network. It belongs to a group of optimization methods called "quasi-Newton” optimization methods, designed to operate within constrained computer memory resources. It is particularly well-suited for addressing problems characterized by a high number of features. Unlike SGD, LBFGS does not necessitate extensive hyperparameter tuning. However, it does consume more memory and typically requires a greater number of iterations in comparison to SGD.
This research explores ADAM as an optimization technique for the neural network used in DDoS attack detection. ADAM combines momentum, a method that helps the network navigate training challenges, with Root Mean Squared Propagation (RMSP), which tackles issues like vanishing learning rates. Praised for its fast learning and efficiency, ADAM is often the default choice for training Multilayer Perceptron (MLP) classifiers. However, it requires more computational resources compared to other optimization methods.
This study conducts experiments utilizing the Python programming language along with libraries such as sklearn.neural_network, pandas, and numpy for processing MLP classification algorithms. Visualization of the ROC-AUC curve is facilitated using matplotlib and seaborn libraries. The experiments are conducted on Google Colaboratory (Colab) provided a cloud-based platform with 25 GB of RAM and a special processing unit called a TPU (Tensor Processing Unit) to accelerate the training process. Additionally, The CICFlowMeter network traffic flow generator tool played a crucial role in converting raw network traffic data stored in PCAP files into a more usable format (CSV files) for analysis by the MLP.
Figure 1. Proposed model framework
This study investigates how to optimize a MLP classifier for accurate and efficient detection of UDP-based DDoS attacks. We explore different optimization methods and activation functions to achieve high attack detection accuracy while minimizing data processing and execution time. The research also examines the impact of reducing features in the input data on both accuracy and processing speed. To speed up how quickly the model can identify attacks, we preprocess the data by streamlining the features. This means reducing the number of data points the model needs to analyze without sacrificing accuracy. Consequently, decreasing data computation time also leads to a significant reduction in execution time. Figure 1 outlines proposed approach to balancing accuracy and efficiency. We're developing a model that reduces the amount of data the system needs to analyze features while maintaining its ability to accurately detect DDoS attacks. Datasets containing UDP-based DDoS attacks from the CICDDoS2019 collection. This dataset includes a variety of both TCP and UDP-based DDoS attack types. To see how well model performs, execute experiments using datasets containing different types of UDP-based DDoS attacks. These included UDP flood, UDP-Lag, NTP, and TFTP attacks. Building a broader test, this study constructed a custom dataset. This combined data from UDP attack types (UDP flood, UDP-Lag, NTP, TFTP) to simulate a more real-world scenario with mixed threats.
This section dives into the analysis of the results. First, we examine the impact of removing features with little variation constant and quasi-constant using a technique called variance thresholding. Next, we explore how well features relate to each other correlation using three methods: Pearson, Spearman, and Kendall. We then identify features that are consistently uncorrelated across all three methods. Finally, we evaluate the performance of the algorithms based on standard classification metrics.
This section details a novel feature selection method used to improve efficiency in DDoS attack detection. After initial data cleaning, we removed features with minimal variation to reduce the overall number analyzed. Next, we employed three separate correlation techniques Pearson, Spearman, and Kendall on the UDP-based DDoS datasets. Each method identified unique sets of uncorrelated features. We then looked for features that consistently appeared as uncorrelated across all three methods. This approach prioritizes highly informative features, reducing computational burden due to the smaller feature set. Table 1 summarizes the number of commonly identified uncorrelated features across the datasets. Interestingly, features like "Flow IAT Min," "Flow Duration," and various traffic volume metrics consistently emerged as uncorrelated across multiple attack types (NTP, TFTP, UDP, and UDP-Lag). Finally, we evaluated the effectiveness of Multilayer Perceptron (MLP) classifiers with different optimization methods and activation functions on all datasets UDP, UDP Lag, NTP, TFTP, and a bespoke dataset using these identified uncorrelated feature sets.
Table 1. The count of common uncorrelated features across the datasets
|
Data Set |
Count |
|
UDP Flood |
12 |
|
UDP-Lag |
12 |
|
NTP |
11 |
|
TFTP |
11 |
|
Customized |
14 |
3.1 Evaluation metrics of classification algorithms
This study uses the following evaluation metrics for results of UDP-based DDoS attacks detection.
$A C C U R A C Y=\frac{T P+T N}{T P+T N+F P+F N}$ (8)
$P R E C I S I O N=\frac{T P}{T P+F P}$ (9)
$R E C A L L=\frac{T P}{T P+F N}$ (10)
$F 1-S C O R E=\frac{2 * P R E C I S I O N * R E C A L L}{P R E C I S I O N+R E C A L L}$ (11)
$S P E C I F I C I T Y=\frac{T N}{T N+F P}$ (12)
$L O G-L O S S=-\frac{1}{N} \sum_{I=1}^N\left[y_i \ln p_i+\left(1-y_i\right) \ln \left(1-p_i\right)\right]$ (13)
In the given context, "N" represents the total number of observations, "p" denotes the predicted probability, and "y" signifies the actual value.
Accuracy specifies the amount of correct classifications out of all classification results. Precision specifies how much classifier predictions are correctly classified. Recall measures the proportion of actual correct classes that are correctly classified by the classifier. The F1 score is the harmonic mean of precision and recall. Log loss quantifies the disparity between the actual classification outcomes and the model's predicted classification results. Furthermore, the results are assessed using K-fold cross-validation and ROC-AUC score. In K-fold cross-validation, the dataset is divided into k smaller subsets. Each model is trained on k-1 folds and tested on the remaining fold, repeating this process until all folds have been used for testing. The ROC-AUC score plots the true positive rate against the false positive rate across variance threshold values. ROC scores indicate the area under the curve, with values ranging from 0 to 1, where 1 denotes the best score and 0 indicates poor model performance.
3.2 Results and Discussion
3.2.1 Results and Discussion on UDP dataset
UDP-flood attacks detection, MLP model utilizing the ADAM optimization approach and Tanh activation function achieves the highest overall accuracy and K-fold cross-validation accuracy, both exhibiting very low standard deviation. Table 2 illustrates the accuracy results for identifying UDP-flood DDoS attacks. MLP with the LBFGS optimization method yields superior K-fold cross-validation accuracy compared to overall accuracy. Meanwhile, MLP with SGD and ADAM optimization methods produce identical accuracy values for both overall and K-fold cross-validation. Notably, MLP models with SGD and ADAM optimization methods consistently deliver identical accuracy values across both overall and K-fold cross-validation scenarios. For smaller datasets, LBFGS optimization demonstrates respectable performance, while SGD and ADAM optimization methods exhibit robust results irrespective of dataset size. Additionally, the ReLU activation function yields consistent accuracy values for both overall and K-fold cross-validation. MLP models with activation functions generally outperform those without activation functions (e.g., identity activation).
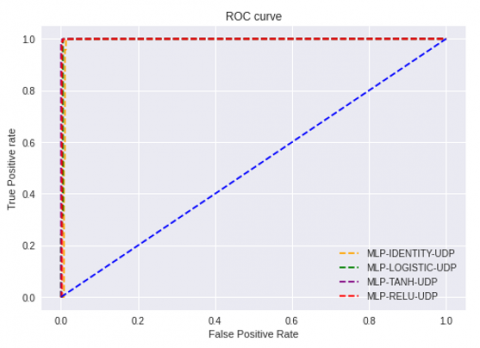
Figure 2. ROC-curves of the MLP with LBFGS optimization method with different activation functions on UDP dataset
Table 2. The accuracy of the overall model and K-fold cross-validation, presented as percentages with standard deviation, for MLP utilizing various optimization techniques and activation functions on UDP flood attack with the common uncorrelated feature subset
|
|
LBFGS |
SGD |
ADAM |
|||
|
|
Accuracy |
Validation Accuracy |
Accuracy |
Validation Accuracy |
Accuracy |
Validation Accuracy |
|
identity |
99.90 |
99.9314% (0.0075%) |
99.90 |
99.9216% (0.0079%) |
99.92 |
99.9262% (0.0064%) |
|
logistic |
99.93 |
99.9577% (0.0067%) |
99.91 |
99.9063% (0.0070%) |
99.95 |
99.9575% (0.0074%) |
|
tanh |
99.95 |
99.9637% (0.0048%) |
99.94 |
99.9538% (0.0053%) |
99.97 |
99.9642% (0.0047%) |
|
ReLU |
99.94 |
99.9468% (0.0177%) |
99.94 |
99.9468% (0.0177%) |
99.96 |
99.9633% (0.0033%) |
Table 3. Classification evaluation metrics of MLP employing diverse optimization techniques and activation functions for detecting UDP flood attacks, utilizing the common uncorrelated feature subset
|
|
LBFGS |
|||
|
|
Precision |
Recall |
F1-Score |
Specificity |
|
Identity |
1.00 |
1.00 |
1.00 |
0.52 |
|
Logistic |
1.00 |
1.00 |
1.00 |
0.76 |
|
Tanh |
1.00 |
1.00 |
1.00 |
0.78 |
|
ReLU |
1.00 |
1.00 |
1.00 |
0.72 |
|
|
SGD |
|||
|
|
Precision |
Recall |
F1-Score |
Specificity |
|
Identity |
1.00 |
1.00 |
1.00 |
0.55 |
|
Logistic |
1.00 |
1.00 |
1.00 |
0.62 |
|
Tanh |
1.00 |
1.00 |
1.00 |
0.75 |
|
ReLU |
1.00 |
1.00 |
1.00 |
0.72 |
|
|
ADAM |
|||
|
|
Precision |
Recall |
F1-Score |
Specificity |
|
Identity |
1.00 |
1.00 |
1.00 |
0.55 |
|
Logistic |
1.00 |
1.00 |
1.00 |
0.78 |
|
Tanh |
1.00 |
1.00 |
1.00 |
0.84 |
|
ReLU |
1.00 |
1.00 |
1.00 |
0.81 |
Table 4. ROC, log-loss scores of MLP employing various optimization techniques and activation functions for detecting UDP flood attacks, utilizing the common uncorrelated feature subset
|
|
LBFGS |
SGD |
ADAM |
|||
|
|
ROC |
Log-loss |
ROC-AUC |
Log-loss |
ROC-AUC |
Log-loss |
|
Identity |
0.99624335 |
0.03336252 |
0.99625977 |
0.03496641 |
0.99085721 |
0.02871106 |
|
Logistic |
0.99477902 |
0.02341777 |
0.99504135 |
0.02983372 |
0.99626906 |
0.01603965 |
|
Tanh |
0.99657918 |
0.01668122 |
0.99980612 |
0.01988914 |
0.99991359 |
0.01186934 |
|
ReLU |
0.99489425 |
0.02020997 |
0.99489425 |
0.02020997 |
0.99736743 |
0.01283174 |
Figure 3. ROC-curves of the MLP with SGD optimization method with different activation functions on UDP dataset
Table 3 showcases the performance of Multilayer Perceptron (MLP) classifiers for UDP flood attack detection using the identified common uncorrelated features. The table presents precision, recall, and F1-score metrics for various optimization techniques and activation functions employed with the MLP model. Notably, MLP consistently delivers strong performance across all optimization methods, with or without activation functions, when detecting UDP flood DDoS attacks. Interestingly, the combination of ADAM optimization and tanh activation function yielded the best specificity is ability to correctly identify normal traffic for the UDP flood attack dataset. Conversely, LBFGS optimization without an activation function resulted in a lower specificity compared to other configurations.
Figure 4. ROC-curves of the MLP ADAM optimization method with different activation functions on UDP dataset
Log loss and ROC values of MLP, employing various optimization techniques and activation functions, are presented in Table 4 for detecting UDP flood attacks using the common uncorrelated feature subset. Among the activation functions, MLP with the tanh activation function demonstrates the best log-loss values across all optimization methods on the UDP dataset. Furthermore, MLP with the ADAM optimization method and tanh activation function outperforms others in terms of log-loss values on the UDP-flood dataset. Additionally, MLP with the ADAM optimization method and tanh activation function yields superior ROC-AUC scores compared to other configurations on the UDP-flood dataset. The ROC curves of MLP classification algorithms with LBFGS, SGD, and ADAM optimization methods, along with different activation functions, for UDP flood attack detection are illustrated from Figures 2-4.
3.2.2 Results and discussion on UDP-Lag DDoS attack dataset
For detecting UDP-Lag DDoS attacks, the MLP model utilizing the ADAM optimization approach and Tanh activation function exhibits the highest overall accuracy and K-fold cross-validation accuracy, accompanied by very low standard deviation. However, these two accuracy values are not identical. Conversely, MLP employing the LBFGS optimization approach and logistic activation function demonstrates subpar overall accuracy but improved K-fold cross-validation accuracy in UDP-Lag DDoS attack detection. The accuracy results for detecting the UDP-Lag DDoS attack dataset are presented in Table 5.
The precision, recall, and F1-score metrics for MLP with various optimization techniques and activation functions are provided in Table 6 for UDP-Lag attack detection, utilizing the common uncorrelated feature subset. Across all optimization techniques, MLP with ADAM optimization consistently achieves the highest precision, recall, and F1-score values, regardless of the presence of activation functions, on the UDP-Lag dataset. Notably, for the UDP-Lag dataset, the combination of ADAM optimization and logistic activation function yields superior specificity values, while SGD optimization with logistic and ReLU activation functions results in zero specificity values.
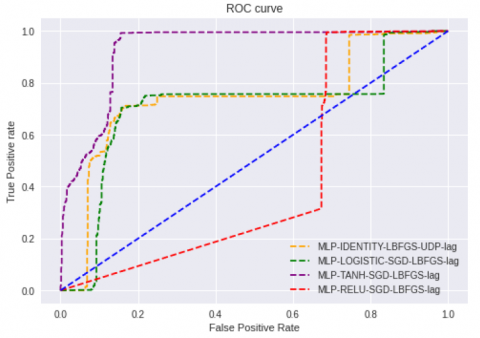
Log-loss and ROC values of MLP employing various optimization techniques and activation functions for UDP-Lag attack detection are outlined in Table 7. MLP utilizing the ADAM optimization method and tanh activation function outperforms others in terms of log-loss values on the UDP-Lag dataset. Conversely, MLP with LBFGS optimization method and logistic activation function exhibits inferior log-loss values compared to others on the UDP-Lag dataset. Additionally, MLP with the ADAM optimization method and tanh activation function achieves superior ROC-AUC scores compared to other configurations on UDP-Lag dataset. ROC curves illustrating the performance of MLP classification algorithms with LBFGS, SGD, and ADAM optimization methods, along with different activation functions, for UDP-Lag attack detection are depicted from Figures 5-7.
3.2.3 Results and Discussion on NTP DDoS attack dataset
In the detection of NTP DDoS attacks, the MLP model achieves the highest overall accuracy with the LBFGS optimization approach and ReLU activation function, while it achieves the best K-fold cross-validation accuracy with the tanh activation function. The accuracy results for detecting NTP DDoS attacks are presented in Table 8.
Table 5. Overall model accuracy and K-fold cross-validation accuracy score (with a standard deviation) in % of the MLP with different optimization techniques and different activation functions on UDP-Lag attack using common uncorrelated feature subset
|
|
LBFGS |
SGD |
ADAM |
|||
|
|
Accuracy |
Validation Accuracy |
Accuracy |
Validation Accuracy |
Accuracy |
Validation Accuracy |
|
Identity |
95.90 |
98.9528% (0.1409%) |
96.32 |
99.0415% (0.1260%) |
99.24 |
99.1168% (0.1104%) |
|
Logistic |
75.57 |
99.7002% (0.0665%) |
96.40 |
99.2741% (0.0436%) |
99.54 |
99.4650% (0.0529%) |
|
Tanh |
97.67 |
99.7083% (0.0688%) |
96.34 |
99.3386% (0.0504%) |
99.77 |
99.6868% (0.0598%) |
|
ReLU |
97.06 |
99.7002% (0.0602%) |
96.40 |
99.3346% (0.0456%) |
99.46 |
99.6626% (0.0484%) |
Table 6. Classification evaluation metrics of the MLP with different optimization techniques and different activation functions on UDP-Lag attack using the common uncorrelated feature subset
|
|
LBFGS |
|||
|
|
Precision |
Recall |
F1-Score |
Specificity |
|
Identity |
0.97 |
0.99 |
0.98 |
0.04 |
|
Logistic |
0.99 |
0.76 |
0.86 |
0.74 |
|
Tanh |
0.99 |
0.98 |
0.99 |
0.84 |
|
ReLU |
0.97 |
1 |
0.98 |
0.31 |
|
|
SGD |
|||
|
|
Precision |
Recall |
F1-Score |
Specificity |
|
Identity |
0.96 |
1 |
0.98 |
0.03 |
|
Logistic |
0.96 |
1 |
0.98 |
0 |
|
Tanh |
0.96 |
1 |
0.98 |
0.02 |
|
ReLU |
0.96 |
1 |
0.98 |
0 |
|
|
ADAM |
|||
|
|
Precision |
Recall |
F1-Score |
Specificity |
|
Identity |
1 |
0.99 |
1 |
0.94 |
|
Logistic |
1 |
1 |
1 |
0.99 |
|
Tanh |
1 |
1 |
1 |
0.96 |
|
ReLU |
0.99 |
1 |
1 |
0.86 |
Table 7. ROC-AUC score, and Log-loss value of the MLP with different optimization techniques and different activation functions on UDP-Lag attack using the common uncorrelated feature subset.
|
|
LBFGS |
SGD |
ADAM |
|||
|
|
ROC |
Log-loss |
ROC-AUC |
Log-loss |
ROC-AUC |
Log-loss |
|
Identity |
0.73970459 |
1.41701261 |
0.66856372 |
1.27215739 |
0.99352817 |
0.26185604 |
|
Logistic |
0.70830944 |
0.43877508 |
0.99928304 |
1.24430132 |
0.99928304 |
0.15971281 |
|
Tanh |
0.92919776 |
0.80413879 |
0.75354777 |
1.26287186 |
0.99968980 |
0.07985737 |
|
ReLU |
0.42910718 |
1.01586614 |
0.39875022 |
1.24430132 |
0.99957816 |
0.18757353 |
The precision, recall, and F1-score metrics for MLP employing various optimization techniques and activation functions on NTP attack, utilizing the common uncorrelated feature subset, are illustrated in Table 9. MLP consistently achieves superior precision, recall, and F1-score values across all optimization techniques, regardless of the presence of activation functions, for detecting NTP DDoS attacks. Notably, on an NTP DDoS attack dataset, MLP with SGD optimization without activation function yields the best specificity value, while ADAM optimization with tanh activation function demonstrates poorer specificity compared to others.
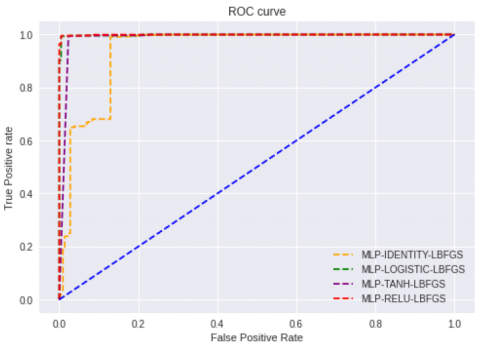
Log-loss and ROC values of MLP utilizing various optimization techniques and activation functions for NTP attack detection are outlined in Table 10. MLP employing the LBFGS optimization method and ReLU activation function outperforms others in terms of log-loss scores on the NTP dataset. Additionally, MLP with LBFGS optimization method and ReLU activation function achieves a superior ROC-AUC score compared to other configurations on the NTP DDoS attack dataset. The ROC curves depicting the performance of MLP classification algorithms with LBFGS, SGD, and ADAM optimization methods, along with different activation functions, for NTP attack detection are illustrated from Figures 8-10.
3.2.4 Results and Discussion on TFTP DDoS attack dataset
In detecting TFTP DDoS attacks, the MLP model achieves the highest overall accuracy with the LBFGS optimization approach and ReLU activation function, while it achieves highest KFC validation accuracy using the tanh activation function. The accuracy results for detecting TFTP attacks are presented in Table 11.
Table 8. Overall model accuracy and K-fold cross-validation accuracy score (with a standard deviation) in % of the MLP with different optimization techniques and different activation functions on NTP attack using common uncorrelated feature subset
|
|
LBFGS |
SGD |
ADAM |
|||
|
|
Accuracy |
Validation Accuracy |
Accuracy |
Validation Accuracy |
Accuracy |
Validation Accuracy |
|
Identity |
99.71 |
99.6909% (0.0056%) |
99.72 |
99.6970% (0.0082%) |
99.71 |
99.6978% (0.0092%) |
|
Logistic |
99.72 |
99.7203% (0.0138%) |
99.68 |
99.6709% (0.0070%) |
99.80 |
99.7873% (0.0109%) |
|
Tanh |
99.71 |
99.8536% (0.0209%) |
99.76 |
99.7373% (0.0117%) |
99.70 |
99.7960% (0.0121%) |
|
ReLU |
99.87 |
99.8060% (0.0140%) |
99.74 |
99.7323% (0.0111%) |
99.83 |
99.7939% (0.0094%) |
Table 9. Classification evaluation metrics of the MLP with different optimization techniques and different activation functions on NTP attack using the common uncorrelated feature subset
|
|
LBFGS |
|||
|
|
Precision |
Recall |
F1-Score |
Specificity |
|
Identity |
1.00 |
1.00 |
1.00 |
0.99 |
|
Logistic |
1.00 |
1.00 |
1.00 |
0.94 |
|
Tanh |
1.00 |
1.00 |
1.00 |
0.76 |
|
ReLU |
1.00 |
1.00 |
1.00 |
0.94 |
|
|
SGD |
|||
|
|
Precision |
Recall |
F1-Score |
Specificity |
|
Identity |
1.00 |
1.00 |
1.00 |
1.00 |
|
Logistic |
1.00 |
1.00 |
1.00 |
0.95 |
|
Tanh |
1.00 |
1.00 |
1.00 |
0.97 |
|
ReLU |
1.00 |
1.00 |
1.00 |
0.94 |
|
|
ADAM |
|||
|
|
Precision |
Recall |
F1-Score |
Specificity |
|
Identity |
1.00 |
1.00 |
1.00 |
0.98 |
|
Logistic |
1.00 |
1.00 |
1.00 |
0.98 |
|
Tanh |
1.00 |
1.00 |
1.00 |
0.75 |
|
ReLU |
1.00 |
1.00 |
1.00 |
0.98 |
Table 10. ROC-AUC score, and Log-loss value of the MLP with different optimization techniques and different activation functions on NTP attack using the common uncorrelated feature subset
|
|
LBFGS |
SGD |
ADAM |
|||
|
|
ROC |
Log-loss |
ROC-AUC |
Log-loss |
ROC-AUC |
Log-loss |
|
Identity |
0.9982014954167338 |
0.1002894319962382 |
0.9983914075398773 |
0.09798913347621446 |
0.9982863056290869 |
0.10120954927418421 |
|
Logistic |
0.998906497773897 |
0.0966094776497956 |
0.9992082071253128 |
0.11148415848524285 |
0.9994775714922742 |
0.07008000636121194 |
|
Tanh |
0.9997592411840928 |
0.09921806172621693 |
0.9994300767446267 |
0.08357467990976582 |
0.9995689827218632 |
0.10473866599093051 |
|
ReLU |
0.9997655352968907 |
0.046464724375566056 |
0.9993849943687322 |
0.09078227767904656 |
0.9996872455179264 |
0.05949907125215883 |
Figure 5. ROC-curves of the MLP with LBFGS optimization method with different activation functions on UDP-Lag attack
Figure 6. ROC-curves of the MLP with SGD optimization method with different activation functions on UDP-Lag attack
Figure 7. ROC-curves of the MLP with ADAM optimization method with different activation functions on UDP-Lag attack
Figure 8. ROC-curves of the MLP with LBFGS optimization method with different activation functions on NTP attack
Figure 9. ROC-curves of the MLP with SGD optimization method with different activation functions on NTP attack
Figure 10. ROC-curves of the MLP with ADAM optimization method with different activation functions on NTP attack
The precision, recall, and F1-score metrics for MLP employing various optimization techniques and activation functions on TFTP attack, utilizing the common uncorrelated feature subset, are displayed in Table 12. MLP consistently achieves superior precision, recall, and F1-score values across all optimization techniques, regardless of the presence of activation functions, for detecting TFTP attacks. Notably, on the TFTP dataset, MLP with the combination of LBFGS optimization and tanh activation function yields better specificity values, while SGD optimization with logistic activation function results in poorer specificity compared to others.
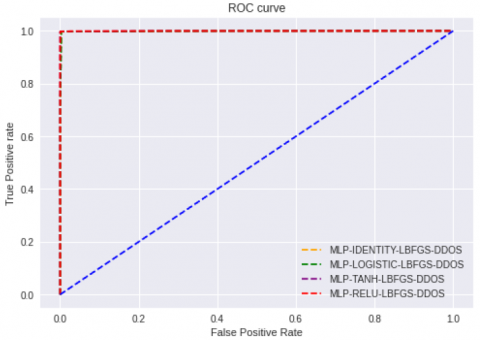
Log-loss and ROC scores with MLP utilizing various optimization techniques and activation functions for TFTP attack detection are presented in Table 13. MLP employing the LBFGS optimization method and ReLU activation function outperforms others in terms of log-loss values on the TFTP dataset. Additionally, MLP with the ADAM optimization method and ReLU activation function achieves a superior ROC-AUC score compared to other configurations on the TFTP dataset. The ROC curves illustrating the performance of MLP classification algorithms with LBFGS, SGD, and ADAM optimization methods, along with different activation functions, for TFTP attack detection are depicted from Figures 11-13.
Table 11. Overall model accuracy and K-fold cross-validation accuracy score (with a standard deviation) in % of the MLP with different optimization techniques and different activation functions on TFTP attack using common uncorrelated feature subset
|
|
LBFGS |
SGD |
ADAM |
|||
|
|
Accuracy |
Validation Accuracy |
Accuracy |
Validation Accuracy |
Accuracy |
Validation Accuracy |
|
Identity |
99.92 |
99.9080% (0.0134%) |
99.83 |
99.8302% (0.0051%) |
99.91 |
99.8884% (0.0311%) |
|
Logistic |
99.92 |
99.9265% (0.0080%) |
99.81 |
99.8049% (0.0067% |
99.93 |
99.9306% (0.0053%) |
|
Tanh |
99.63 |
99.9602% (0.0133%) |
99.91 |
99.9028% (0.0101%) |
99.93 |
99.9403% (0.0089%) |
|
ReLU |
99.95 |
99.9533% (0.0132%) |
99.91 |
99.9051% (0.0069%) |
99.93 |
99.9472% (0.0066%) |
Table 12. Classification evaluation metrics of the MLP with different optimization techniques and different activation functions on TFTP attack using the common uncorrelated feature subset
|
|
LBFGS |
SGD |
ADAM |
|||||||||
|
|
Precision |
Recall |
F1-Score |
Specificity |
Precision |
Recall |
F1-Score |
Specificity |
Precision |
Recall |
F1-Score |
Specificity |
|
Identity |
1.00 |
1.00 |
1.00 |
0.72 |
1.00 |
1.00 |
1.00 |
0.19 |
1.00 |
1.00 |
1.00 |
0.60 |
|
Logistic |
1.00 |
1.00 |
1.00 |
0.64 |
1.00 |
1.00 |
1.00 |
0.08 |
1.00 |
1.00 |
1.00 |
0.70 |
|
Tanh |
1.00 |
1.00 |
1.00 |
0.89 |
1.00 |
1.00 |
1.00 |
0.59 |
1.00 |
1.00 |
1.00 |
0.70 |
|
ReLU |
1.00 |
1.00 |
1.00 |
0.83 |
1.00 |
1.00 |
1.00 |
0.59 |
1.00 |
1.00 |
1.00 |
0.71 |
Table 13. ROC-AUC score, and Log-loss value of the MLP with different optimization techniques and different activation functions on TFTP attack using the common uncorrelated feature subset
|
|
LBFGS |
SGD |
ADAM |
|||
|
|
ROC |
Log-loss |
ROC-AUC |
Log-loss |
ROC-AUC |
Log-loss |
|
Identity |
0.9421633408325975 |
0.026107319356903545 |
0.9738537303854027 |
0.059134943049086425 |
0.930613494045368 |
0.032083790261617444 |
|
Logistic |
0.9986909449850065 |
0.028623776449010867 |
0.9765062697768166 |
0.0663695478358836 |
0.999307969835317 |
0.02453465200429941 |
|
Tanh |
0.9875212363680852 |
0.1289618832337812 |
0.9986381392159467 |
0.03239834557766988 |
0.9994648663363476 |
0.023905563217726133 |
|
ReLU |
0.9994559527225304 |
0.017929092313012245 |
0.9884061132013747 |
0.03145472332057578 |
0.9996418712742362 |
0.023591007901673688 |
Figure 11. ROC-curves of the MLP with LBFGS optimization method with different activation functions on TFTP attack
Figure 12. ROC-curves of the MLP with SGD optimization method with different activation functions on TFTP attack
Figure 13. ROC-curves of the MLP with ADAM optimization method with different activation functions on TFTP attack
This research evaluated how well a Multilayer Perceptron (MLP), a type of artificial neural network, could classify between regular traffic and various forms of UDP-based DDoS attacks. This study tested different MLP configurations to see which worked best for accurate attack detection. These configurations included different attack types, MLP optimizations and activation functions. This study examined five different DDoS attacks such as UDP Flood, UDP-Lag, NTP, TFTP, and a custom dataset combining these attacks. This study explored three optimization methods (LBFGS, SGD, ADAM) that fine-tune the MLP's internal workings for better performance. This study tested four activation functions (Identity, Logistic, Tanh, ReLU) that influence how the MLP interprets information. A feature selection approach was proposed for the classifier, focusing on selecting common uncorrelated features through the overlapping sets of features that are uncorrelated according to Pearson, Spearman, and Kendall methods across DDoS datasets Results indicated that MLP classifier with ADAM optimization method and Tanh activation function yielded superior performance on UDP Flood and UDP-Lag DDoS attack datasets due to its faster convergence nature. Conversely, MLP classifier with LBFGS optimization method and ReLU activation function demonstrated better results on NTP and TFTP DDoS attack datasets. Furthermore, MLP classifier with ADAM optimization method and Tanh activation function showcased improved results on the customized UDP-based DDoS attack dataset, as well as on customized NTP and TFTP DDoS attack datasets. Consequently, the MLP classifier with ADAM optimization method and Tanh activation function emerged as the most suitable choice for UDP-based DDoS attack detection. These research findings are instrumental in early and accurate detection of DDoS attacks, thereby mitigating potential consequences. As an extension of this research, future plans include exploring MLP classification algorithms with features selected via KPCA (Kernel Principal Component Analysis) for dimensionality reduction in DDoS attack detection.
[1] Buczak, A.L., Guven, E. (2015). A survey of data mining and machine learning methods for cyber security intrusion detection. IEEE Communications Surveys & Tutorials, 18(2): 1153-1176. https://doi.org/10.1109/COMST.2015.2494502
[2] Dasari, K.B., Devarakonda, N. (2022). TCP/UDP-based exploitation DDoS attacks detection using AI classification algorithms with common uncorrelated feature subset selected by Pearson, Spearman and Kendall correlation methods. Revue d'Intelligence Artificielle, 36(1): 61-71. https://doi.org/10.18280/ria.360107
[3] Patil, N.V., Krishna, C.R., Kumar, K. (2022). SSK-DDoS: distributed stream processing framework based classification system for DDoS attacks. Cluster Computing, 25(2): 1355-1372. https://doi.org/10.1007/s10586-022-03538-x
[4] Dasari, K.B., Devarakonda, N. (2021). Detection of different DDoS attacks using machine learning classification algorithms. Ingénierie des Systèmes d’Information, 26(5): 461-468. http://doi.org/10.18280/isi.260505
[5] Wang, X., Xie, X. (2022). Research on NTP nonlinear reflection attack identification based on AHP multidimensional matrix in global COVID-19 environment. Wireless Communications and Mobile Computing, 2022(1): 1581054. https://doi.org/10.1155/2022/1581054
[6] Yang, T., Wang, W., Liu, Y., Zhou, H. (2021). Multi-class DRDoS attack detection method based on feature selection. Research Briefs on Information and Communication Technology Evolution, 7: 173-187. https://doi.org/10.56801/rebicte.v7i.127
[7] Bouyeddou, B., Kadri, B., Harrou, F., Sun, Y. (2020). DDOS-attacks detection using an efficient measurement-based statistical mechanism. Engineering Science and Technology, an International Journal, 23(4): 870-878. https://doi.org/10.1016/j.jestch.2020.05.002
[8] Sharafaldin, I., Lashkari, A. H., Hakak, S., Ghorbani, A. A. (2019). Developing realistic distributed denial of service (DDoS) attack dataset and taxonomy. In 2019 International Carnahan Conference on Security Technology (ICCST), Chennai, India, pp. 1-8. https://doi.org/10.1109/CCST.2019.8888419
[9] Batchu, R.K., Seetha, H. (2021). A generalized machine learning model for DDoS attacks detection using hybrid feature selection and hyperparameter tuning. Computer Networks, 200: 108498. https://doi.org/10.1016/J.COMNET.2021.108498
[10] Dasari, K.B., Devarakonda, N. (2022). Detection of TCP-based DDoS attacks with SVM classification with different kernel functions using common uncorrelated feature subsets. International Journal of Safety and Security Engineering, 12(2): 239-249. https://doi.org/10.18280/ijsse.120213
[11] Pandey, N., Mishra, P. K. (2023). Detection of DDoS attack in IoT traffic using ensemble machine learning techniques. Networks & Heterogeneous Media, 18(4): 1393-1408. https://doi.org/10.3934/nhm.2023061
[12] Bakhtiar, A., Suliantoro, H., Ningsi, R.H., Pitipaldi, K. (2021). Relationship of quality management system standards to industrial property rights in Indonesia using Spearman correlation analysis method. In IOP Conference Series: Earth and Environmental Science, 623(1): 012092. https://doi.org/10.1088/1755-1315/623/1/012092
[13] Windarto, Y.E. (2020). Analisis penyakit kardiovaskular menggunakan metode korelasi pearson, spearman dan kendall. Jurnal Saintekom: Sains, Teknologi, Komputer dan Manajemen, 10(2): 119-127. https://doi.org/10.33020/saintekom.v10i2.149
[14] Ahmed, S., Khan, Z.A., Mohsin, S.M., Latif, S., Aslam, S., Mujlid, H., Najam, Z. (2023). Effective and efficient DDoS attack detection using deep learning algorithm, multi-layer perceptron. Future Internet, 15(2): 76. https://doi.org/10.3390/fi15020076
[15] Apicella, A., Donnarumma, F., Isgrò, F., Prevete, R. (2021). A survey on modern trainable activation functions. Neural Networks, 138: 14-32. https://doi.org/10.1016/j.neunet.2021.01.026
[16] Wang, X., Ren, H., Wang, A. (2022). Smish: A novel activation function for deep learning methods. Electronics, 11(4): 540. https://doi.org/10.3390/electronics11040540
[17] Vijayaprabakaran, K., Sathiyamurthy, K. (2022). Towards activation function search for long short-term model network: A differential evolution based approach. Journal of King Saud University-Computer and Information Sciences, 34(6): 2637-2650. https://doi.org/10.1016/j.jksuci.2020.04.015
[18] Liu, K., Shi, W., Huang, C., Zeng, D. (2023). Cost effective Tanh activation function circuits based on fast piecewise linear logic. Microelectronics Journal, 138: 105821. https://doi.org/10.1016/j.mejo.2023.105821
[19] Bingham, G., Miikkulainen, R. (2022). Discovering parametric activation functions. Neural Networks, 148: 48-65. https://doi.org/10.1016/j.neunet.2022.01.001
[20] Salem, H., Kabeel, A.E., El-Said, E.M., Elzeki, O.M. (2022). Predictive modelling for solar power-driven hybrid desalination system using artificial neural network regression with ADAM optimization. Desalination, 522: 115411. https://doi.org/10.1016/j.desal.2021.115411
[21] Zhou, Y., Liang, Y., Zhang, H. (2022). Understanding generalization error of SGD in nonconvex optimization. Machine Learning, 111(1): 345-375. https://doi.org/10.1007/s10994-021-06056-w
[22] Kurian, S.M., Juliet, S. (2023). An automatic and intelligent brain tumor detection using Lee sigma filtered histogram segmentation model. Soft Computing, 27(18): 13305-13319. https://doi.org/10.1007/s00500-022-07457-2