Jyothi Honnegowda![]() | Komala Mallikarjunaiah
| Komala Mallikarjunaiah![]() | Mallikarjunaswamy Srikantaswamy*
| Mallikarjunaswamy Srikantaswamy*![]()
© 2024 The authors. This article is published by IIETA and is licensed under the CC BY 4.0 license (http://creativecommons.org/licenses/by/4.0/).
OPEN ACCESS
Video surveillance captures a vast number of normal and abnormal events worldwide. During this process, some attenuation occurs. Due to this phenomenon, inaccurate labelling of abnormal events and normal events happens and is difficult to identify, and these large events are presented in a Gaussian distribution. In the Gaussian distribution, more events are normal, and very few are abnormal events. With this information, it is very difficult to identify the abnormal events. Hence, the proposed method utilises deep learning technology to construct the hidden layer representation of the normal sample in a Gaussian distribution using a reconfigurable encoder (RAE). For video surveillance, the proposed methods use a deep learning-based reconfigurable autoencoder that improves the accuracy of finding anomalies and the ability to adapt to different video inputs. It processes video streams in real-time, enabling swift identification and response to security threats, representing a significant improvement in surveillance capabilities. It effectively addresses this issue. Consulting datasets, such as the University of California, San Diego (UCSD) data sets and the Avenue dataset, achieve this activity. We have used the proposed method to detect normal and abnormal events based on the threshold. According to the simulation results, the proposed method shows better performance than the conventional method. Our proposed method achieved frame-level AUCs of 93.7% and 83.56% at an average speed of 575 frames per second, demonstrating its success and efficiency compared to conventional methods.
deep learning, reconfigurable autoencoder (RAE), frame-level AUC, University of California, San Diego (UCSD) data sets, avenue dataset, video surveillance
Digital cameras with improved features and increased memory largely due to latest advances in chip design, have replaced the original analog cameras. The latest enhancements in chip technology have decreased the cost of ICs used in digital cameras making them affordable to everyone. Increased affordability has increased its use by private businesses such as retail shops, malls etc. and public services such as museums, banks, airports, etc. for surveillance. We live in a time where video surveillance is extensively used to ensure safety of the people and to reduce crime. Due to this widespread usage of video surveillance, there is a huge amount of data generated from these video surveillance cameras. As per his Data Display [1], the video data generated from the video surveillance cameras installed on or before 2016 is about 566 GB per day. It also estimates that due to the increasing use of surveillance cameras the video data produced per day by the surveillance cameras will increase to 3500 GB per day by 2023. It is a staggering task to assess this vast amount of video data manually. Intelligent surveillance technology is necessary for video comprehension, organized processing and analysis of this huge data. One of the core components of an efficient automatic AI monitoring technology is abnormal event detection which identifies a small number of inconsistent anomalous occurrences among the most typical occurrences in huge surveillance video data in real-time.
Abnormal event detection in videos using deep learning involves training models to identify and flag events that deviate from normal patterns or behaviors within a given video stream as shown in Figure 1. This is commonly applied in various fields such as surveillance, industrial monitoring, healthcare, and more.
Abnormal even detection has taken Centre stage in most major research concerning pattern recognition and computer vision. The variety of the scenes which can be classified as abnormal events are many and this is a challenge. Definition of the parameters that encompasses the range of potential anomalous events is challenging. In order to interpret abnormal events statistically, it is typical to classify them as low probability occurrences compared to normal events. Unexpected events and events that are out of the ordinary and are not in line with the usual daily occurring activities present in most normal samples can be treated to be abnormal events. The existing pattern recognition and computer vision approaches currently in use for identifying abnormal events comprise of two parts [2-4].
Figure 1. Fundamental flow chart of ad normal event detection in video using deep learning
The first part is the event representation part which is the data gathering stage, where the different features of the video scene is extracted; the different features extracted depend on the different type of models used. For example, the features can be image level features or object level features. Image level features concentrate on the different pixel values of the image. The different features in the two-dimensional image pixels or the three-dimensional video pixels are used to generate the gradient of the image or the histogram of the image and assess it through the help of scientific methods as a spatiotemporal gradient (STG) [5], optical histograms for optical flow (HOF) [6-9], and also perhaps to derive the textures of the image through the mixture of dynamic textures (MDT) [10]. Similarly, the object level features track the objects in the image, such as track their trajectory [11] or their appearance or any change to them [12] in order to indicate an event such as in sports images or History images or energy images etc.
The second part is the anomaly detection part. This part you generally consist of a model which is designed to detect an abnormal event through the anomalies of the different features gathered in the first part. Anomaly detection is usually done through a set of rules which establish what a normal event looks like and any event or a test event which does not follow these set of rules is treated as an anomaly or an abnormal event. The most popular anomaly detection models existing today are cluster-based detection models [13], models based on state inference [14] and on sparse reconstruction [15, 16]. The cluster-based detection model classifies normal analogous events into clusters. Test samples which are very dissimilar to these clusters are classified as abnormal events. The state inference model works on the presumption that a normal event will behave with similar changes with which respect to variation in time where as an anomaly will not undergo these changes with respect to time. The sparse reconstruction model makes use of the sparse Representation of the two-dimensional images or the three-dimensional videos and their features. The sparse representation of a normal event will have a trivial error in comparison to a sparse representation of an anomaly.
Similar topics in image processing, computer vision and pattern recognition which make use of deep learning techniques such as object recognition [17, 18], object detection [19] behaviour recognition [20] and health diagnosis have been successful. This is mainly due to the joint optimization of the two different parts of the deep learning technique. Due to this joint Optimization process the model can discover abnormality in a wide variety of classes and is no longer subject to abnormality sensing in a specific class of normal events. Deep learning techniques have been used on similar topics deriving accurate prediction and results and hence researchers have applied it on abnormal event detection [21-25]. In the study by Luo et al. [26], a model which makes use of three auto encoders for three different channels is proposed. The auto encoder learns the appropriate features in their respective channels. Further a support vector machine (SVM) predicts an anomaly score for each channel which is later combined to derive the final decision on anomaly detection. A similar auto encoder method is presented by Xia et al. [27] where the abnormal event is detected through a sparse auto encoder and its reconstruction error. Similarly, Xiong et al. [28] makes use of two contrasting auto encoders where one is fully connected the other one is a completely constitutional model. These two auto encoders combined learn the occurrence of normal events with respect to time. Then through the variation in time of the reconstructed error the abnormal events are detected. A major drawback in the above methods for anomaly detection is that any sample which does not coincide with the parameters of a normal event is considered an anomaly without taking into consideration the low percentage of occurrence of an anomaly. This leads to false representation of with samples which are not abnormal also being represented as anomalies.
While deep learning has shown great promise in various computer vision tasks, including abnormal event detection in videos, it's important to acknowledge that there are certain disadvantages and challenges associated with using deep learning methods for this purpose [29, 30]. Here are some of the key disadvantages:
Data and annotation challenges
Deep learning models require large amounts of labeled data for training. Annotated datasets for abnormal event detection in videos can be scarce and expensive to create. Annotating anomalies in videos often requires domain expertise and can be subjective, leading to inconsistencies in annotations [31].
Model complexity and overfitting
Deep learning models, especially complex ones, can be prone to overfitting. Anomalies are by definition rare events, making it challenging to train models that can generalize well to unseen anomalies without overfitting to normal behaviors.
Computational resource demands
Training deep learning models for video analysis requires significant computational resources, including high-performance GPUs and substantial memory. This can lead to high infrastructure costs, making it challenging for smaller research groups or organizations with limited resources to adopt these methods effectively.
Need for large-scale data
Anomalies come in various forms, and training a model to recognize them requires exposure to a wide range of abnormal events. Acquiring and annotating such a diverse dataset can be difficult and time-consuming.
Interpretable results
Deep learning models are often seen as black boxes, making it challenging to understand and interpret the decisions they make. In applications like abnormal event detection, interpretability is crucial for understanding why a certain event was flagged as abnormal, especially in critical domains like surveillance and healthcare.
Transferability to new environments
Models trained on one set of videos may not generalize well to different environments or camera setups due to variations in lighting, camera angles, and scene layouts. Fine-tuning or retraining the model on new data is often necessary, which can be resource-intensive.
Adversarial attacks
Deep learning models, including those used for abnormal event detection, can be vulnerable to adversarial attacks. Malicious actors can manipulate videos or scenes to deceive the model into misclassifying normal or abnormal events.
Lack of sufficient anomaly samples
In some cases, acquiring sufficient samples of rare anomalies for training might be practically impossible. This can result in models that struggle to identify anomalies that are not well-represented in the training data.
Real-time processing
Many applications of abnormal event detection require real-time or near-real-time processing. Achieving low-latency predictions with deep learning models can be challenging and may require specialized hardware or optimization techniques.
Model robustness
Deep learning models can be sensitive to noise, variations, and minor changes in the input data. Ensuring that a model remains robust in dynamic real-world scenarios is a constant challenge.
Despite these challenges, researchers and practitioners continue to work on improving deep learning methods for abnormal event detection in videos. Techniques like transfer learning, data augmentation, explainable AI, and adversarial training are being explored to mitigate some of these disadvantages and improve the reliability and generalizability of models.
The proposed method comprises of Reconfigurable auto encoder (RAE) [32-35] which presents an inclusive deep learning technique unlike the other existing methods for anomaly detection. The RAE deep learning framework can map the known raw input data to the low dimensional unknown layers of the deep learning technology. Then a Gaussian distribution model constraints the invisible layers representation such that the Gaussian distribution value for a normal event is comparatively much higher than the distribution of an anomaly which is comparatively much smaller [36]. By representing the raw data with respect to the unknown hidden layers and using the Gaussian distribution for anomaly detection performs the two main parts of the proposed model that is event representation and anomaly detection. It performs a joint optimization through an inclusive learning framework which has the ability to perform in generalized scenarios. Through two different open source and popular data sets the robustness in the generalization of the proposed method is assessed. Apart from being able to apply to different scenarios the quality of its anomaly detection is on par with current technologies.
The proposed method of anomaly detection using RAE consists of training phase and a testing phase. The training phase initially collects dense samples from the three-dimensional video input in the spatial domain. The raw, manipulated pixel values are input to the RAE model [37]. These high dimensional values are mapped to the unknown layers of the RAE model in order to derive its Gaussian distribution representation. Then during the testing phase, the Gaussian representation of the test sample is obtained from the hidden layers of the RAE model [38, 39]. This Gaussian distribution representation leads to an anomaly score for the test sample. Finally, all the test samples with an anomaly score below the threshold are classified as an abnormal event. This section elaborates the proposed method of variational auto encoder for abnormal event detection in surveillance videos. The working of an auto encoder is first discussed here.
2.1 Working of the autoencoder
The input to the auto encoder is converted and stored in form of its invisible lay or representation [40, 41]. The original input can be recovered through this invisible layer representation through the encoder, decoder composition. The expressions for the encoder f(x) and decoder g(z) are shown Eq. (1) and Eq. (2):
$\mathrm{z}=\mathrm{f}_{w_1}(\mathrm{x})$ (1)
$\mathrm{x}^{\prime}=\mathrm{g}_{w_1}(\mathrm{z})$ (2)
If x is the input data, then the auto encoder invisible layer representation of the data is represented by z and the input data reconstructed by the auto encoder is represented by $x^{\prime}$. The terms $w_1$ and $w_2$ represent the hidden layer invariables of the neural network. The minimum reconstruction error has to be maintained in order to obtain effective reconstruction of the raw input data [42]. The reconstruction error is represented by the expression in Eq. (3):
$\min \left\|\mathrm{x}-x^{\prime} w_1 w_2\right\|^2$ (3)
The invisible layer representation of the input data can also be considered to be the features of the data. Hence this representation by the auto encoder can be used in the pattern recognition stage of the abnormal event detection model. In order to improve on the feature extraction ability of the invisible layer of the neural network, the noise reduction auto encoder [43] was designed, this introduces a noise term which improves the expressiveness of the model to avail better feature extraction. Similarly, a sparse encoder [44] was designed to introduce sparsity constraints which makes the model effective even in case of partial loss of data. Similarly error based reconstruction [45-47] has been widely used in auto encoders. The invisible layer representation is sometimes directly used as a feature and has been successful in event detection. One major drawback that is identified in all these above methods is that these methods do not take into consideration the probability of the different samples, i.e., abnormal events have a very low probability compared to the normal events which is not considered in the representation. Hence taking into consideration the vital probability of the different events the proposed method assumes the hidden layer representation to follow a Gaussian distribution [48, 49]. Further the abnormal event in the surveillance video is detected through a variational auto encoder.
2.2 Abnormal event detection through variational auto encoder
An ‘N’ number of samples of size ‘S’ are used to train the variational auto encoder [50-52] to identify the Gaussian distribution within the input data. Assuming that the training samples are all samples of normal events, the Gaussian distribution of these normal events are all clustered together to create one cluster centre. In case of the input data representing and abnormal event in the Gaussian distribution of such an abnormal event will have a Centre which is far from the class to centre of the training data. The events whose gorgeous distribution Centre is far from the training date of class the centre is classified to be an abnormal sample or an abnormal event as given Eq. (4).
$\mathrm{z} \sim N(0, \mathrm{I})$ (4)
The reconstruction of the original data of the variational auto encoder is very similar to the reconstruction process of the auto encoder. The Invisible layer representation of the input data has to satisfy the condition in equation 4 where ‘I’ represent the identity matrix. The variational auto encoder comprises of two neural networks, which make up the encoder and decoder of the invisible layer.
These above two networks are bound by the constraints $\theta$ and $\varphi$. These constraints are responsible for invisible layer representation of the training data ‘z’ by the encoder and the reconstruction of this invisible layer representation to generate the reconstructed training data $x^{\prime}$.
The loss function of the variational encoder is represented through the expression in Eq. (5).
$\begin{gathered}\mathrm{L}(\theta, \varphi, \mathrm{x})=\mathrm{E}_{\mathrm{z} \sim \mathrm{q}_{\varphi(\mathrm{Z} \mid \mathrm{X})}}\left[\log \mathrm{p}_\theta(\mathrm{x} \mid \mathrm{z})\right] -\mathrm{D}_{\mathrm{KL}}\left(\mathrm{q}_{\varphi}(\mathrm{z} \mid \mathrm{x}) \| \mathrm{p}(\mathrm{z})\right.\end{gathered}$ (5)
This loss function is responsible for regulating the reconstruction and to ensure the reconstruction is effective. The sampling for each sample in the training data according to the Monte Carlo method as given shown in Eq. (6).
$\mathrm{E}_{\mathrm{z} \sim \mathrm{q}_{\varphi(\mathrm{z} \mid \mathrm{x})}}\left[\log \mathrm{p}_\theta(\mathrm{x} \mid \mathrm{z})\right] \approx \frac{1}{\mathrm{n}} \sum_{\mathrm{i}=1}^{\mathrm{n}} \log \mathrm{p}_\theta\left(\mathrm{x}_{\mathrm{i}} \mid \mathrm{z}_{\mathrm{i}}\right)$ (6)
where, the training data Xi is represented through its invisible layer representation Zi.
The LHS in Eq. (7) is the log likelihood of the training data necessary for effective reconstruction by the decoder. The RHS represents the Kullback-Leibler divergence measure between the two probability distributions. This divergence value will be small for two similar probability distributions. Based on this estimation $\mathrm{q}_{\varphi}(\mathrm{z} \mid \mathrm{x})$ gives the normal distribution through
$\mathrm{q}_{\varphi}(\mathrm{z} \mid \mathrm{x})=\frac{1}{\sqrt{2 \pi \sigma}} \cdot \mathrm{e}^{-(\mathrm{z}-\mathrm{u})^2 / 2 \sigma^2}$ (7)
From Eq. (3), p(z) can be reduced to
$p(z)=\frac{1}{\sqrt{2 \pi \sigma}} \cdot e^{-z^2 / 2}$ (8)
From the above expressions in Eq. (7) and Eq. (8) the second term in the RHS of 4 can be expressed as in Eq. (9) for effective abnormal event detection.
$\begin{gathered}-\mathrm{D}_{\mathrm{KL}}\left(\mathrm{q}_{\varphi}(\mathrm{z} \mid \mathrm{x})|| \mathrm{p}(\mathrm{z})=\int q_{\varphi}\left(z \mid x^{\prime}\right) \log \frac{q_{\varphi}\left(\mathrm{z} \mid x^{\prime}\right)}{\mathrm{p}(\mathrm{z})}\right. \\ \mathrm{dz}=0.5\left(1+\log \sigma^2-\mu^2-\sigma^2\right)\end{gathered}$ (9)
2.3 Prediction
After the training process the test data is input to the network. The features of the test sample are identified and is represented in the form of the invisible layer $\mathrm{z}^{\prime}$ through the inferred network. The probability of $\mathrm{z}^{\prime}$ being in the Gaussian Distribution is given in Eq. (10).
$\left(\mathrm{z}^{\prime}\right)=\frac{1}{\sqrt{2 \pi \sigma}} \cdot \mathrm{e}^{-\left(\mathrm{z}^{\prime}-\mathrm{u}\right)^2 / 2 \sigma^2}$ (10)
In case the test sample is a normal event it will be in the high probability area of the Gaussian distribution, while an abnormal event will have a lower value. Hence inference on occurrence of an abnormal event is derived through a threshold as given in Eq. (11).
$\left\{\begin{array}{lr}\mathrm{p}\left(\mathrm{z}^{\prime}\right)>\delta, & \text { normal } \\ \mathrm{p}(\mathrm{z})<\delta, & \text { abnormal }\end{array}\right\}$ (11)
The sensitivity of the of the detection procedure is represented through $\delta$.
The results of the proposed abnormal event detection model are compared with various existing methods using two different data sets UCSD Ped1 [53] and Avenue data set [54].
3.1 Data set and its indicators for experimental analysis
The first data set used is UCSD Ped1 data set this data set has 36 normal and 38 abnormal samples the samples are taken through a surveillance camera fixed at the payment the size of the pictures are 238×158 with 220 frames per clip. In this data set people walking on the payment are classified as normal events and small motor vehicles bicycles and small cars on the payment and people walking on the lawn are classified as an abnormal event.
The second data set is the Avenue data set which is a data set used for monitoring students and people around the school premises. Here the normal events include people walking. While abnormal events include people running, hanging around during class hours, throwing things, misbehaving etc. The data set comprises of 30652 frames of size 360×240. Both the data sets are captured through a surveillance camera whose lens is positioned obliquely. A set of sample images from the Avenue data set is shown in Figure 2, Figures 2(a) and 2(b) show the UCSD Ped1 dataset and Avenue dataset, respectively. the images in the top are considered as normal events, while the images in the bottom are classified as abnormal events.
Two different types of indicators pixel-level and frame-level [55] are used for evaluation:
(1) frame level indicators: in this case if there exist one or more abnormal pixels in a frame such a frame is classified as abnormal.
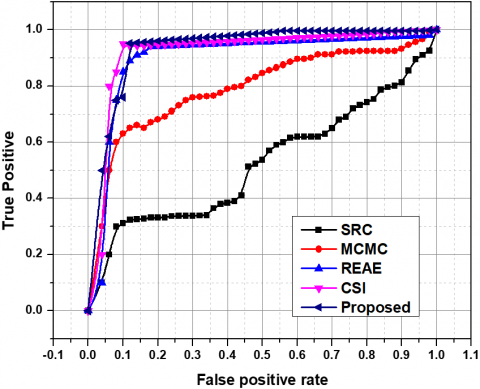
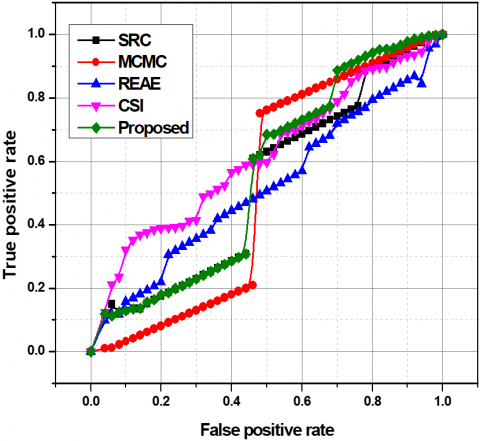
(2) pixel level indicators: here if the abnormal area of the sample coincides with at least 40% of the real abnormal area then such an event is classified as abnormal. Once the samples are classified as normal and abnormal the true positives and the false positives of the classified samples are estimated. Then through the use of the threshold $\delta$ [56] The ROC curves in the graph in Figure 3 are plotted, and Figures 3(a) and 3(b) show the frame-level ROC and pixel-level ROC, respectively.
Figure 2. Several examples of occurrences from the dataset for detecting anomalous events
Figure 3. UCSD Ped1 dataset ROC curves
3.2 Setup for training the proposed model and subsequent test data estimation
The proposed abnormal event detection model comprises of 4 invisible layers, the initial layer comprises of 500 neurons while the subsequent layers comprise of 2500 and 30 neurons each. This symmetrical network structure is trained using the normalized input vectors of size 500×1. This vector is derived from the test samples of size 160×120 with video clips divided into a size of 10×10×5. An Adam Optimizer [57] is selected by the optimizer in the network. The network uses a progressive learning rate which reduces by 1⁄10 for every thousand iterations starting from 0.0001. The maximum number of iterations is set to be 10000. For evaluation the surveillance video is converted into test samples of size 10×10×1, These three-dimensional samples are divided in such a way that they are unique and do not have any overlapping events with respect to time. The valuation begins with the invisible layer representation of the test sample. Through Eq. 10 it is determined whether the sample represents a normal or an abnormal event. The neural network is implemented using Tensor Flow and Python in an NVIDIA GTX 1070 TI with 8GB memory. The results of the proposed method are compared with current existing methods in trend [58-65]. These are represented as ‘Sparse reconstruction cost (SRC),’ ‘Markav Chain monte Carlo (MCMC),’ ‘Reconstruction error of auto-encoder (REAE)’ and ‘Channel state information (CSI)’ respectively.
3.3 Results and analysis
The proposed method is compared with four popular existing methods out of which three methods make use of separate sequential feature extraction and event detection procedures. The type of features extracted in each model varies for instance in case of SRC the dynamic textures of the frames are used as the features and in case of the second method the variations in the gradient of the pixels which respect to the spatial and temporal domain representation is the features of the image, where as in the third method an auto encoder is used for feature extraction. These methods have a twostep procedure where once the features of an image have been extracted a subsequent abnormal event detection model is responsible for identifying the abnormal event. In case of the first method an inference using the image, statistics is used for abnormal event detection. While the second method make use of a Sparse model for reconstruction and abnormal event detection. The third method uses and SVM model of a single vector class for abnormal event detection. The results from the proposed and the existing methods are compared through the use of the ROC curves. The ROC values of the existing methods are retrieved from the corresponding papers, CSI paper does not provide the ROC curves data. Figure 3 represents the frame level and the pixel level comparison of the ROC curves for the different methods.
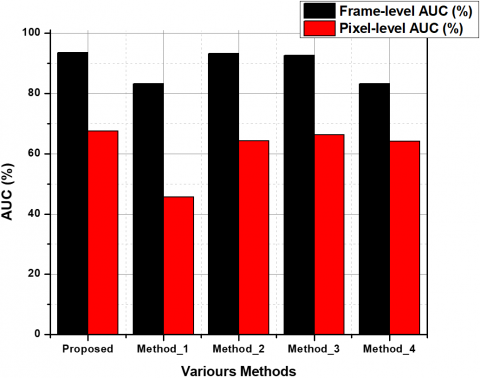
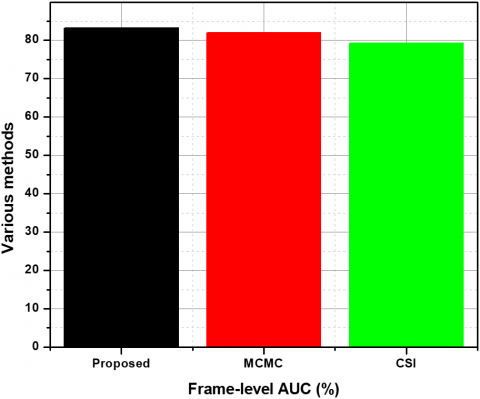
From Figure 3, it can be assessed that the proposed method excels in frame-level evaluation in comparison with the existing methods. In the case of pixel-level evaluation, the proposed method is on par with the existing MCMC, REAE, and SRC. The UCSD Ped1 data set is used for the assessment, and the results have been tabulated in Table 1. Figure 4 shows the comparison analysis between UCSD Ped1 and the existing method. The proposed abnormal event detection method excels with 92.3% in frame-level AUC and achieves 71.4% in pixel-level evaluation. The second method, which makes use of temporal gradient values, performs much lower compared to the proposed method. This can be due to each frame acting as a separate input to its neural network. The frame-level evaluation values for the Avenue data set are shown in Table 2. The proposed method is compared with MCMC and CSI and is empirically proven to perform better than both of these methods and Figure 5. shows the Comparison of the Avenue dataset's frame-level AUC% with the convolution method.
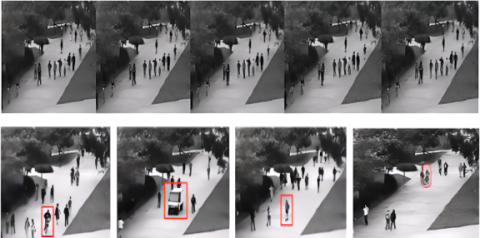
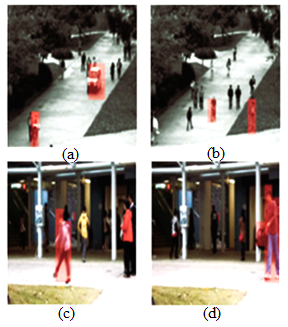
The generalization of the proposed model is tested and from Figure 6 it is seen that the proposed model can successfully detect various abnormal events such as trolley skateboard etc. Hence proving its good generalization ability. Examples of results from partially accurate detection on two datasets are shown in Figure 6. The test results from the USCD Ped1 dataset are (a) and (b), and the test results from the Avenue dataset are (c) and (d).
Finally, the proposed model is tested in terms of speed of abnormal event detection the results are tabulated in Table 3. This test makes use of UCSD ped1 data set. It is seen that the propose method has the fastest rate of detection with 571 fps in comparison with the existing methods. The hardware used for this empirical analysis is Intel Core i7-8700k 3.7 GHz CPU and NVIDIA GTX 1070Ti. with 8GB video memory GPU and 16GB RAM. The software used is Python 3.7 and TensorFlow 1.7.
Table 1. AUC% comparison of the UCSD Ped1 dataset with the conventional methods
|
SI. No |
Various Methods |
Frame-Level AUC (%) |
Pixel-Level AUC (%) |
|
1. |
Proposed |
94.12 |
67.25 |
|
2. |
SRC |
83.1 |
46.12 |
|
3. |
MCMC |
92.12 |
64.32 |
|
4. |
REAE |
92.01 |
65.12 |
|
5. |
CSI |
83.02 |
64.01 |
Table 2. Comparison of the avenue dataset's frame-level auc% with the conventional methods
|
SI. No |
Various Methods |
Frame-Level AUC (%) |
|
1. |
Proposed |
83.25 |
|
2. |
MCMC |
82.01 |
|
3. |
CSI |
79.23 |
Figure 4. Comparison analysis between UCSD Ped1 and the existing method
Figure 5. Comparison of the avenue dataset's frame-level auc% with the convolution method
Table 3. Running time comparison on the UCSD Ped1 dataset
|
SI. No |
Various Methods |
Tools |
Processor (GHz) |
GPU |
RAM (GB) |
Detection Rate (fps) |
|
1. |
Proposed |
Python+ C++ TensorFlow 2.8.0 |
4.5 |
NVIDIA GeForce 16 series |
20 |
612 |
|
2. |
SRC |
Matlab 2019 |
3.8 |
-- |
4 |
0.04 |
|
3. |
MCMC |
Matlab 2020 |
3.5 |
-- |
8 |
145.25 |
|
4. |
REAE |
Matlab 2021 |
3.4 |
-- |
16 |
132 |
|
5. |
CSI |
Matlab 2022 |
2.5 |
NVIDIA GeForce GTX 1650 |
32 |
0.21 |
Figure 6. Illustrations of the detection's results
In this paper, a proposed reconfigurable autoencoder (RAE) using end-to-end deep learning is used to determine the normal and abnormal events detected in video surveillance. As per the analysis, the proposed method shows that the probability of abnormal event detection is small as compared to the normal detection event in the Gaussian distribution. The proposed methods reduce efficiency compared to the simulation parameters to get better performance. As per the simulation result, the proposed method shows better performance as compared to the conventional methods with respect to the AUC(%). In the UCSD Ped_1 dataset, the proposed method has been improved by 1.02% (frame level AUC%) and 1.03% (pixel level AUC%) with respect to the avenue data set's frame level AUC(%). The proposed method works better than the MCMC method, with a 1.01% improvement in the frame-level AUC(%) when the Avenue dataset is used for the simulation. Additionally, the two phases are concurrently optimised to raise the method's precision and generalizability. The numerical outcomes in the two public datasets demonstrate that the suggested approach has reached the level of technological development at the moment. The following stage of research will take into account implementing the suggestions on increasingly complicated datasets.
The authors would like to thank SJB Institute of Technology, Bengaluru, JSS Academy of Technical Education, Bengaluru, Visvesvaraya Technological University (VTU), Belagavi and Vision Group on Science and Technology (VGST) Karnataka Fund for Infrastructure strengthening in Science & Technology Level-2 sponsored “Establishment of Renewable Smart Grid Laboratory” for all the support and encouragement provided by them to take up this research work and publish this paper.
[1] Wang, X. (2022). Research on video surveillance violence detection technology based on deep convolution network. In 2022 International Conference on Information System, Computing and Educational Technology (ICISCET), Montreal, QC, Canada, pp. 347-350. https://doi.org/10.1109/ICISCET56785.2022.00086
[2] Kavya, B.M., Sharmila, N., Naveen, K.B., Mallikarjunaswamy, S., Manu, K. S., Manjunatha, S. (2023). A machine learning based smart grid for home power management using cloud-edge computing system. In 2023 International Conference on Recent Advances in Science and Engineering Technology (ICRASET), B G NAGARA, India, pp. 1-6. IEEE. https://doi.org/10.1109/ICRASET59632.2023.10419952
[3] Saypadith, S., Detvongsa, S., Onoye, T. (2022). Joint generative network for abnormal event detection in surveillance videos. In 2022 19th International SoC Design Conference (ISOCC), Gangneung-si, Korea, pp. 199-200. https://doi.org/10.1109/ISOCC56007.2022.10031308
[4] Huang, C., Wu, Z., Wen, J., Xu, Y., Jiang, Q., Wang, Y. (2021). Abnormal event detection using deep contrastive learning for intelligent video surveillance system. IEEE Transactions on Industrial Informatics, 18(8): 5171-5179. https://doi.org/10.1109/TII.2021.3122801
[5] Kiran, A., Purushotham, P., Priya, D.D. (2022). Weapon detection using artificial intelligence and deep learning for security applications. In 2022 International Conference on Advancements in Smart, Secure and Intelligent Computing (ASSIC), Bhubaneswar, India, pp. 1-5. https://doi.org/10.1109/ASSIC55218.2022.10088403
[6] Lee, S., Kim, H.G., Ro, Y.M. (2019). BMAN: Bidirectional multi-scale aggregation networks for abnormal event detection. IEEE Transactions on Image Processing, 29: 2395-2408. https://doi.org/10.1109/TIP.2019.2948286
[7] Tiwari, A., Chaudhury, S., Singh, S., Saurav, S. (2021). Video classification using slowfast network via fuzzy rule. In 2021 IEEE International Conference on Fuzzy Systems (FUZZ-IEEE), Luxembourg, Luxembourg, pp. 1-6. https://doi.org/10.1109/FUZZ45933.2021.9494542
[8] Chandrakala, S., Vignesh, L.K.P. (2021). V2AnomalyVec: Deep discriminative embeddings for detecting anomalous activities in surveillance videos. IEEE Transactions on Computational Social Systems, 9(5): 1307-1316. https://doi.org/10.1109/TCSS.2021.3119957
[9] Chu, W., Xue, H., Yao, C., Cai, D. (2018). Sparse coding guided spatiotemporal feature learning for abnormal event detection in large videos. IEEE Transactions on Multimedia, 21(1): 246-255. https://doi.org/10.1109/TMM.2018.2846411
[10] Wu, C., Shao, S., Tunc, C., Hariri, S. (2020). Video anomaly detection using pre-trained deep convolutional neural nets and context mining. In 2020 IEEE/ACS 17th International Conference on Computer Systems and Applications (AICCSA), Antalya, Turkey, pp. 1-8. https://doi.org/10.1109/AICCSA50499.2020.9316538
[11] Mathur, R., Chintala, T., Rajeswari, D. (2022). Detecting criminal activities and promoting safety using deep learning. In 2022 International Conference on Advances in Computing, Communication and Applied Informatics (ACCAI), Chennai, India, pp. 1-8. https://doi.org/10.1109/ACCAI53970.2022.9752619
[12] Liu, Y.X., Yang, Y., Shi, A., Peng, J., Liu, H. (2019,). Intelligent monitoring of indoor surveillance video based on deep learning. In 2019 21st International Conference on Advanced Communication Technology (ICACT), PyeongChang, Korea (South), pp. 648-653. https://doi.org/10.23919/ICACT.2019.8701964
[13] Vaishnavi, M., Sowmya, J., Yaswanth, M., Maruvarasi, P.R. (2023). Implementation of abnormal event detection using automated surveillance system. In 2023 7th International Conference on Computing Methodologies and Communication (ICCMC), Erode, India, pp. 1-6. https://doi.org/10.1109/ICCMC56507.2023.10084214
[14] Pogadadanda, V., Shaik, S., Neeraj, G.V.S., Siralam, H.V., Rao, K.B. (2023). Abnormal activity recognition on surveillance: A review. In 2023 Third International Conference on Artificial Intelligence and Smart Energy (ICAIS), Coimbatore, India, pp. 1072-1077. https://doi.org/10.1109/ICAIS56108.2023.10073703
[15] Mampilayil, H.R., Rahamathullah, K. (2019). Deep learning based detection of one way traffic rule violation of three wheeler vehicles. In 2019 International Conference on Intelligent Computing and Control Systems (ICCS), Madurai, India, pp. 1453-1457. https://doi.org/10.1109/ICCS45141.2019.9065638
[16] Khayrat, A., Malak, P., Victor, M., Ahmed, S., Metawie, H., Saber, V., Elshalakani, M. (2022). An intelligent Surveillance System for Detecting Abnormal Behaviors on Campus using YOLO and CNN-LSTM networks. In 2022 2nd International Mobile, Intelligent, and Ubiquitous Computing Conference (MIUCC), Cairo, Egypt, pp. 104-109. https://doi.org/10.1109/MIUCC55081.2022.9781786
[17] Jain, H., Vikram, A., Kashyap, A., Jain, A. (2020). Weapon detection using artificial intelligence and deep learning for security applications. In 2020 International Conference on Electronics and Sustainable Communication Systems (ICESC), Coimbatore, India, pp. 193-198. https://doi.org/10.1109/ICESC48915.2020.9155832
[18] Liu, Y., Liu, J., Zhao, M., Li, S., Song, L. (2022). Collaborative normality learning framework for weakly supervised video anomaly detection. IEEE Transactions on Circuits and Systems II: Express Briefs, 69(5): 2508-2512. https://doi.org/10.1109/TCSII.2022.3161061
[19] Ganokratanaa, T., Aramvith, S., Sebe, N. (2020). Unsupervised anomaly detection and localization based on deep spatiotemporal translation network. IEEE Access, 8: 50312-50329. https://doi.org/10.1109/ACCESS.2020.2979869
[20] Paul, A., Paul, S., Jose, K.P., Sabarinath, M.S. (2023). Integrated intelligent surveillance system using deep learning. In 2023 3rd International Conference on Advances in Computing, Communication, Embedded and Secure Systems (ACCESS), Kalady, Ernakulam, India, pp. 297-303. https://doi.org/10.1109/ACCESS57397.2023.10200245
[21] Vijay, T.K., Dogra, D.P., Choi, H., Nam, G., Kim, I.J. (2022). Detection of road accidents using synthetically generated multi-perspective accident videos. IEEE Transactions on Intelligent Transportation Systems, 24(2): 1926-1935. https://doi.org/10.1109/TITS.2022.3222769
[22] Bushra, S.N., Shobana, G., Maheswari, K.U., Subramanian, N. (2022). Smart video Survillance based weapon identification using Yolov5. In 2022 International Conference on Electronic Systems and Intelligent Computing (ICESIC), Chennai, India, pp. 351-357. https://doi.org/10.1109/ICESIC53714.2022.9783499
[23] Ramzan, M., Abid, A., Khan, H.U., et al. (2019). A review on state-of-the-art violence detection techniques. IEEE Access, 7: 107560-107575. https://doi.org/10.1109/ACCESS.2019.2932114
[24] Chriki, A., Touati, H., Snoussi, H., Kamoun, F. (2020). Uav-based surveillance system: an anomaly detection approach. In 2020 IEEE Symposium on Computers and Communications (ISCC), Rennes, France, pp. 1-6. https://doi.org/10.1109/ISCC50000.2020.9219585
[25] Duman, E., Erdem, O.A. (2019). Anomaly detection in videos using optical flow and convolutional autoencoder. IEEE Access, 7: 183914-183923. https://doi.org/10.1109/ACCESS.2019.2960654
[26] Luo, L., Zhang, L., Wang, M., Liu, Z., Liu, X., He, R., Jin, Y. (2021). A system for the detection of polyphonic sound on a university campus based on CapsNet-RNN. IEEE Access, 9: 147900-147913. https://doi.org/10.1109/ACCESS.2021.3123970
[27] Xia, K., Zhang, L., Yuan, S., Lou, Y. (2023). SCSS: An intelligent security system to guard city public safe. IEEE Access, 11: 76415-76426. https://doi.org/10.1109/ACCESS.2023.3297643
[28] Xiong, M.F., Yang, X.X., Chen, H.M., Aly, W.H.F., AlTameem, A., Saudagar, A.K.J., Mumtaz, S., Muhammad, K. (2024). Cloth-changing person re-identification with invariant feature parsing for UAVs applications. IEEE Transactions on Vehicular Technology, 1-10. https://doi.org/10.1109/TVT.2024.3388249
[29] Manjunath, T.N., Mallikarjunaswamy, S., Komala, M., Sharmila, N., Manu, K.S. (2021). An efficient hybrid reconfigurable wind gas turbine power management system using MPPT algorithm. International Journal of Power Electronics and Drive Systems, 12(4): 2501. https://doi.org/10.11591/ijpeds.v12.i4.pp2501-2510
[30] Kumar, G.G., Krishna, M.S., Kumaravel, S., Babaei, E. (2020). Multi-stage DC-DC converter using active LC2D network with minimum component. IEEE Transactions on Circuits and Systems II: Express Briefs, 68(3): 943-947. https://doi.org/10.1109/TCSII.2020.3021609
[31] Thazeen, S., Mallikarjunaswamy, S., Saqhib, M.N., Sharmila, N. (2022). DOA method with reduced bias and side lobe suppression. In 2022 International Conference on Communication, Computing and Internet of Things (IC3IoT), Chennai, India, pp. 1-6. https://doi.org/10.1109/IC3IOT53935.2022.9767996
[32] Dayananda, P., Srikantaswamy, M., Nagaraju, S., Velluri, R., Doddananjedevaru, M.K. (2022). Efficient detection of faults and false data injection attacks in smart grid using a reconfigurable Kalman filter. International Journal of Power Electronics and Drive Systems, 13(4): 2086-2097. https://doi.org/10.11591/ijpeds.v13.i4.pp2086-2097
[33] Mahendra, H.N., Mallikarjunaswamy, S., Subramoniam, S.R. (2023). An assessment of vegetation cover of Mysuru City, Karnataka State, India, using deep convolutional neural networks. Environmental Monitoring and Assessment, 195(4): 526. https://doi.org/10.1007/s10661-023-11140-w
[34] Harrou, F., Hittawe, M.M., Sun, Y., Beya, O. (2020). Malicious attacks detection in crowded areas using deep learning-based approach. IEEE Instrumentation & Measurement Magazine, 23(5): 57-62. https://doi.org/10.1109/MIM.2020.9153576
[35] Pandiaraja, P., Saarumathi, R., Parashakthi, M., Logapriya, R. (2023). An analysis of abnormal event detection and person identification from surveillance cameras using motion vectors with deep learning. In 2023 Second International Conference on Electronics and Renewable Systems (ICEARS), Tuticorin, India, pp. 1225-1232. https://doi.org/10.1109/ICEARS56392.2023.10085466
[36] Elbasi, E. (2020). Reliable abnormal event detection from IoT surveillance systems. In 2020 7th International Conference on Internet of Things: Systems, Management and Security (IOTSMS), Paris, France, pp. 1-5. https://doi.org/10.1109/IOTSMS52051.2020.9340162
[37] Mallikarjunaswamy, S., Nataraj, K.R., Rekha, K.R. (2014). Design of high-speed reconfigurable coprocessor for next-generation communication platform. In Emerging Research in Electronics, Computer Science and Technology: Proceedings of International Conference, ICERECT 2012, pp. 57-67. https://doi.org/10.1007/978-81-322-1157-0_7
[38] Lee, H.M., Mao, C.H. (2009). Finding abnormal events in home sensor network environment using correlation graph. In 2009 IEEE International Conference on Systems, Man and Cybernetics, San Antonio, TX, USA, pp. 1852-1856. https://doi.org/10.1109/ICSMC.2009.5346248
[39] Guo, H., Wu, X., Wang, H., Chen, L., Ou, Y., Feng, W. (2015). A novel approach for global abnormal event detection in multi-camera surveillance system. In 2015 IEEE International Conference on Information and Automation, Lijiang, China, pp. 73-78. https://doi.org/10.1109/ICInfA.2015.7279261
[40] Mohan, A., Choksi, M., Zaveri, M.A. (2019). Anomaly and activity recognition using machine learning approach for video based surveillance. In 2019 10th International Conference on Computing, Communication and Networking Technologies (ICCCNT), Kanpur, India, pp. 1-6. https://doi.org/10.1109/ICCCNT45670.2019.8944396
[41] Gao, B., Ma, H.Y., Yang, Y.H. (2002). Hmms (hidden markov models) based on anomaly intrusion detection method. In Proceedings. International Conference on Machine Learning and Cybernetics, Beijing, China, pp. 381-385. https://doi.org/10.1109/ICMLC.2002.1176779
[42] Pavithra, G.S., Pooja, S., Rekha, V., Mahendra, H.N., Sharmila, N., Mallikarjunaswamy, S. (2023). Comprehensive analysis on vehicle-to-vehicle communication using intelligent transportation system. In International Conference on Soft Computing for Security Applications, TamilNadu, India, pp. 893-906. https://doi.org/10.1007/978-981-99-3608-3_62
[43] Mahendra, H.N., Mallikarjunaswamy, S., Kumar, D.M., Kumari, S., Kashyap, S., Fulwani, S., Chatterjee, A. (2023). Assessment and prediction of air quality level using ARIMA model: A case study of Surat City, Gujarat State, India. Nature Environment & Pollution Technology, 22(1): 199-210. https://doi.org/10.46488/NEPT.2023.v22i01.018
[44] Umashankar, M.L., Mallikarjunaswamy, S., Sharmila, N., Kumar, D.M., Nataraj, K.R. (2023). A survey on IoT protocol in real-time applications and its architectures. In ICDSMLA 2021: Proceedings of the 3rd International Conference on Data Science, Machine Learning and Applications, pp. 119-130. https://doi.org/10.1007/978-981-19-5936-3_12
[45] Mahendra, H.N., Mallikarjunaswamy, S., Subramoniam, S.R. (2023). An assessment of built-up cover using geospatial techniques–a case study on Mysuru District, Karnataka State, India. International Journal of Environmental Technology and Management, 26(3-5): 173-188. https://doi.org/10.1504/IJETM.2023.130787
[46] Pooja, S., Mallikarjunaswamy, M., Sharmila, S. (2023). Image region driven prior selection for image deblurring. Multimedia Tools and Applications, 82: 24181-24202. https://doi.org/10.1007/s11042-023-14335-y
[47] Rathod, S., Ramaswamy, N.K., Srikantaswamy, M., Ramaswamy, R.K. (2022). An efficient reconfigurable peak cancellation model for peak to average power ratio reduction in orthogonal frequency division multiplexing communication system. International Journal of Electrical and Computer Engineering, 12(6): 6239-6247. https://doi.org/10.11591/ijece.v12i6.pp6239-6247
[48] Mallikarjunaswamy, S., Basavaraju, N.M., Sharmila, N., Mahendra, H.N., Pooja, S., Deepak, B.L. (2022). An efficient big data gathering in wireless sensor network using reconfigurable node distribution algorithm. In 2022 Fourth International Conference on Cognitive Computing and Information Processing (CCIP), Bengaluru, India, pp. 1-6. http://doi.org/10.1109/CCIP57447.2022.10058620
[49] Mahendra, H.N., Mallikarjunaswamy, S. (2022). An efficient classification of hyperspectral remotely sensed data using support vector machine. International Journal of Electronics and Telecommunications, 68(3): 609-617. https://doi.org/10.24425/ijet.2022.141280
[50] Shivaji, R., Nataraj, K.R., Mallikarjunaswamy, S., Rekha, K.R. (2022). Implementation of an effective hybrid partial transmit sequence model for peak to average power ratio in MIMO OFDM system. In ICDSMLA 2020: Proceedings of the 2nd International Conference on Data Science, Machine Learning and Applications, pp. 1343-1353. https://doi.org/10.1007/978-981-16-3690-5_129
[51] Savitha, A.C., Jayaram, M.N. (2022). Development of energy efficient and secure routing protocol for M2M communication. International Journal of Performability Engineering, 18(6): 426-433. https://doi.org/10.23940/ijpe.22.06.p5.426-433
[52] Venkatesh, D.Y., Mallikarjunaiah, K., Srikantaswamy, M. (2022). A comprehensive review of low density parity check encoder techniques. Ingénierie des Systèmes d’Information, 27(1): 11-20. https://doi.org/10.18280/isi.270102
[53] Thazeen, S., Mallikarjunaswamy, S., Saqhib, M.N. (2022). Septennial adaptive beamforming algorithm. In 2022 International Conference on Smart Information Systems and Technologies (SIST), Nur-Sultan, Kazakhstan, pp. 1-4. https://doi.org/10.1109/SIST54437.2022.9945753
[54] Alwakeel, S.S., Alhalabi, B., Aggoune, H., Alwakeel, M. (2015). A machine learning based WSN system for autism activity recognition. In 2015 IEEE 14th International Conference on Machine Learning and Applications (ICMLA), Miami, FL, USA, pp. 771-776. https://doi.org/10.1109/ICMLA.2015.46
[55] Mahendra, H.N., Mallikarjunaswamy, S., Basavaraju, N.M., Poojary, P.M., Gowda, P.S., Mukunda, M., Navya, B., Pushpalatha, V. (2022). Deep learning models for inventory of agriculture crops and yield production using satellite images. In 2022 IEEE 2nd Mysore Sub Section International Conference (MysuruCon), Mysuru, India, pp. 1-7. https://doi.org/10.1109/MysuruCon55714.2022.9972523
[56] Mahendra, H.N., Mallikarjunaswamy, S., Nooli, C.B., Hrishikesh, M., Kruthik, N., Vakkalanka, H.M. (2022). Cloud based centralized smart cart and contactless billing system. In 2022 7th International Conference on Communication and Electronics Systems (ICCES), Coimbatore, India, pp. 820-826. https://doi.org/10.1109/ICCES54183.2022.9835856
[57] Mallikarjunaswamy, S., Sharmila, N., Siddesh, G.K., Nataraj, K.R., Komala, M. (2022). A novel architecture for cluster based false data injection attack detection and location identification in smart grid. In Advances in Thermofluids and Renewable Energy: Select Proceedings of TFRE 2020, pp. 599-611. https://doi.org/10.1007/978-981-16-3497-0_48
[58] Thazeen, S., Mallikarjunaswamy, S., Siddesh, G.K., Sharmila, N. (2021). Conventional and subspace algorithms for mobile source detection and radiation formation. Traitement du Signal, 38(1): 135-145. https://doi.org/10.18280/ts.380114
[59] Satish, P., Srikantaswamy, M., Ramaswamy, N.K. (2020). A comprehensive review of blind deconvolution techniques for image deblurring. Traitement du Signal, 37(3): 527-539. https://doi.org/10.18280/ts.370321
[60] Umashankar, M.L., Ramakrishna, M.V., Mallikarjunaswamy, S. (2019). Design of high speed reconfigurable deployment intelligent genetic algorithm in maximum coverage wireless sensor network. In 2019 International Conference on Data Science and Communication (IconDSC), Bangalore, India, pp. 1-6. https://doi.org/10.1109/IconDSC.2019.8816930
[61] Mahendra, H.N., Mallikarjunaswamy, S., Rekha, V., Puspalatha, V., Sharmila, N. (2019). Performance analysis of different classifier for remote sensing application. International Journal of Engineering and Advanced Technology, 9(1): 7153-7158. https://doi.org/10.35940/ijeat.A1879.109119
[62] Thazeen, S., Mallikarjunaswamy, S. (2023). The effectiveness of 6T beamformer algorithm in smart antenna systems for convergence analysis. IIUM Engineering Journal, 24(2): 100-116. https://doi.org/10.31436/iiumej.v24i2.2730
[63] Hung, T.Y., Lu, J., Tan, Y.P. (2013). Cross-scene abnormal event detection. In 2013 IEEE International Symposium on Circuits and Systems (ISCAS), Beijing, China, pp. 2844-2847. https://doi.org/10.1109/ISCAS.2013.6572471
[64] Baig, M.M., Hosseini, H.G., Lindén, M. (2016). Machine learning-based clinical decision support system for early diagnosis from real-time physiological data. In 2016 IEEE Region 10 Conference (TENCON), Singapore, pp. 2943-2946. https://doi.org/10.1109/TENCON.2016.7848584
[65] Jadagerimath, A.N., Mallikarjunaswamy, S., Kumar, M., Sheela, S., Prakash, S., Tevaramani, S.S. (2023). A Machine Learning based Consumer Power Management System using Smart Grid. In 2023 International Conference on Recent Advances in Science and Engineering Technology (ICRASET), B G NAGARA, India, pp. 1-5. https://doi.org/10.1109/ICRASET59632.2023.10419979