Henoch Juli Christanto*![]() | Lukas
| Lukas![]() | Stephen Aprius Sutresno
| Stephen Aprius Sutresno![]() | Jenne Karolen
| Jenne Karolen![]()
© 2024 The authors. This article is published by IIETA and is licensed under the CC BY 4.0 license (http://creativecommons.org/licenses/by/4.0/).
OPEN ACCESS
Unika Atma Jaya, recognized as one of Indonesia's leading private universities, utilizes information system technology to support both operational and academic activities. However, there is noticeable inconsistency in the implementation of this technology, especially in effectively integrating it with relevant work units. Several existing information systems fall short of meeting user satisfaction. This research investigates user satisfaction with Information Technology (IT) services at Unika Atma Jaya using the Service Quality (Servqual) model, which includes Tangibles (X1), Reliability (X2), Responsiveness (X3), Assurance (X4), and Empathy (X5) as variable. The analysis reveals that the Tangibles and Reliability dimensions significantly contribute to positive user satisfaction, with respective significant values of 0.000 and 0.001, along with corresponding T-table values of 4.197 and 3.323. This underscores the crucial role of tangible aspects, like facilities, and the reliability of service delivery in enhancing overall user satisfaction. Conversely, the Responsiveness dimension, with a significant value of 0.251 and a T-table value of 1.150, does not show a statistically significant impact on user satisfaction, indicating that users' perceptions of prompt service delivery may not be a decisive factor. Furthermore, the Assurance dimension exhibits a significant negative impact, with a value of 0.000 and a T-table value of -3.542, emphasizing the need for careful management in this area to prevent adverse effects on overall user satisfaction. In conclusion, a focus on improving Tangibles and Reliability dimensions, while addressing Assurance-related challenges, is vital for optimizing the user satisfaction landscape at Unika Atma Jaya. Recommendations include targeted enhancements in IT services in Tangibles and Reliability, specifically in applications and on-campus facilities. These numerical findings serve as a strategic basis for developing more effective, consistent, and responsive IT services to meet user expectations in the future, particularly within the relevant unit (BSTI).
service quality, Servqual, user satisfaction, IT service
In the context of globalization and rapid advancements in information technology, the use of Information Technology (IT) in the educational environment has become increasingly crucia [1, 2]. Higher education institutions, such as universities, are increasingly reliant on IT systems and services to support various academic and administrative activities [3]. At Atma Jaya Catholic University (Unika Atma Jaya), a renowned institution of higher learning, the implementation of quality IT services is a key element in ensuring smooth operations and user satisfaction [4]. However, this technology still shows inconsistency, requiring further integration with related functional units. Several information systems remain underutilized, creating gaps in meeting user satisfaction [5].
Biro Sistem Teknologi dan Informasi (BSTI) plays a key role in overseeing various information systems, including the Atma Jaya mobile application (known as AIDA) for attendance tracking, the Oracle PeopleSoft Campus Solutions platform (known as MyAtma) for course planning (Kartu Rencana Studi, KRS), access to academic information through the official website of Unika Atma Jaya, and Wi-Fi facilities available at various locations on the Unika Atma Jaya campus.
The importance of user satisfaction assessment regarding IT services is crucial in measuring the success of technology implementation in the Unika Atma Jaya campus environment, and it can also serve as feedback for BSTI to enhance IT services further [6]. Therefore, this research aims to evaluate the level of user satisfaction with IT services at Unika Atma Jaya using a service quality approach method. This approach details the evaluation based on generally recognized service quality dimensions such as responsiveness, reliability, assurance, empathy, and physical aspects (tangibles).
Through the analysis of user satisfaction with IT services using the service quality framework, it is expected to identify detailed aspects that can be improved and points of excellence that need to be maintained. Thus, the findings of this research are anticipated to provide valuable input in efforts to enhance the quality of IT services on this campus. Furthermore, the research findings are also expected to offer insights to other higher education institutions facing similar challenges, contribute to the continuous development of IT services in higher education, and strengthen Unika Atma Jaya's position as an innovative and responsive educational institution to technological advancements.
An analysis is a study that uses information that can be used to conclude, so it can be interpreted that analysis is an activity of conducting a discussion on an object whose next stage is to use data processing, after which conclusions can be drawn [7]. The analysis is also about studying existing systems to design new plans or update existing ones [8]. From the above definitions, we can conclude that analysis is the research stage of studying a system, which aims to find problems that arise and facilitate the system design stage—an activity to describe and find solutions that someone does to look at an object in detail [9].
2.1 Information system satisfaction
A system can be defined as a set of procedures, methods, and ways of working that are carried out to achieve a specific goal [10]. Information is a form of data processed to perform a particular purpose. Data is still "raw" information and needs to be processed further to be used and utilized [11, 12]. How it is processed, and the type of data used depends on each institution's description and needs [7, 13]. There are several system characteristics, such as System components that make up the system, also known as subsystems [14]. System boundaries are parts that describe one system with another plan [15]. This system limitation can also be called the system boundary or scope [16].
2.2 Academic information system
The academic information system is designed to manage educational information by applying hardware or software technology so that the work process can be carried out correctly and precisely and become helpful information. This system's purpose is to support educational institutions' management system so universities can provide more appropriate, reasonable, and practical information services for users [17].
2.3 Service quality
Service Quality (Servqual) is a service quality that can be defined as the difference between the reality of the service received by customers and customer expectations. [18]. The Servqual method is a commonly used method for measuring service quality [19]. The concept of service quality is an evaluative factor that reflects consumer perceptions of five specific aspects of service performance [20, 21]. The satisfaction index with the Service Quality method is Tangibles, Reliability, Responsiveness, Assurance, and Empathy [22].
Servqual calculations are obtained by indicating each variable. Either perception variables or expectation variables were obtained from questionnaires distributed to consumers or expected variables [23]. The results of the respondent's evaluation are processed to determine the Servqual score. The Servqual model employs a multi-dimensional scale to assess service quality, encompassing customer expectations, perceptions, and gaps in order to measure and identify areas of improvement [24, 25]. To obtain the desired data, the operational research variables are shown in Table 1.
Table 1. Research instrument variable
|
Variable |
Dimensions |
|
Tangibles |
Facilities, Equipment, Availability, Format |
|
Reliability |
Fixed & Appropriate, Reliable, Thorough & Accurate |
|
Responsiveness |
Handling complaints from system users, Speed of information for users |
|
Assurance |
Proficiency, Trustworthiness, Integrity |
|
Empathy |
Ease of access, Comprehension |
2.4 Related works
The previous research conducted by Maryana evaluated the quality of the website of the Faculty of Economics and Business at University X in Indonesia using the Importance Performance Analysis (IPA) method. This study yielded the highest performance score for the Information Quality variable at 3.86 and the lowest for the Usability variable at 3.75 [26]. This research shares similarities with a study conducted in terms of the research case, which is a university. However, this study has a broader scope, focusing not only on the website but also on various other applications and Wi-Fi services within the IT service domain. Another difference lies in the methodology employed, namely the Service Quality (Servqual) method. The choice of the Servqual method for this study was driven by its emphasis on customer satisfaction measurement for each variable, whereas the IPA method prioritizes variables based on importance and performance values.
Another study by Putri measured IT performance using the Servqual method to explore the expected service perceptions from the Information Systems Unit at University X. Despite annual evaluations through balanced scorecards and satisfaction questionnaires, the results were contradictory. Therefore, a reevaluation was conducted using the Servqual method, concluding that immediate action was needed in dimensions such as inadequate physical facilities like hardware and software, and processes related to academic activities, such as system access failures, card recording errors, and student attendance list inaccuracies [27]. This research contributes to the field by advocating for the use of the Servqual method in measuring IT service performance at a university to avoid incongruent results.
3.1 Research methodology
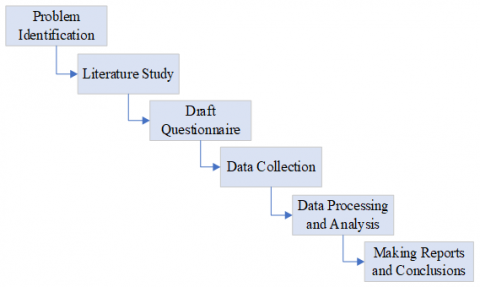
Research Stages to analyze IT service user satisfaction using the Service Quality (Servqual) method, as set out in the stages of the Figure 1.
The selection of SERVQUAL (Service Quality) as the primary instrument for evaluating service quality and satisfaction at Campus 3 of Atma Jaya University is based on its excellence that distinguishes it from similar tools. SERVQUAL is known for its comprehensive and multi-dimensional approach, covering five key dimensions that detail critical aspects such as responsiveness, reliability, assurance, empathy, and tangibles [18]. This excellence is highly relevant when assessing the complexity of IT services in a university environment. The customer-centric focus of SERVQUAL provides a strong foundation, ensuring assessments align with user expectations and perceptions, particularly in the context of IT services in higher education.
Another advantage that reinforces the selection of SERVQUAL is its ability for benchmarking and gap analysis [28]. This instrument allows for comparisons between perceived and expected service quality, providing concrete guidance for service improvements based on user needs [29]. The reliability and validity of SERVQUAL across various industries affirm confidence in this instrument, while its customizable and universal nature indicates its suitability for evaluating IT services in a campus environment. Thus, the choice of SERVQUAL has a positive impact on measuring service quality and satisfaction at Atma Jaya University, providing a solid foundation for a thorough understanding of the delivery of IT services in the context of higher education.
3.2 Research hypothesis
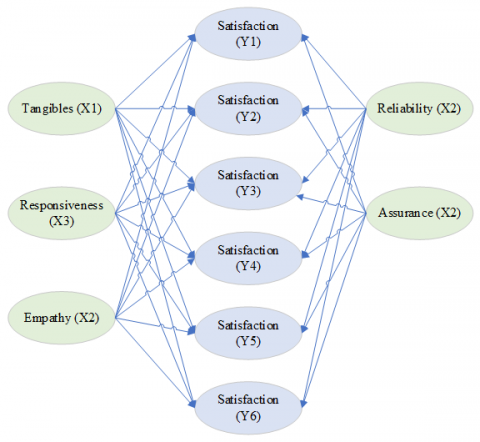
Based on the research scheme (see Figure 2), there are variables (X), including Tangibles, Reliability, Responsiveness, Assurance, & Empathy. And variable (Y) consists of E-learning satisfaction (Y1), Atma Jaya Website (Y2), MyAtma (Y3), AIDA Application (Y4), Computer (Y5), and Wi-Fi (Y6).
3.3 Questionnaire design
Surveys can comprise closed-ended or open-ended questions or statements, which can be administered directly to participants or distributed through various channels such as social media or the internet [30]. The Measurement can be seen from Tables 2-7.
Figure 1. Stage of research methodology
Figure 2. Scheme of research
Table 2. Measurement of tangible
|
E-Learning |
The E-Learning has an attractive color arrangement. |
|
The E-Learning website is easy for users to navigate due to its user-friendly layout. |
|
|
The E-Learning gives clear information through its features. |
|
|
Website |
The website looks nice with its color scheme. |
|
The website is user-friendly with an easy-to-use layout. |
|
|
The features inside the website provide clear information. |
|
|
My Atma |
The MyAtma website has an appealing color arrangement. |
|
The user interface of the MyAtma is designed to be user-friendly. |
|
|
The features inside the MyAtma provide clear information. |
|
|
AIDA |
The AIDA app looks nice with its colors. |
|
The AIDA app is easy to use with a simple layout. |
|
|
The features in the AIDA app give clear information. |
|
|
Computer |
Computers are available according to user needs. |
|
Computer placements are in strategic locations. |
|
|
Computer facilities work well. |
|
|
Facilities in the lab room provide comfort for users. |
|
|
Wifi |
Wifi is available as per user needs. |
|
Wifi placements are in strategic locations. |
|
|
Wifi facilities work well. |
Table 3. Measurement of reliability
|
E- Learning |
The website provides accurate information to users. |
|
Timeliness in delivering relevant information for users. |
|
|
The ability to access the E-Learning website from different locations. |
|
|
The E-Learning website can be accessed anytime. |
|
|
Website |
The website provides correct information to users. |
|
Timely delivery of relevant information for students. |
|
|
The ability to access the Atma Jaya website from different locations. |
|
|
The Atma Jaya website can be accessed anytime. |
|
|
My Atma |
The website provides accurate information to users. |
|
Timely delivery of relevant information for users. |
|
|
The ability to access the MyAtma website from different locations. |
|
|
The MyAtma website can be accessed anytime. |
|
|
AIDA |
The application provides accurate information to users. |
|
Timely delivery of relevant information for users. |
|
|
The ability to access the AIDA application from different locations. |
|
|
The AIDA application can be accessed anytime. |
|
|
Computer |
Users can easily connect to computers. |
|
Computers can be accessed anytime. |
|
|
Wifi |
Users can easily connect to Wifi. |
|
The ability to access Wifi from different locations. |
|
|
Wifi can be accessed anytime. |
|
|
Reliable internet access, whether in the morning, afternoon, evening, or night. |
Table 4. Measurement of responsiveness
|
E- Learning |
IT support quickly handles issues with the E-Learning website. |
|
Learning through the E-Learning website is easy and information is clear. |
|
|
Information about the content within the E-Learning website is quickly available. |
|
|
Website |
IT support promptly addresses issues with the Atma Jaya website. |
|
Information about the University through the Atma Jaya website is easy to access and clear. |
|
|
Information about the content within the Atma Jaya website is quickly available. |
|
|
My Atma |
IT support quickly handles issues with the MyAtma website. |
|
Learning through the MyAtma website is easy, and information is clear. |
|
|
Information about the content within the MyAtma website is quickly available. |
|
|
AIDA |
IT support promptly addresses issues with the AIDA application. |
|
Learning through the AIDA application is easy, and information is clear. |
|
|
Information about the content within the AIDA application is quickly available. |
|
|
Computer |
It's easy to contact IT support for computer-related issues. |
|
IT support quickly handles computer-related issues. |
|
|
The provided computers work smoothly. |
|
|
Wifi |
IT support promptly addresses Wifi-related issues. |
|
It's easy to access Wifi. |
|
|
The provided Wifi works smoothly. |
Table 5. Measurement of assurance
|
E- Learning |
The E-Learning website aligns with the user's access rights. |
|
It's comfortable to use the E-Learning website. |
|
|
The E-Learning website meets user needs. |
|
|
Trust and confidence in attached documents on the E-Learning website. |
|
|
Website |
The Atma Jaya website aligns with the user's access rights. |
|
It's comfortable to use the Atma Jaya website. |
|
|
The Atma Jaya website meets user needs. |
|
|
Trust and confidence in attached documents. |
|
|
My Atma |
The MyAtma website aligns with the user's access rights. |
|
It's comfortable to use the MyAtma website. |
|
|
The MyAtma website meets user needs. |
|
|
Trust and confidence in attached documents. |
|
|
AIDA |
The AIDA application aligns with the user's access rights. |
|
It's comfortable to use the AIDA application. |
|
|
The AIDA application meets user needs. |
|
|
Trust and confidence in attached documents. |
|
|
Computer |
Computers align with the user's access rights. |
|
Comfortable use of the provided computers. |
|
|
Wifi |
Wifi aligns with the user's access rights. |
|
Comfortable use of Wifi. |
Table 6. Measurement of empathy
|
E- Learning |
The E-Learning website can be accessed by users of all ages. |
|
IT Support provides information/understanding to users about the E-Learning website facing issues. |
|
|
Website |
The Atma Jaya website can be accessed by users of all ages. |
|
IT Support provides information/understanding to users about the Atma Jaya website facing issues. |
|
|
My Atma |
The MyAtma website can be accessed by users of all ages. |
|
IT Support memberikan informasi/pemahaman kepada pengguna tentang situs Web MyAtma yang mengalami masalah |
|
|
AIDA |
The AIDA application can be accessed by people of all ages. |
|
IT Support provides information/understanding to users about the MyAtma website facing issues. |
|
|
Computer |
The AIDA application can be accessed by users of all ages. |
|
IT Support provides information/understanding to users about computers facing issues. |
|
|
Wifi |
Wifi can be accessed by users of all ages. |
|
IT Support provides information/understanding to users about Wifi facing issues. |
Table 7. Measurement of satisfaction
|
Satisfaction |
The website/application is easy and clear for users to use. |
|
The user interface of the website/application is easy to understand and not confusing for users. |
|
|
The website/application can be accessed anytime by users. |
|
|
Users feel safe and comfortable when accessing IT services (Software & Hardware). |
|
|
Computer and Wifi facilities work well. |
|
|
Users can easily connect to computers and Wifi. |
|
|
IT Support responds when users experience issues with the use of IT services (Software & Hardware). |
The measurement scale used to generate quantitative data is the Likert Scale. The Likert Scale measures individual agreement or disagreement with program plans, program performance, or the level of program success [31]. The Likert Scale is also used to measure individual or group perceptions, attitudes, or opinions about an event (see Table 8).
Table 8. Question score according to likert scale
|
Number |
Option |
Score |
|
1. |
Strongly Agree |
5 |
|
2. |
Agree |
4 |
|
3. |
Neutral / Uncertain |
3 |
|
4. |
Disagree |
2 |
|
5. |
Strongly Disagree |
1 |
3.4 Data collection
The population is an area that already consists of objects or subjects with some capacities with specific characteristics studied by researchers and conclusions drawn about the people [32]. The population in this study are active users of Unika Atma Jaya IT services, such as Lecturers and Active Students, for the population of active users of Unika Atma Jaya IT services is up to 10,000 people.
The sample is called part of the total population in a study. The following are the sample criteria for this study: 1. Active users of IT services at Unika Atma Jaya; 2. Have used IT services in terms of software and hardware at Unika Atma Jaya; 3. Respondents are willing to become research subjects.
This research employs a probability-based sample selection method. Probability sampling holds a particular advantage in research methodology due to its capability to afford each element in the population a known and non-zero chance of inclusion in the sample [33, 34]. This ensures equitable representation, allowing researchers to generalize findings to a broader population with a higher level of confidence [35]. The sample collection is based on feedback from questionnaires distributed through university mail. The minimum required sample size is calculated using a cross-sectional approach, as depicted in Eq. (1):
$n=\frac{Z_{1-\alpha / 2}^2 P(1-P) N}{d^2(N-1) Z_{1-\alpha / 2}^2 P(1-P)}$ (1)
Keterangan:
n: jumlah sampel
Z: skor z pada kepercayaan 95% = 1.96
$\alpha$: derajat kepercayaan
P: maksimal estimasi = 0.5
d: alpha (0.05) atau sampling error = 5%
The result of the sample calculation using Eq. (1) by inputting a population value of 10,000 can be calculated as follows:
$\begin{aligned} & n=\frac{1.96^2 \times 0.5(1-0.5) \times 10,000}{0.05^2(10,000-1) \times 1.96^2 \times 0.5(1-0.5)} \\ & n=369.98 \\ & \end{aligned}$ (2)
The result of the sample calculation using the cross-sectional formula yielded a sample size of 369.98 respondents, rounded up to 370 respondents. For the questionnaire distribution, user information such as faculty, gender, and region was collected. The total number of respondents in the questionnaire distribution was found to be 372 respondents.
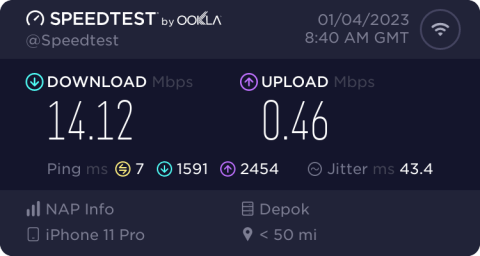
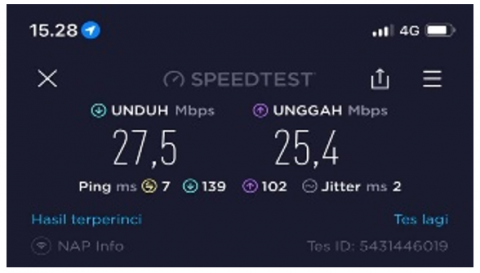
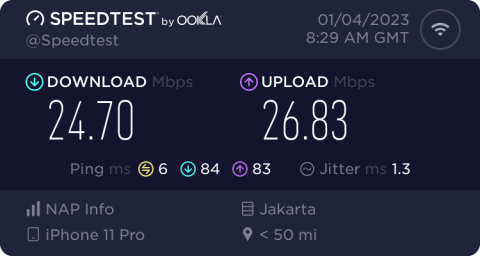
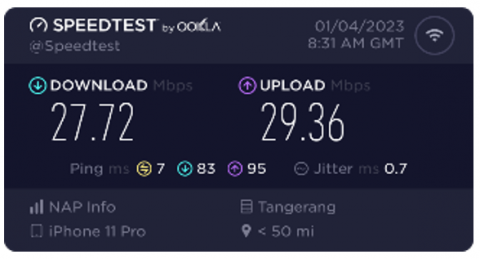
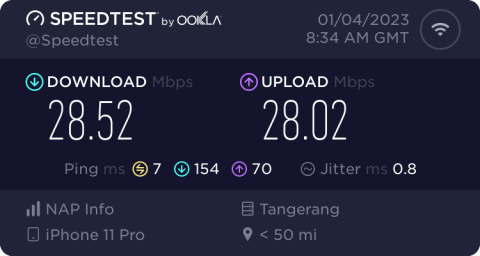
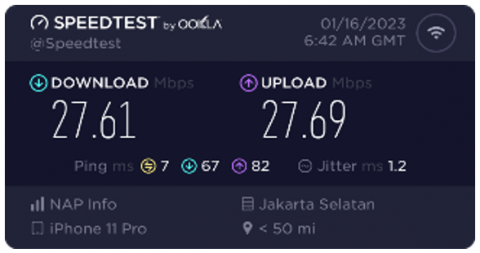
3.5 Wifi environment
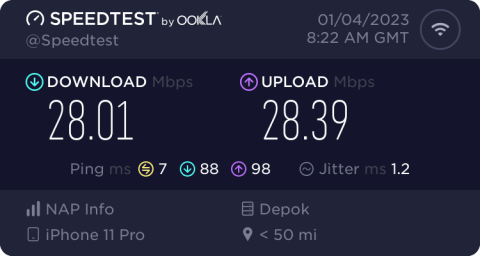
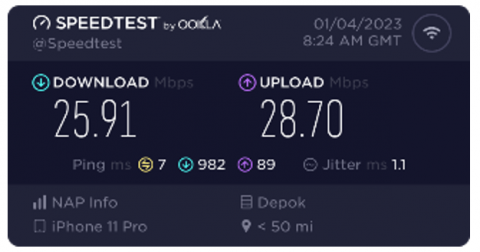
Wifi measurements were taken at Building A at Campus 3 Unika Atma Jaya (at BSD) using the speed test application tool to get the results from Figure 3.
Figure 3. Wi-Fi speedtest
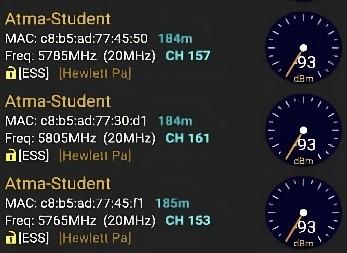
3.6 Wi-Fi dBm measurement
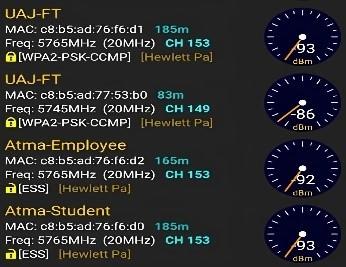
Wi-Fi Analyzer is a software that can measure the signal strength received through a cellphone so that it can see the power of the signal being tested by looking at the signal quality level scale by Table 9.
In the lake area (5.0 GHz access point). It can be seen from the Figure 4 that if the atma-student Wi-Fi has a signal strength of -93 dBm, then the lake area signal strength is fair.
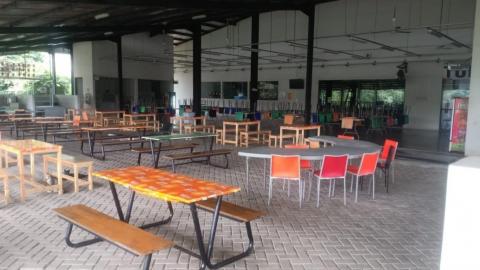
In the canteen area (5.0 GHz access point). It can be seen from the Figure 5 that if the atma-student Wi-Fi has a signal strength of -93 dBm, then the signal strength of the lake area is fair.
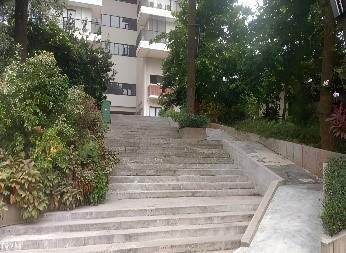
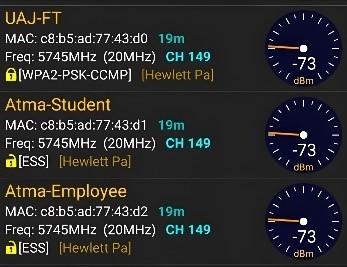
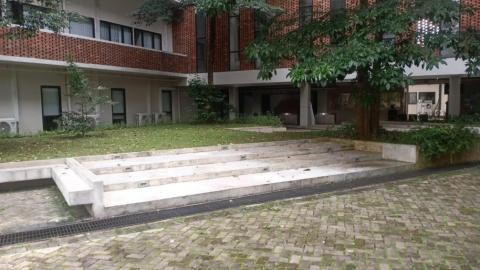
In the park area (5.0 GHz access point). It can be seen from the Figure 6 that if the atma-student Wi-Fi has a signal strength of -73 dBm, then the park area signal strength is good.
Figure 5. dBm of cafetaria
Table 9. dBm Table
|
Signal Strength |
RSSI |
|
Excellent |
> -70 dBm |
|
Good |
-70 dBm to -85 dBm |
|
Fair |
-86 dBm to -100 dBm |
|
Poor |
< -100 dBm |
|
No Signal |
-110 dBm |
The following are the research instruments used in collecting data. Researchers will use 98 statements based on the Servqual dimension and the Likert Scale to measure each piece of information presented to respondents. The design of the statements in the questionnaire is taken from the indicators determined in Servqual. In this study, researchers used 5 variables (X) consisting of Tangible (X1), Reliability (X2), Responsiveness (X3), Assurance (X4), Empathy (X5) and 6 indicators of the variable (Y). So the number of indicators obtained is 98 statements.
4.1 Analysis of respondents
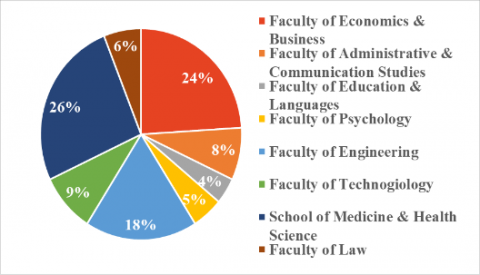
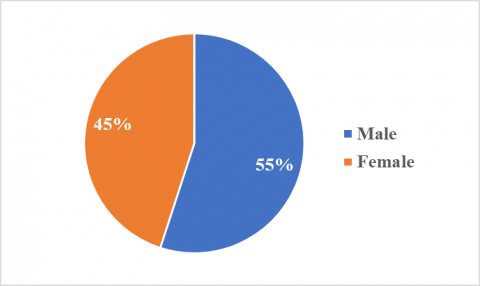
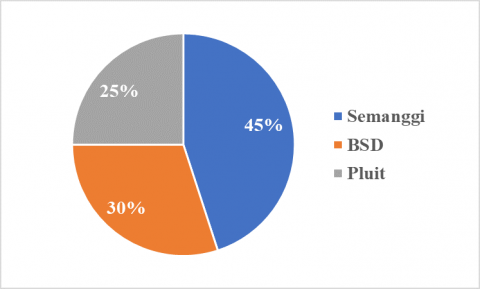
Figure 7. Respondents
Based on Figure 7, from the sample that has been taken, Figure 7(a) 372 respondents for the faculty grouping each respondent, the most samples who filled out the questionnaire are the Faculty of Economics and Business as much as 24%, the Faculty of Medicine as much as 26%, the Faculty of Engineering as much as 18%, the Faculty of Technology as much as 9%, the Faculty of Administrative Sciences and Communication Sciences as much as 8%, the Faculty of Law 6%, the Faculty of Psychology 5%, and the last is the Faculty of Education & Languages as much as 4%. Then Figure 7(b) of the sample in terms of gender, the overall selection is male 55% & female 45%. Figure 7(c) is divided into 3 groupings of campus areas from each respondent. The most samples filling out the questionnaire are the Semanggi area, as much as 45%, then the Bumi Serpong Damai (BSD) area, as much as 30% and after that, the Pluit area, as much as 25%.
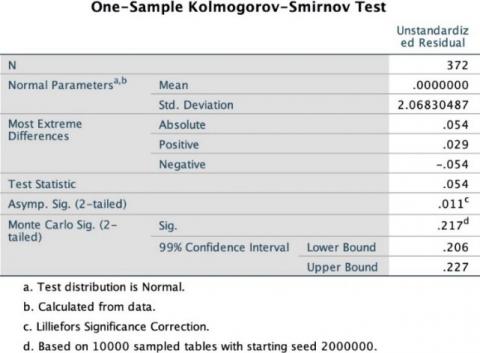
4.2 Normality test
The sig value of Kolmogorv-Smirnov with the Monte Carlo approach is 0,217, which means that the confidence level is greater than 0,05 (0,217 > 0,05), and it is concluded that this sample data shows the normal distribution [36] (see Figure 8).
Figure 8. Normality test
4.3 Validity test
The validity test is conducted to help ensure that the measuring instrument indeed measures what is intended or accurately gauges, so that the results can be reliable and relevant [37]. After testing the validity using SPSS 26.0, all statements given to respondents are declared valid, and data processing can be carried out. The following is a validity test of each piece of information in the questionnaire for each dimension:
(1) Tangibles: range of person correlation 0,211 – 0,590 with R Table 0,10, the tangibles variable is said to be Valid.
(2) Reliability: range of person correlation 0,201 – 0,607 with R Table 0,10, the Reliability variable is said to be Valid.
(3) Responsiveness: range of person correlation 0,260 – 0,576 with R Table 0,10, the Responsiveness variable is said to be Valid.
(4) Assurance: range of person correlation 0,307 – 0,556 with R Table 0,10, the Assurance variable is said to be Valid.
(5) Empathy: range of person correlation 0,374 – 0,651 with R Table 0,10, the Empathy variable is said to be Valid.
(6) Satisfaction: range of person correlation 0,493 – 0,615 with R Table 0,10, the Satisfaction variable is said to be Valid.
4.4 Reliability test
Reliability testing evaluates the constancy and dependability of measurements or instruments employed in research. This process guarantees that the measurements produce dependable results consistently, both over time and across various conditions [38]. This study uses Cronbach's Alpha coefficient formula. Variables can be declared reliable if they have a Cronbach's Alpha value > 0.60, and the results obtained from the 6 variables above that the Cronbach alpha value > 0.60, so the reliability test for the 6 variables above is declared reliable [39]. Reliability test result can be seen on Table 10.
Table 10. Reliability test result
|
Variable |
Variable |
Description |
|
Tangibles |
0,60 |
Reliable |
|
Reliability |
0,60 |
Reliable |
|
Responsiveness |
0,60 |
Reliable |
|
Assurance |
0,60 |
Reliable |
|
Empathy |
0,60 |
Reliable |
|
Satisfaction |
0,60 |
Reliable |
4.5 Multicollinearity test
The multicollinearity test looks at the Tolerance Value and VIF (Variance Inflation Factor). The trick is knowing whether or not there is a multicollinearity test deviation by looking at the Tolerance value > 0,10 and the VIF value < 10 [40]. If later the multicollinearity test results are declared not to occur, the predictive power is stable, and vice versa. If the data processing results turn out to be multicollinearity, the predictive power may not be reliable, so later, it may also not be stable. Multicollinearity test result can been seen on Table 11.
Table 11. Multicollinearity test result
|
Variable |
Tolerance |
VIF |
Description |
|
Tangibles |
0,3220 |
3,1030 |
No Multicollinearity |
|
Reliability |
0,1500 |
6,6560 |
No Multicollinearity |
|
Responsiveness |
0,1680 |
5,9490 |
No Multicollinearity |
|
Assurance |
0,1430 |
6,9710 |
No Multicollinearity |
|
Empathy |
0,2010 |
4,9790 |
No Multicollinearity |
4.6 Heteroscedasticity test
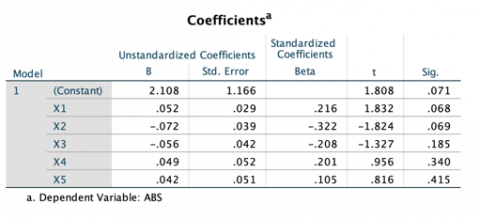
Suppose the correlation between the independent variable and the residual reaches a significance greater than 0.05 (Sig > 0,05). In that case, there is no heteroscedasticity problem, and from the 5 variables above the sig value> 0.05, it is stated that there is no heteroscedasticity (see Figure 9).
Figure 9. Heteroscadistity test result
4.7 Multiple linear regression test
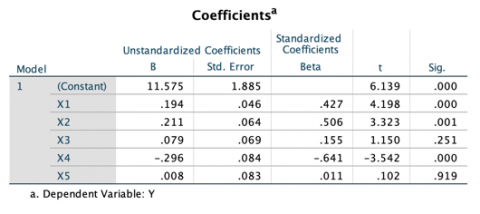
From the coefficients test results above, it is known that the regression coefficient (β) of the six variables on Tangibles is 0.194, Reliability 0.211, Responsiveness 0.079, Assurance -0.296, Empathy 0.008 (see Figure 10).
Figure 10. Coefficients test result
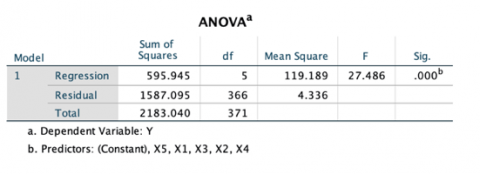
Based on the significance test table above, the Sig. Value is 0.000 < 0.05 and Fcount > Ftable is 27,486 > 2.27, then Ho is rejected, so it can be stated that there is a significant influence between Tangibles (X1), Reliability (X2), Responsiveness (X3), Assurance (X4), Empathy (X5) on Satisfaction (Y) (see Figure 11).
Figure 11. ANOVA test result
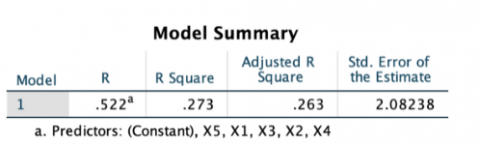
Based on the results of the SPSS output above, it is known that the R Square value is 0.522. It can be concluded that 52.2% of the variables Tangibles (X1), Reliability (X2), Responsiveness (X3), Assurance (X4), and Empathy (X5) can explain changes in Satisfaction (Y) and the remaining 47.8% which they think is influenced by other factors outside the variables that have been studied (see Figure 12).
Figure 12. Determination test result
Table 12. Hypothesis test result
|
Variable |
Coefficient Value |
T Statistics |
Sig. |
|
Tangibles (β) |
0.195 |
4,197 |
0,000 |
|
Reliability (β) |
0.212 |
3,323 |
0,001 |
|
Responsiveness (β) |
0.078 |
1,150 |
0,251 |
|
Assurance (β) |
-0.297 |
-3,542 |
0,000 |
|
Empathy (β) |
0.009 |
0,102 |
0,919 |
|
F-value |
27.487 |
|
|
(1) Based on the coefficient test conducted and hypothesis test result from Table 12, the regression coefficient (β) for the Tangibles (X1) variable in relation to Satisfaction (Y) is 0.195. The obtained F-value is 27.487. Moreover, the Tangibles variable demonstrates a significance value of 0.000, which is lower than 0.05 (0.000 < 0.05). This indicates a significant relationship between the variables examined in this study. The T-value is 4.197, exceeding the T-table value of 1.97 (4.197 > 1.97), thereby leading to the acceptance of the hypothesis. Therefore, it can be concluded that Tangibles (X1) have an influence on Satisfaction (Y). This can be interpreted as some applications of Unika Atma Jaya do not yet have a sufficiently good user interface design and fail to provide clear information on app usage. Additionally, the lack of adequate computer facilities and WiFi accessibility for all users contributes to the impact on satisfaction.
(2) In reference to the coefficient test results, the regression coefficient (β) for the Reliability (X2) variable with respect to Satisfaction (Y) is 0.212. The obtained F-value is 27.487. Furthermore, the Reliability variable exhibits a significance value of 0.001, which is less than 0.05 (0.001 < 0.05). Consequently, the variables used in this study display a significant relationship. The T-value is 3.323, surpassing the T-table value of 1.97 (3.323 > 1.97), leading to the acceptance of the hypothesis. Thus, it can be concluded that Reliability (X2) influences Satisfaction (Y). It can be concluded that some applications of Unika Atma Jaya are unable to provide accurate and reliable information. Furthermore, computer facilities and Wifi accessibility should be easily accessible at any time. These factors have implications for user satisfaction.
(3) According to the aforementioned coefficient test, the regression coefficient (β) for the Responsiveness (X3) variable in relation to Satisfaction (Y) is 0.078. The obtained F-value is 27.487. However, the significance value for the Responsiveness variable is 0.251, which exceeds 0.05 (0.251 > 0.05). This indicates an absence of a significant relationship between the variables examined in this study. The T-value is 1.150, smaller than the T-table value of 1.97 (1.150 < 1.97). Hence, the hypothesis is rejected, signifying that there is no influence between Responsiveness (X3) and Satisfaction (Y). Observing that Unika Atma Jaya has provided clear Standard Operating Procedures (SOP) regarding constraints in accessing applications and facilities, where users must follow the specified procedures. This is what causes Responsiveness not to have an impact on Satisfaction due to timing issues.
(4) Based on the provided coefficient test, the regression coefficient (β) for the Assurance variable (X4) in relation to Satisfaction (Y) is -0.297. The obtained F-value is 27.487. For the Assurance variable, the significance value is 0.000, which is less than 0.05 (0.000 < 0.05). This indicates a significant relationship between the variables examined in this study. The calculated T-value is -3.542, exceeding the T-table value of 1.97 (-3.542 > 1.97). Therefore, the hypothesis is rejected, suggesting that there is no influence between Assurance (X4) and Satisfaction (Y). This can be seen in the fact that Unika Atma Jaya's application has provided services according to user needs and instilled a level of confidence in user data protection rights. Therefore, this can be interpreted as Assurance having a negative impact on Satisfaction.
(5) As per the provided coefficient test, the regression coefficient (β) for the Empathy variable (X5) in relation to Satisfaction (Y) is 0.009. The obtained F-value is 27.487. In regards to the Empathy variable, the significance value is 0.919, which is greater than 0.05 (0.919 > 0.05). This implies that the variables examined in this study do not exhibit a significant relationship. The calculated T-value is 0.102, smaller than the T-table value of 1.97 (0.102 < 1.97). Therefore, the hypothesis is rejected, suggesting that there is no influence between Empathy (X5) and Satisfaction (Y). Usually, IT support provides service-related information regarding the availability or issues concerning applications and facilities through email. This information typically does not have a high level of urgency and is not a common problem, so it does not affect Satisfaction.
The calculation results indicate that user satisfaction with IT services at Unika Atma Jaya show that the Tangibles and Reliability variables have a significant positive impact on user satisfaction, while the Responsiveness variable does not have a significant influence. Moreover, the Assurance variable shows a significant negative impact, whereas the Empathy variable does not demonstrate a significant influence on user satisfaction.
This research addresses the issue of user satisfaction evaluation with Information Technology (IT) services at Atma Jaya Catholic University (Unika Atma Jaya), with a specific focus on the dimensions of service quality. The approach used in this study is the Service Quality (Servqual) model, successfully assessing user satisfaction with IT services at Unika Atma Jaya using the variables Tangibles (physical evidence), Reliability, Responsiveness, Assurance, and Empathy.
Upon a comprehensive examination of the test results, it becomes evident that certain dimensions of service quality have varying impacts on user satisfaction within the Unika Atma Jaya environment. Particularly, the Tangibles and Reliability dimensions emerge as significant contributors, indicating a positive and statistically significant impact on user satisfaction. This is evident from the significant values of Tangibles and Reliability variables, which are 0.000 and 0.001, respectively, with T-table values of 4.197 and 3.323. This suggests that improvements or enhancements in tangible aspects of service, such as facilities and physical evidence, as well as reliability in service delivery, can substantially increase overall user satisfaction. Conversely, the Responsiveness dimension, although tested, does not show a statistically significant impact on user satisfaction as it has a significant value of 0.251 and a T-table value of 1.150. This indicates that users' perceptions of prompt service delivery may not be a determining factor in their overall satisfaction. Interestingly, the Assurance dimension, while having the potential to build trust, demonstrates a significant negative impact on user satisfaction. The Assurance variable has a significant value of 0.000 and a T-table value of -3.542. This implies that careful management of aspects related to assurance is crucial to avoid negative effects on overall user satisfaction. Additionally, the Empathy dimension does not show a significant impact on user satisfaction with a significant value of 0.919 and a T-table value of 0.102. This indicates that empathetic understanding of user needs may not be a major factor in shaping user satisfaction in this context.
In conclusion, a nuanced approach to improving service quality, focusing on enhancing tangible aspects and reliability while addressing challenges related to assurance, appears crucial in optimizing the user satisfaction landscape at Unika Atma Jaya. This conclusion provides a deep understanding of the aspects that need improvement to ensure better IT services at Unika Atma Jaya, emphasizing tangible aspects, reliability, and special attention to managing the Assurance dimension. Suggestions for Unika Atma Jaya, especially the relevant unit (BSTI), include paying more attention to and improving IT services in the Tangibles and Reliability aspects, covering applications and facilities on campus, as they have a significant influence on user satisfaction. Therefore, the findings of this research can serve as a strategic foundation for the development of better, consistent, and responsive IT services to meet user expectations in the future.
Further research on the quality of IT services and user satisfaction at Unika Atma Jaya can consider several directions. Focus could be placed on the Assurance dimension, which indicates negative impacts, with in-depth research to understand the factors influencing user trust. Longitudinal studies could be conducted to monitor changes in user satisfaction over time. Additionally, comparisons with similar institutions, qualitative analysis of Responsiveness, and integration of service provider and IT staff perspectives could provide deeper insights. Exploring the impact of external factors, such as technology trends and social changes, as well as evaluating user technology adoption, could also be useful research focuses. Thus, this research is expected to make a valuable contribution to understanding the quality of IT services and user satisfaction at Unika Atma Jaya.
[1] Qu, L., Dai, Y. (2024). Education hubs in a globalized world: The emergence of China. International Journal of Educational Development, 104: 102959. https://doi.org/10.1016/j.ijedudev.2023.102959
[2] Cornali, F., Tirocchi, S. (2012). Globalization, education, information and communication technologies: What relationships and reciprocal influences? Procedia-Social and Behavioral Sciences, 47: 2060-2069. https://doi.org/10.1016/j.sbspro.2012.06.949
[3] Christanto, H.J., Sutresno, S.A., Denny, A., Dewi, C. (2023). Usability analysis of human computer interaction in google classroom and microsoft teams. Journal of Theoretical and Applied Information Technology, 101(16): 6425-6425.
[4] Pal, D., Vanijja, V. (2020). Perceived usability evaluation of Microsoft Teams as an online learning platform during COVID-19 using system usability scale and technology acceptance model in India. Children and Youth Services Review, 119: 105535. https://doi.org/10.1016/j.childyouth.2020.105535
[5] Rita, P., Oliveira, T., Farisa, A. (2019). The impact of e-service quality and customer satisfaction on customer behavior in online shopping. Heliyon, 5(10): e02690. https://doi.org/10.1016/j.heliyon.2019.e02690
[6] Christanto, H.J., Sediyono, E. (2020). Analisa tingkat usability berdasarkan human computer interaction (HCI) untuk sistem pemesanan tiket online kereta api. Jurnal Sistem Informasi Bisnis, 10(2): 163-172. https://doi.org/10.21456/vol10iss2pp163-172
[7] Pohl, M., Staegemann, D.G., Turowski, K. (2022). The performance benefit of data analytics applications. Procedia Computer Science, 201: 679-683. https://doi.org/10.1016/j.procs.2022.03.090
[8] Jiewanto, A., Laurens, C., Nelloh, L. (2012). Influence of service quality, university image, and student satisfaction toward WOM intention: A case study on Universitas Pelita Harapan Surabaya. Procedia-Social and Behavioral Sciences, 40: 16-23. https://doi.org/10.1016/j.sbspro.2012.03.155
[9] Van Velsen, L.S., Steehouder, M.F., De Jong, M.D. (2007). Evaluation of user support: Factors that affect user satisfaction with helpdesks and helplines. IEEE Transactions on Professional Communication, 50(3): 219-231. https://doi.org/10.1109/TPC.2007.902660
[10] Christanto, H.J. (2022). Game theory analysis on marketing strategy determination of KAI Access and Traveloka based on usability of HCI (Human-Computer Interaction). Journal of Information Systems and Informatics, 4(3): 665-672. https://doi.org/10.51519/journalisi.v4i3.300
[11] Dewi, C., Juli Christanto, H. (2022). Combination of deep cross-stage partial network and spatial pyramid pooling for automatic hand detection. Big Data and Cognitive Computing, 6(3): 85. https://doi.org/10.3390/bdcc6030085
[12] Dewi, C., Chen, A.P.S., Christanto, H. J. (2023). Deep learning for highly accurate hand recognition based on yolov7 model. Big Data and Cognitive Computing, 7(1): 53. https://doi.org/10.3390/bdcc7010053
[13] Sutresno, S.A., Christanto, H.J., Singgalen, Y.A., Denis, D., Kevin, J., Mavish, S. (2023). Design and Development of a Mobile Application for Social Assistance. Journal of Information Systems and Informatics, 5(4): 1257-1273. https://doi.org/10.51519/journalisi.v5i4.573
[14] Dewi, C., Christanto, H.J. (2023). Automatic medical face mask recognition for COVID-19 mitigation: Utilizing YOLO V5 object detection. Revue d'Intelligence Artificielle, 37(3): 627-638. https://doi.org/10.18280/ria.370312
[15] Christanto, H.J., Sutresno, S.A., Simi, V.S., Dewi, C.., Dai, G. (2023). Analysis of game theory in marketing strategies of Tiktok and Instagram. Journal of Theoretical and Applied Information Technology, 101(22): 7100-7109.
[16] Alsabbagh, A.A.A. (2023). Evaluating the quality of delivery service from the customer's point of view using the importance-performance matrix. International Journal of Professional Business Review, 8(4): 14.
[17] Indrayani, E. (2013). Management of academic information system (AIS) at higher education in the city of Bandung. Procedia-Social and Behavioral Sciences, 103: 628-636. https://doi.org/10.1016/j.sbspro.2013.10.381
[18] Maghsoodi, A.I., Saghaei, A., Hafezalkotob, A. (2019). Service quality measurement model integrating an extended SERVQUAL model and a hybrid decision support system. European Research on Management and Business Economics, 25(3): 151-164. https://doi.org/10.1016/j.iedeen.2019.04.004
[19] Purcărea, V.L., Gheorghe, I.R., Petrescu, C.M. (2013). The assessment of perceived service quality of public health care services in Romania using the SERVQUAL scale. Procedia Economics and Finance, 6: 573-585. https://doi.org/10.1016/S2212-5671(13)00175-5
[20] Khudhair, H.Y., Jusoh, D.A.B., F Abbas, A., Mardani, A., Nor, K.M. (2020). A review and bibliometric analysis of service quality and customer satisfaction by using Scopus database. International Journal of Management, 11(8): 459-470.
[21] Zeithaml, V.A., Parasuraman, A., Berry, L.L. (1990). Delivering Quality Service: Balancing Customer Perceptions and Expectations. Simon and Schuster.
[22] Sugiarto, S., Octaviana, V. (2021). Service quality (SERVQUAL) dimensions on customer satisfaction: Empirical evidence from bank study. Golden Ratio of Marketing and Applied Psychology of Business, 1(2): 93-106. https://doi.org/10.52970/grmapb.v1i2.103
[23] Yu, H. (2021). An empirical research on the effect of service quality of home Apliance delivery on customer satisfaction based on SPSS. In 2021 International Conference on Big Data and Intelligent Decision Making (BDIDM), Guilin, China, 2021, pp. 14-18,. https://doi.org/10.1109/BDIDM53834.2021.00010
[24] KT, J., Peterkumar, D.F., Vakayil, S. (2020). The impact of service quality on customer satisfaction; an empirical study. International Journal of Management (IJM), 11(3): 76-88.
[25] Kononiuk, A., Gudanowska, A.E. (2022). The application of the customized Servqual model for career guidance training: Industry 4.0 challenges. Journal of Business Economics and Management, 23(4): 856-875. https://doi.org/10.3846/jbem.2022.16643
[26] Maryana, L., Komaladewi, R., Mulyana, A., Saefullah, K. (2022). Importance Performance Analysis (IPA) on Website Quality (Webqual): An evidence from a higher education institution in Indonesia. Advances in Social Sciences Research Journal, 9(2): 1-7. https://doi.org/10.14738/assrj.92.11696
[27] Putri, T.F., Nugraha, F.N., Pratami, D., Suwarsono, L. (2019). IT services quality measurement using IT SERVQUAL at university X. International Journal of Innovation in Enterprise System, 3(1): 15-23. https://doi.org/10.25124/ijies.v3i01.29
[28] Babakus, E., Boller, G. W. (1992). An empirical assessment of the SERVQUAL scale. Journal of Business research, 24(3): 253-268. https://doi.org/10.1016/0148-2963(92)90022-4
[29] Oli, A.A., Dhanasekaran, C. (2023). A study related to product service systems (PSS), SERVQUAL and knowledge management system (KMS)–A review. Materials Today: Proceedings, 80: 3579-3584. https://doi.org/10.1016/j.matpr.2021.07.321
[30] Kurniawan, N.B. (2018). A systematic literature review on survey data collection system. In 2018 International Conference on Information Technology Systems and Innovation (ICITSI), Bandung, Indonesia, pp. 177-181. https://doi.org/10.1109/ICITSI.2018.8696036
[31] Cheng, C., Lay, K.L., Hsu, Y.F., Tsai, Y.M. (2021). Can Likert scales predict choices? Testing the congruence between using Likert scale and comparative judgment on measuring attribution. Methods in Psychology, 5: 100081. https://doi.org/10.1016/j.metip.2021.100081
[32] Chawda, R.K., Kolla, V. John, B. (2021). Role of 5G in data collection and application. International Journal of Advanced Science and Technology, 30(1): 263-272.
[33] Wiśniowski, A., Sakshaug, J.W., Perez Ruiz, D.A., Blom, A.G. (2020). Integrating probability and nonprobability samples for survey inference. Journal of Survey Statistics and Methodology, 8(1): 120-147. https://doi.org/10.1093/jssam/smz051
[34] Tutz, G. (2023). Probability and non-probability samples: Improving regression modeling by using data from different sources. Information Sciences, 621: 424-436. https://doi.org/10.1016/j.ins.2022.11.032
[35] Pace, D.S. (2021). Probability and non-probability sampling-an entry point for undergraduate researchers. International Journal of Quantitative and Qualitative Research Methods, 9(2): 1-15.
[36] Ghasemi, A., Zahediasl, S. (2012). Normality tests for statistical analysis: A guide for non-statisticians. International journal of endocrinology and metabolism, 10(2): 486-489. https://doi.org/10.5812/ijem.3505
[37] Ab Hamid, M.R., Sami, W., Sidek, M.M. (2017). Discriminant validity assessment: Use of Fornell & Larcker criterion versus HTMT criterion. In Journal of Physics: Conference Series, 890(1): 012163. https://doi.org/10.1088/1742-6596/890/1/012163
[38] Peeters, M.J., Harpe, S.E. (2020). Updating conceptions of validity and reliability. Research in Social and Administrative Pharmacy, 16(8): 1127-1130. https://doi.org/10.1016/j.sapharm.2019.11.017
[39] Taherdoost, H. (2016). Validity and reliability of the research instrument; how to test the validation of a questionnaire/survey in a research International Journal of Academic Research in Management (IJARM), 5(3): 28-36. http://doi.org/10.2139/ssrn.3205040
[40] Shrestha, N. (2020). Detecting multicollinearity in regression analysis. American Journal of Applied Mathematics and Statistics, 8(2): 39-42. http://doi.org/10.12691/ajams-8-2-1