Afshan Hashmix![]() | Md Tabrez Nafis*
| Md Tabrez Nafis*![]() | Sameena Naaz
| Sameena Naaz![]() | Durgesh Nandan
| Durgesh Nandan![]() | Imran Hussain
| Imran Hussain![]()
© 2023 IIETA. This article is published by IIETA and is licensed under the CC BY 4.0 license (http://creativecommons.org/licenses/by/4.0/).
OPEN ACCESS
Diabetes is a chronic condition characterized by elevated levels of blood glucose, also known as hyperglycemia. Measurement of HbA1c is a widely used blood test that provides an essential tool for monitoring diabetic progression and assessing the effectiveness of diabetes management but this test is usually not conducted until there are some symptoms of diabetes in the patient and sometimes it goes unnoticed for a longer period resulting in the late detection of the disease. This study proposes a novel approach to HbA1c Prediction using machine learning regression algorithms on various features including Age, BMI, and hematological parameters. This study also compares the performance of ten machine learning regressors on the prediction of HbA1c level using performance metrics such as Mean square error, Root mean squared error, Mean absolute error MAE, R square, Adjusted R square, and Minimum Absolute Percentage Error. Result: Linear regression was found as the best performer with an R square and adjusted R square value of 1.00, Mean square error, Root mean squared error, Mean absolute error, and Minimum Absolute Percentage Error of 0.00. A higher HbA1c Level predicted using this method should go for actual HbA1c testing for confirmation.
diabetes, glycated hemoglobin, HbA1c, machine learning
HbA1c (glycated hemoglobin) is recognized as an important indicator for diabetes therapy. An increased HbA1c level raises the chance of acquiring diabetes-related health problems considerably. Correct HbA1c prediction can considerably improve the way diabetes patients are managed and perhaps minimize associated complications.
This study develops a methodology for predicting HbA1c levels using Machine learning regressors. Hemoglobin is a protein present in RBC that is used to transport oxygen all over the body. When hemoglobin is exposed to plasma sugars (glucose, galactose, or fructose) for an extended period, through a non-enzymatic process called glycation, it undergoes chemical modification resulting in the formation of glycated hemoglobin (HbA1c). The HbA1c level presents insight into blood sugar levels during the previous two or three months, which is necessary for diabetes treatment. HbA1c (glycated hemoglobin) is recognized as an important indicator for diabetes therapy. An increased HbA1c level raises the chance of acquiring diabetes-related health problems considerably. Correct HbA1c prediction can considerably improve the way diabetes patients are managed and perhaps minimize associated complications.
This study develops a methodology for predicting HbA1c levels using Machine learning regressors.
Fructosamine, hemoglobin A1c (HbA1c), and blood sugar levels are frequently used to identify diabetes mellitus. Since insulin plays an important role in diabetes diagnosis, the HbA1c measurement provides more reliable findings. This is because the HbA1c number provides information on the previous two to three months of blood sugar, which is necessary for blood sugar control. As a result, in recent years, this value has become increasingly popular. The HbA1c test was authorized as a diabetes diagnostic test by the American Diabetes Association in 2010. It's important to highlight that the standard range for this value spans from 3% to 6%, and the diagnostic threshold is set at 6.5% [1]. Blood glucose and hemoglobin in red blood cells combine to form glycated hemoglobin (HbA1c), whose composition depends upon the blood glucose levels and the duration of time that blood glucose comes into contact with hemoglobin, and is not associated with factors such as time of taking the sample or whether the patient is fasting or not [2]. According to research, lowering HbA1c levels can considerably reduce the risk of having major problems. As a result, frequent monitoring of HbA1c levels is advised for all diabetic patients as well as those at risk of acquiring diabetes [3]. Proactive precautionary treatments utilizing advanced prediction models and data from electronic health records (EHR) can eventually assist in giving improved health results [4]. Machine learning algorithms can figure out which clinical variables are important and use them to make predictions about how a patient will do in the future [1, 2]. Glycemic management is critical for lowering the risk of diabetic complications, Most persons with diabetes achieve optimum glycemic control if their HbA1c is less than 7.0% [5].
The American Diabetes Association (ADA) considers an HbA1c test reading of 5.7% or less to be non-diabetic. Pre-diabetes conditions are defined as HbA1c levels between 5.7% and 6.4%, whilst diabetes is defined as HbA1c values more than 6.5%. Advanced HbA1c prediction is critical for optimal diabetes monitoring [4].
Lower HbA1c levels are critical in preventing or delaying the onset of microvascular complications caused by diabetes. Yet, there is a link between high HbA1c levels and the onset of diabetes-related complications.
The ability to anticipate HbA1c based on current blood glucose patterns helps patients and clinicians to make modifications to treatment programs, lifestyles, and diets to prevent elevated HbA1c levels. As a result, early intervention will make it easier to avoid complications, ensuring improved diabetes management. Numerous research indicated that HbA1c levels can be used to predict the advancement of illnesses such as Cardiovascular, nerves, retina, and kidney damage [6]. Most T2DM patients will acquire varying degrees of problems as the condition progresses, reducing their quality of life and imposing a significant financial burden on them. The degree of complications is inextricably linked to glycemic management. As a result, active, safe, and effective blood glucose management has a favorable impact on averting complications, enhancing T2DM patients' quality of life, and lowering the cost burden on patients and society [2]. Measurement of HbA1c is a widely used blood test that provides an essential tool for monitoring diabetic progression and assessing the effectiveness of diabetes management but this test is usually not conducted until there are some symptoms of diabetes in the patient and sometimes it goes unnoticed for a longer period resulting in the late detection of the disease. Early detection of diabetes can help in the treatment and control of the disease. This study proposes a novel approach to HbA1c Prediction using machine learning regression algorithms on various features including Age, BMI, and blood-related factors. This research paper is structured into 5 parts, Section 2 contains the related work, Section 3 has a methodology, Section 4 contains results and discussion, and Section 5 contains the conclusion and future work.
Diabetes is an ongoing illness caused by the inefficacy or deficiency of insulin in the body. Diabetes, usually referred to as hyperglycemia, is a chronic illness marked by increased blood glucose levels. Clinical diagnosis of diabetes involves several criteria including symptoms, levels of glucose in the bloodstream after fasting, as well as assessments of glucose tolerance through oral tests. Another important marker in evaluating diabetes management is glycated hemoglobin (HbA1c). Clinical data and electronic health records are continuously being harnessed for disease diagnosis, prediction, and better management of chronic illness. Numerous researches have been carried out to predict diabetes using machine learning algorithms [7-23]. Various analysis of electronic health records has been done for diabetes management [19, 22]. Various machine-learning classifiers have been used for the classification of diabetic patients [24, 25]. Studies have also been conducted to compare the performance of machine learning algorithms in the prediction of diabetes [26, 27].
Researchers suggested that early detection of type 2 diabetes mellitus (DM2) through screening studies is crucial due to its latent pathology and the high risk of vascular complications, early disablement, and mortality associated with the disease hence study has been conducted to identify patient's status as diabetes or prediabetes [28]. The most incisive and affordable screening tool is HbA1c measurement, and the technique used for measuring HbA1c has to be standardized against a reference method. The paper recommends the use of screening tests for individuals with risk factors for DM2, regardless of the presence of clinical symptoms [29]. Several algorithms, namely logistic regression, Cox regression, decision tree, random forest, XGBoost Survival Embedding (XGBSE), and Extreme Gradient Boosting (XGBoost) were compared for diabetes prediction and XGBSE was found to be more efficient [26]. A deep learning model was developed to predict HbA1c using a noninvasive method of ECG [30].
Research by Lu Lin et al concluded that Participants with a higher hemoglobin glycation index were more susceptible to the possibility of developing diabetes in the future, regardless of their glycemic conditions. As a result, the hemoglobin glycation index may be used to identify those who are at high risk for diabetes [31].
Replication research carried out by Alhassan et al seeks to assess and evaluate a prediction model that forecasts glycated hemoglobin (HbA1c) levels using electronic health record (EHR) data. The initial study used data from a US population, but this replication study used data from a Saudi population using the KAIMRC dataset that included many features such as lab test reports of blood and other vital signs such as BMI, Blood pressure, and other features related to their clinical visit. The study discovered that utilizing multiple logistic regression models to predict HbA1c levels directly may not be acceptable for all groups and that the weighting of the variables must be adjusted to the population utilized. The study demonstrates that duplicating the original study with a new population can aid in predicting HbA1c values by utilizing predictors commonly gathered and kept in hospital EHR systems. collaborative denoising autoencoders were used and achieved an accuracy of 77% and an F1 score of 81% [3]. Researchers compared HbA1c and FPG as input features for the prediction of diabetes and found that HbA1c as a feature is better than FPG [3].
Researchers used the dataset from Turkey with 1283 females and 963 males with 27 parameters and proposed a data-mining-based method for detecting accurate Levels of HbA1c, a crucial indicator for diabetes mellitus diagnosis. The study achieves an accuracy rate of 90.33% in classifying HbA1c levels applying a min-max method for normalization and tenfold cross-validation methods using a neural network designed in a feed-forward architecture for hidden layer activation function sigmoid function was chosen and four classification method KNN, SVM, Random Forest and decision tree were used for evaluating the performance of neural network [16]. However, this study does not compare the proposed method with other machine learning algorithms or traditional statistical methods for diabetes diagnosis and prediction.
A model was developed to predict the HbA1c level by using data from a continuous glucose monitoring sensors device and it attained the maximum accuracy of 88.65%. but the limitations faced in this study were lots of missing data due to sensor device’s issue and discontinued wearing of sensors [4].
An analysis was done on real-world medical data of type 2 diabetes, recorded in cities of China. The dataset contained fundamental patient information, medication status, lab findings, eating and exercise habits, and the patient's actual follow-up following treatment. Individuals diagnosed with type 2 diabetes had blood glucose levels during a fasting state, and glycated hemoglobin was predicted using 16 different machine-learning algorithms. The most accurate prediction model for fasting blood glucose and HbA1c was produced using ensembled learning with customized random forest inputs, with AUC values of 0.819 and 0.970, respectively [2]. As discussed some studies tried to predict the HbA1c level using the data from wearable sensors but it has the problem of missing data due to the discontinuation of wearing the sensors hence this study uses the haematological parameters for the prediction of glycated hemoglobin. Most of the studies used accuracy and AUC as the evaluation metrics but since this study has used all the regression algorithms it uses MSE, RMSE, MAE, R2, and adjusted R2 as the performance metric. The goal of this study is to utilize a machine learning system to analyze diabetes data. Machine learning is one of the most successful and extensively utilized approaches in a variety of applications, including diabetes patient diagnosis. Several characteristics were supplied as input data to the model throughout the scope of this investigation. Experiments were conducted utilizing a variety of Regression approaches to predict HbA1c levels and evaluate the efficacy of Machine learning regressors during prediction.
This section gives an overview of the dataset used, the preprocessing of the data, and the algorithms used. All the implementation has been done in Jupyter Notebook using Python programming language. In this research, we have used ten machine learning regression algorithms on the diabetes dataset to predict the HbA1c value by regression methods. This study also compares and analyzes the performance of ten machine learning regressors on various performance metrics. The detailed description of this research is as follows.
3.1 Dataset
For this research "Dataset of Diabetes" collected from the laboratory of Medical City Hospital, Iraqi Society is used. The information was taken from patient files and laboratory reports to create this dataset. This dataset contains 1000 rows and 14 columns comprising the following information: ID (unique identifier of each record), No. of the patient is the patient's Identification number, Sex is the gender of the patient, the Patient’s Age in years, the Creatinine ratio (CR) of the patient, the Urea level in the blood, HbA1c level of glycated-hemoglobin in the past three months, TG (triglyceride), BMI(body mass index), LDL or bad cholesterol, chol (Cholesterol), HDL or good cholesterol, VLDL(lipoprotein that carries triglycerides), and Class(labeled as Diabetic, non-diabetic and pre-diabetic). Table 1 describes the statistics of the numerical column of the dataset.
Table 1. Description of the dataset
|
Statistics/ Columns |
Count |
Mean |
Median |
Min |
Max |
|
Age |
1000 |
53.5 |
55 |
20 |
79 |
|
Cr |
1000 |
68.9 |
60 |
6 |
800 |
|
Urea |
1000 |
5.12 |
4.6 |
0.5 |
38.9 |
|
HbA1c |
1000 |
8.28 |
8 |
0.9 |
16 |
|
BMI |
1000 |
29.5 |
30 |
19 |
47.75 |
|
Cholesterol |
1000 |
4.86 |
4.8 |
0 |
10.3 |
|
HDL |
1000 |
1.2 |
1.1 |
0.2 |
9.9 |
|
LDL |
1000 |
2.6 |
2.5 |
0.3 |
9.9 |
|
VLDL |
1000 |
1.85 |
0.9 |
0.1 |
35 |
|
TG |
1000 |
2.34 |
2 |
0.3 |
13.8 |
3.2 Data preprocessing
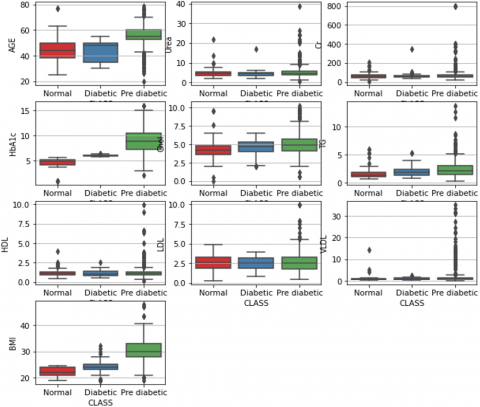
Out of 14 columns, columns “ID” and “No_pation” don’t have any important information for this study these two columns have been dropped straight away with 12 features remaining. This dataset was checked for any missing values and it was found that it doesn’t have any missing values. The “Gender” and “Class” columns were categorical. The “Gender” column was encoded into the numerical columns by changing Female to ‘0’ and Male to ‘1’. However, for the “CLASS” column there were three categories “N” i.e. non-diabetic, “Y” as diabetic, and “P” as pre-diabetic so we used ordinal encoding that is, 0 was assigned to non-diabetic, 1 was assigned to Pre-diabetic, and 2 was assigned to diabetic. To check the outliers we used the boxplot as shown in Figure 1. It is evident that there are outliers mostly in the diabetic class but from Table 1 and domain research, it has been found that these types of values do exist so it has not been considered outliers.
Table 2. Correlation values w.r.t to class
|
Features |
Correlation |
|
Class |
1 |
|
HbA1c |
0.26 |
|
BMI |
0.23 |
|
Gender |
0.13 |
|
Age |
0.12 |
|
TG |
0.11 |
|
Chol |
0.09 |
|
VLDL |
0, 03 |
|
Cr |
0.02 |
|
Urea |
0.01 |
|
LDL |
-0.02 |
|
HDL |
-0.02 |
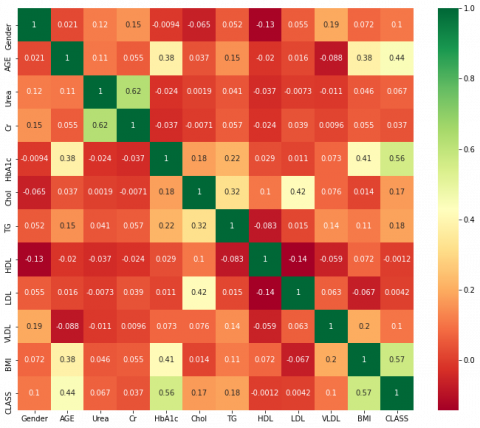
For further investigation, the correlation of features was checked by using a heatmap as shown in Figure 2. Urea and creatinine are highly correlated among other features but it is 0.62 so we are going to keep it. In this study, the focus is on the features that are highly correlated to the class as mentioned in Table 2 and Figure 3. HbA1c is the feature that is highly correlated as compared to other features with the target column Class. So in this study, HbA1c has been taken as the target variable and the other features will act as independent variables.
Figure 3. Bar Graph showing the correlation of features with the class
It was also evident from Table 1 that all the features have a different range of values and are measured at different scales so not all of them would be able to contribute equally to the model fitting to avoid this condition normalization of all the variables is necessary. To rescale the features min max scaler has been used here. Min Max Scaler rescales the data in such a way that all feature values fall between 0 and 1. The process of scaling the values by the min-max scaler is shown in Eq. (1).
$x_{\text {scaled }}=\frac{\mathrm{X}-\text { Min value of } \mathrm{x} \text { column }}{\text { Max value of } \mathrm{x} \text { column }- \text { Min value of } \mathrm{x} \text { column }}$ (1)
After our dataset is ready for modeling we are going to separate the features from the target. For this research, our target is to predict the Glycated hemoglobin i.e. HbA1c using the other features of this dataset.
3.3 Modeling and evaluation
Ten machine-learning regression algorithm has been used and compared in this study:
XGBoost is an ensemble method combining multiple decision trees to improve prediction accuracy. It uses a boosting method, where each tree is trained on the residuals of the previous tree, leading to a more refined prediction.
Random Forest is another ensemble technique that builds a collection of decision trees, where each tree is trained on a random subset of the data and features. It averages the predictions from all trees to reduce variance and improve generalization.
Linear Regression algorithm predicts the target variable’s value depending on the feature’s value. The target variable is often known as the outcome feature, whereas the independent variable is the one that is utilized for the prediction of the target variable. It estimates the coefficients of the linear equation using the least squares method. An equation of linear regression can be represented in Eq. (2):
$Y=a+b X$ (2)
where, X represents the features, Y represents the target, b denotes the slope, and A denotes the intercept of the line.
KNN Regression is a machine-learning approach that approximates the connection between independent variables and dependent continuous variables by averaging data of the k neighbors. The number of k must be chosen so that it reduces the mean-squared error to a maximum.
Support Vector Machine (SVM) Support Vector Regression is quite similar to Linear Regression The equation for the line is expressed as y=ax+c. In Support Vector Regression (SVR), this straight line is referred to as a hyperplane. The closest data points on either side of the hyperplane are called Support Vectors, and they play a crucial role in defining the boundary.
Decision Tree. It iteratively partitions a dataset into smaller subsets while simultaneously constructing a decision tree. The ultimate result is a tree structure comprising leaf nodes and decision nodes, where each decision node branches into two or more paths, and each path denotes a decision. A leaf node represents a numeric objective decision, while the root node at the top of the tree serves as the initial decision node.
Ridge regression is a machine-learning technique used in the evaluation of coefficients in a multiple-regression model. When the features are correlated to a significant degree, Ridge regression was developed as a potential solution to the issue of inaccuracy of least square estimators for the presence of highly correlated features in linear regression models.
In Gaussian process regression (GPR), each data point is treated as a random variable, and the model defines a distribution over functions that can explain the observed data. GPR assumes that any point in the feature space can be represented by a Gaussian distribution, and it captures uncertainty by estimating the mean and variance at each point.
LASSO Lasso is an acronym for least absolute shrinkage and selection operator. It is a type of linear regression with additional regularization. The L1 regularization technique is used in Lasso. It is used in both model selection as well as regularization. LASSO is useful for higher-dimensional data but careful tuning of its regularization parameter is highly recommended.
AdaBoostregressor (Adaptive Boosting) is a boosting approach used to turn weak learners into strong learners by first allocating sample weights and then utilizing decision trees. The sample weights are assigned based on the formula 1/n, given that n denotes the total number of records in a dataset. In Adaboost, decision trees are also known as base learners and should only have a depth of one, also known as stumps. we compare them to find the optimum decision tree with the lowest entropy and most information gain. After picking the best tree, we can observe the degree of accuracy with which the tree predicted the target values.
To assess the overall accuracy, sensitivity to outliers, and goodness of fit of the regression model for predicting HbA1c. By using a combination of MSE, RMSE, MAE, MAPE, R2, and adjusted R2, a comprehensive understanding of the model's performance can be gained. The performance of all the ten regression algorithms was compared and evaluated on the following metrics:
The MSE of statistical models is a metric to measure their level of accuracy. The average squared residual in a regression is the mean squared error. This is the mean squared variation between the predicted and actual values. A 100% accurate model gives the MSE zero. Its value of MSE rises with the inaccuracy of the model.
$M S E=\frac{\sum\left(Y_i-\hat{Y}_i\right)^2}{n}$ (3)
where,
Yiis the actual values.
$\hat{Y}_i$ is the predicted values, where Yi represents the real values and $\hat{Y}$ is ignifies the prediction values.
n is the sample size.
RMSE often referred to as the prediction error, measures the average magnitude of the differences between predicted values and actual values. The measurement of the distance between the line of regression and data points is based on the residuals, RMSE quantifies the dispersion or spread of these residuals.
$R M S E=\sqrt{\frac{\sum_{i=1}^n\left(\hat{Y}_i-Y_i\right)^2}{n}}$ (4)
where,
Yiis the actual values.
$\hat{Y}_i$ is the predicted values.
MAE is an inaccuracy metric that provides the mean of the absolute error, and absolute error here means the degree of the variation amongst the real values and model-predicted values.
$M A E=\frac{1}{n} \sum_{i=1}^n\left|\hat{Y}_i-Y_i\right|$ (5)
where,
Yiis the actual value.
$\hat{Y}_i$ is the predicted value.
n is the number of observations.
R square the coefficient of determination, often known as R2, is a measure that shows how well a model fits the data. A statistical assessment of the degree to which the regression line aligns with the observed data.
$R^2=1-\frac{R S S}{T S S}$ (6)
where, $\quad R S S=\sum_{i=1}^n\left(Y_i-\hat{Y}_i\right)^2$ and $T S S=\sum\left(Y_i-Y_m\right)^2$. Here, $Y_m$ is the mean of $Y$.
The residual sum of squares, or RSS, determines how much variation there is in the errors or residuals of a regression model.TSS is adding up the square of differences among the sample mean and individual data points. Adjusted R square R2 calculates the degree to which variables (datasets) follow a line or curve. Adjusted R2 assesses how well variables conform to a curve or line while considering the number of variables in a model. A value of one signifies the perfect prediction of the outcome variables. A value less than or equal to 0 signifies that the model lacks predictive value. Generally, Adjusted R2 values lie between 0 and 1.
Adjusted $R^2=1-\frac{\frac{R S S}{n-k}}{\frac{T S S}{n-1}}$ (7)
where, n signifies the count of data points, while k signifies the number of features.
Minimum Absolute Percentage Error (MAPE), is a method to evaluate how accurate a percentage model is in terms of percentage. It is used as a loss function frequently for model evaluation and regression analysis.
$M A P E=\frac{1}{n} \sum_{t=1}^n\left|\frac{A_t-P_t}{A_t}\right|$ (8)
where,
At = actual values,
Pt = Predicted values,
n = number of fitted points.
All evaluated algorithms except Lasso Regressor achieved near-perfect scores in MSE, RMSE, and R2, indicating their effectiveness in predicting HbA1c levels. However, XGB, RandomForestRegressor, and LinearRegression exhibited higher MAE values, suggesting limited sensitivity to small deviations. KNearestNeighbors and DecisionTree, on the other hand, had higher MAE values but lower R2 scores, indicating better sensitivity to small deviations but less accurate overall trends. Lasso Regressor achieved moderate scores across all metrics, indicating reasonable performance without excelling in any particular aspect.
Linear Regression achieved the most accurate result in all aspects while Lasso regressor achieved the least accurate result. As mentioned in Table 3, Linear Regression achieved the greatest result with the R2 and Adjusted R2 value of 1.00 which is the most accurate, it also produces zero error with mean squared error equal to zero, root mean squared error equal to zero, mean absolute error equal to zero, and mean absolute percentage error equal to zero. Which is an ideal scenario. Gaussian Process Regressor, Xtreme gradient boosting, and Random forest regression were the second, third, and fourth best respectively with slightly higher mean absolute error and root mean square error. Lasso regressor performs poorly in all the metrics.
Table 3. Performance metrics comparison of ten machine learning algorithms
|
Machine Learning Algorithm |
MAPE |
MSE |
Adjusted (R2) |
RMSE |
MAE |
R2 |
|
XGB |
0.00 |
0.00 |
1.00 |
0.06 |
0.02 |
1.00 |
|
Random Forest |
0.01 |
0.01 |
1.00 |
0.07 |
0.02 |
1.00 |
|
Linear Regression |
0.00 |
0.00 |
1.00 |
0.00 |
0.00 |
1.00 |
|
KNN |
0.08 |
0.44 |
0.93 |
0.66 |
0.47 |
0.94 |
|
SVR |
0.03 |
0.07 |
0.99 |
0.26 |
0.15 |
0.99 |
|
Decision Tree |
0.19 |
2.10 |
0.68 |
1.45 |
1.17 |
0.69 |
|
Ridge |
0.02 |
0.02 |
1.00 |
0.13 |
0.11 |
1.00 |
|
GPR |
0.00 |
0.00 |
1.00 |
0.01 |
0.00 |
1.00 |
|
Lasso |
0.34 |
6.84 |
-0.04 |
2.62 |
2.18 |
-0.00 |
|
Ada Boost |
0.02 |
0.03 |
0.99 |
0.18 |
0.12 |
1.00 |
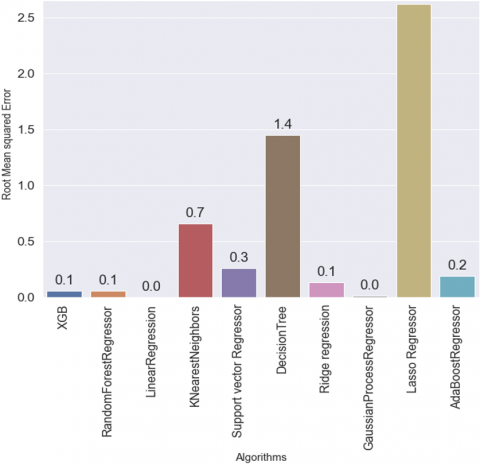
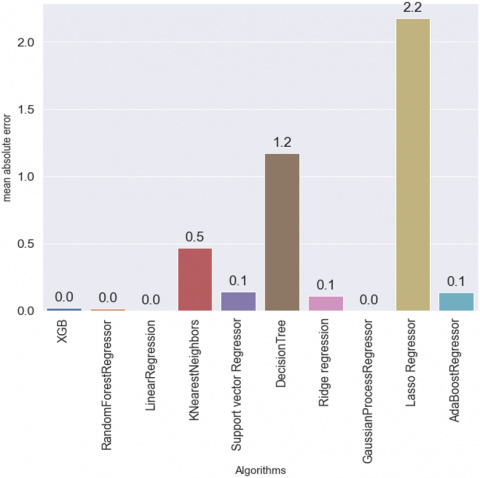
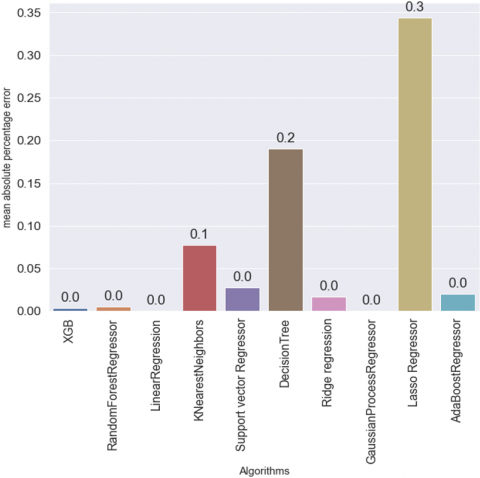
Figure 4 depicts the mean squared error of all the algorithms. In terms of MSE, all the algorithms got a perfect error value of 0.0 except KNN, Decision Tree, and Lasso Regressor. Figure 5 depicts the root mean squared error of all the algorithms. In terms of RMSE Linear regression was 0.0, Gaussian Process regression was 0.1, XGB was 0.06, Random Forest was 0.07, Ridge regressor was 0.13, AdaBoost was 0.18, SVM was 0.26, KNN was 0.66, Decision Tree was 1.45 and LassoRegressor was 2.62. Figure 6 depicts the mean absolute error of all the algorithms. Linear Regressor and Gaussian Process regressor produce an MAE of 0.0, XGB, and Random Forest exhibit 0.2 MAE. Ridge Regression and AdaBoost an MAE of 0.11 and 0.12, support vector machine as 0.15, and KNN as 0.47. The decision Tree and Lasso Regressor however produce high means absolute error of 1.17 and 2.18 respectively. Figure 7 depicts the mean absolute percentage error of all the algorithms. In terms of MAPE linear regression, XGBoost, and Gaussian process regressor produce 0.0 values, Random Forest as 0.01, ridge processor as 0.02, SVM as 0.03, KNN as 0.08, Decision tree as 0.19 and Lasso as 0.34. Figure 8 pictorially represents the R2 and adjusted R2 value of all the ten machine learning regressors used in this study and it can be seen that Linear regressors, Ridge Regressor, Random forest regressor, and XGBoostRegressor achieved a value of 1 for R2 and adjusted R2. Adaboostregressor attained the value of R2=1 and adjusted R2=0.99 which is also nearly perfect. The support vector regressor got a value of 0.99 for both R2 and adjusted R2.KNN got 0.94 and 0.93 for the R2 and adjusted R2 respectively. The decision tree got 0.69 and 0.68 for the R2 and adjusted R2 respectively. Lasso Regressors however got a 0 R2 and -0.04 adjusted R2 respectively. It is evident that all the algorithms performed well in this study but the decision tree and lasso regressors. RMSE is higher than MSE for some algorithms like XGB, Random Forest, KNN, SVR, Ridge Regression, and Adaboost because of their tendency to produce larger errors due to overfitting, noise sensitivity, or regularization bias. MSE, being less sensitive to large errors and outliers, often provides a more stable and conservative measure of model performance. With some exceptions like decision tree decision trees, which tend to make a few large errors rather than many small ones. In these cases, RMSE can be a better metric to use because it gives less weight to these large errors.MAE was higher than MAPE across all the algorithms because MAE is more sensitive to errors for small values, while MAPE is more sensitive to errors for large values. This is why the MAE is higher than the MAPE in this case.
Figure 4. Mean square error
Figure 5. Root mean square error
Figure 6. Mean absolute error
Figure 7. Mean absolute percentage error
Figure 8. R square and adjusted R square
Predicting HbA1c at an early stage is crucial for diabetes management. The current study developed a unique method for predicting HbA1c values using a diabetes dataset with the help of regression algorithms. It not only predicts the values of glycated hemoglobin but also analyzes the performance of various regression algorithms on different performance metrics. It was found that linear Regression performs perfectly well and achieved zero MSE, RMSE, MAE, MAPE, and a perfect 1.00 value of R2 and Adjusted R2. The other algorithms that performed nearly perfectly were Gaussian Process Regressor, Xtreme gradient boosting, and Random Forest. However, the LASSO regressor’s performance was extremely bad in every aspect. It was also found that the MSE achieved by most of the algorithms was better than RMSE. Similarly, MAPE achieved by most of the algorithms was better than MAE. This framework could be used as a prognosis test of HbA1c before the actual test. The proposed method can be further developed by adding other important features and datasets of different diseases that might help for better and early predictions of diseases.
[1] Peker, M., Şaşar, A., Özkaraca, O., Akcay, G. (2017). Estimation of HbA1c value using artificial neural networks. Global Journal of Computer Sciences: Theory and Research, 7(1): 1-7. https://doi.org/10.18844/gjcs.v7i1.2691
[2] Tao, X., Jiang, M., Liu, Y., Hu, Q., Zhu, B.Q., Hu, J.Q., Guo, W.M., Wu, X.W., Xiong, Y., Shi, X., Zhang, X.L., Han, X., Li, W.Y., Tong, R.S., Long, E. (2023). Predicting three-month fasting blood glucose and glycated hemoglobin changes in patients with type 2 diabetes mellitus based on multiple machine learning algorithms. Scientific Reports, 13(1): 16437. https://doi.org/10.1038/s41598-023-43240-5
[3] Alhassan, Z., Budgen, D., Alessa, A., Alshammari, R., Daghstani, T., Al Moubayed, N. (2019). Collaborative denoising autoencoder for high glycated haemoglobin prediction. In 28th International Conference on Artificial Neural Networks, Munich, Germany, pp. 338-350. https://doi.org/10.1007/978-3-030-30493-5_34
[4] Nagaraj, S.B., Sidorenkov, G., van Boven, J.F., Denig, P. (2019). Predicting shortand long term glycated haemoglobin response after insulin initiation in patients with type 2 diabetes mellitus using machine-learning algorithms. Diabetes, Obesity and Metabolism, 21(12): 2704-2711. https://doi.org/10.1111/dom.13860
[5] Islam, M.S., Qaraqe, M.K., Belhaouari, S., Petrovski, G. (2021). Long term HbA1c prediction using multi-stage CGM data analysis. IEEE Sensors Journal, 21(13): 15237-15247. https://doi.org/10.1109/JSEN.2021.3073974
[6] Gregg, E.W., Sattar, N., Ali, M.K. (2016). The changing face of diabetes complications. The Lancet Diabetes & Endocrinology, 4(6): 537-547. https://doi.org/10.1016/s2213-8587(16)30010-9
[7] Yang, C.C. (2022). Explainable artificial intelligence for predictive modeling in healthcare. Journal of Healthcare Informatics Research, 6(2): 228-239. https://doi.org/10.1007/s41666-022-00114-1
[8] Lu, H., Uddin, S., Hajati, F., Ali, M., Matloob, M. (2021). A patient network-based machine learning model for disease prediction: The case of type 2 diabetes mellitus. Applied Intelligence, 52(3): 2411-2422. https://doi.org/10.1007/s10489-021-02533-w
[9] Ahmed, U., Issa, G.F., Khan, M.A., et al. (2022). Prediction of diabetes empowered with fused machine learning. IEEE Access, 10: 8529-8538. https://doi.org/10.1109/ACCESS.2022.3142097
[10] Alam, T.M., Iqbal, M.A., Ali, Y., et al. (2019). A model for early prediction of diabetes. Informatics in Medicine Unlocked, 16: 100204. https://doi.org/10.1016/j.imu.2019.100204
[11] Maniruzzaman, M., Rahman, M.J., Ahammed, B., Abedin, M.M. (2020). Classification and prediction of diabetes disease using machine learning paradigm. Health Information Science and Systems, 8: 7. https://doi.org/10.1007/s13755-019-0095-z
[12] Srivastava, S., Sharma, L., Sharma, V., Kumar, A., Darbari, H. (2019). Prediction of diabetes using artificial neural network approach. In Engineering Vibration, Communication and Information Processing: ICoEVCI 2018, India, pp. 679-687. https://doi.org/10.1007/978-981-13-1642-5_59
[13] Sarwar, M. A., Kamal, N., Hamid, W., Shah, M.A. (2018). Prediction of diabetes using machine learning algorithms in healthcare. In 2018 24th International Conference on Automation and Computing (ICAC), Newcastle Upon Tyne, UK, pp. 1-6. https://doi.org/10.23919/IConAC.2018.8748992
[14] Joshi, R.D., Dhakal, C.K. (2021). Predicting type 2 diabetes using logistic regression and machine learning approaches. International Journal of Environmental Research and Public Health, 18(14): 7346. https://doi.org/10.3390/ijerph18147346
[15] Ahmad, H.F., Mukhtar, H., Alaqail, H., Seliaman, M., Alhumam, A. (2021). Investigating health-related features and their impact on the prediction of diabetes using machine learning. Applied Sciences, 11(3): 1173. https://doi.org/10.3390/app11031173
[16] Dinh, A., Miertschin, S., Young, A., Mohanty, S.D. (2019). A data-driven approach to predicting diabetes and cardiovascular disease with machine learning. BMC Medical Informatics and Decision Making, 19(1): 211. https://doi.org/10.1186/s12911-019-0918-5
[17] Zou, Q., Qu, K., Luo, Y., Yin, D., Ju, Y., Tang, H. (2018). Predicting diabetes mellitus with machine learning techniques. Frontiers in Genetics, 9: 515. https://doi.org/10.3389/fgene.2018.00515
[18] Ismail, L., Materwala, H., Tayefi, M., Ngo, P., Karduck, A. P. (2022). Type 2 diabetes with artificial intelligence machine learning: Methods and evaluation. Archives of Computational Methods in Engineering, 29(1): 313-333. https://doi.org/10.1007/s11831-021-09582-x
[19] Barik, S., Mohanty, S., Mohanty, S., Singh, D. (2021). Analysis of prediction accuracy of diabetes using classifier and hybrid machine learning techniques. Smart Innovation, Systems and Technologies, 153: 399-409. https://doi.org/10.1007/978-981-15-6202-0_41
[20] Yuvaraj, N., SriPreethaa, K.R. (2019). Diabetes prediction in healthcare systems using machine learning algorithms on Hadoop cluster. Cluster Computing, 22: 1-9. https://doi.org/10.1007/s10586-017-1532-x
[21] Indoria, P., Rathore, Y.K. (2018). A survey: Detection and prediction of diabetes using machine learning techniques. International Journal of Engineering Research & Technology, 7(3): 287-291.
[22] Saru, S., Subashree, S. (2019). Analysis and prediction of diabetes using machine learning. International Journal of Emerging Technology and Innovative Engineering, 5(4): 167-175.
[23] Mujumdar, A., Vaidehi, V. (2019). Diabetes prediction using machine learning algorithms. Procedia Computer Science, 165: 292-299. https://doi.org/10.1016/j.procs.2020.01.047
[24] Mushtaq, Z., Ramzan, M.F., Ali, S., Baseer, S., Samad, A., Husnain, M. (2022). Voting classification-based diabetes mellitus prediction using hypertuned machine-learning techniques. Mobile Information Systems, 2022: 6521532. https://doi.org/10.1155/2022/6521532
[25] Chang, V., Bailey, J., Xu, Q.A., Sun, Z. (2023). Pima Indians diabetes mellitus classification based on machine learning (ML) algorithms. Neural Computing and Applications, 35(22): 16157-16173. https://doi.org/10.1007/s00521-022-07049-z
[26] Shin, J., Lee, J., Ko, T., Lee, K., Choi, Y., Kim, H.S. (2022). Improving machine learning diabetes prediction models for the utmost clinical effectiveness. Journal of Personalized Medicine, 12(11): 1899. https://doi.org/10.3390/jpm12111899
[27] Khanam, J.J., Foo, S.Y. (2021). A comparison of machine learning algorithms for diabetes prediction. ICT Express, 7(4): 432-439. https://doi.org/10.1016/j.icte.2021.02.004
[28] Yu, W., Liu, T., Valdez, R., Gwinn, M., Khoury, M.J. (2010). Application of support vector machine modeling for prediction of common diseases: The case of diabetes and pre-diabetes. BMC medical informatics and decision making, 10(1): 16. https://doi.org/10.1186/1472-6947-10-16
[29] Suplotova, L.A., Sudnitsyna, A.S., Romanova, N.V., Shestakova, M.V. (2021). Time in range is a tool for assessing the quality of glycemic control in diabetes. Diabetes Mellitus, 24(3): 282-290. https://doi.org/10.14341/DM12703
[30] Lin, C.S., Lee, Y.T., Fang, W.H., Lou, Y.S., Kuo, F.C., Lee, C.C., Lin, C. (2021). Deep learning algorithm for management of diabetes mellitus via electrocardiogram-based glycated hemoglobin (ECG-HbA1c): A retrospective cohort study. Journal of Personalized Medicine, 11(8): 725. https://doi.org/10.3390/jpm11080725
[31] Lin, L., Wang, A., Jia, X., Wang, H., He, Y., Mu, Y., Dou, J. (2023). High hemoglobin glycation index is associated with increased risk of diabetes: A population-based cohort study in China. Frontiers in Endocrinology, 14: 1081520. https://doi.org/10.3389/fendo.2023.1081520