Alibek Barlybayev*![]() | Arman Sankibayev
| Arman Sankibayev![]() | Yenglik Kadyr
| Yenglik Kadyr![]() | Nurzada Amangeldy
| Nurzada Amangeldy![]() | Talgat Sabyrov
| Talgat Sabyrov![]()
© 2023 IIETA. This article is published by IIETA and is licensed under the CC BY 4.0 license (http://creativecommons.org/licenses/by/4.0/).
OPEN ACCESS
The burgeoning trade in used vehicles has necessitated further research into price prediction. In developing nations, the abundance of second-hand cars and limited supply of new ones has led to a preference for used vehicles. Consequently, the analysis of vendor data becomes imperative for gaining valuable insights. Sellers are increasingly seeking accurate price predictions to maximize their profits. The assessment of used car prices necessitates a thorough understanding of the features that influence value. Although the inclusion of multiple features can enhance prediction accuracy, the list of these features is non-exhaustive. This study seeks to examine the effectiveness of various regression techniques such as Linear, Decision Tree, SVM machines, Neural Network, and Bagged Trees, alongside machine learning algorithms, in predicting the selling price of used cars based on the associated features. Evaluation metrics will be utilized to identify the most proficient model by examining the performance and error rate of each model. The deep neural network model demonstrates exceptional performance, as indicated by its low RMSE and MSE values, suggesting high efficiency. Some models, including cubic SVM, fine Gaussian SVM, and wide neural network, exhibit a robust correlation (R) in accurately connecting input and output variables. Furthermore, narrow, medium, bilayered, and trilayered neural networks display commendable performance in recording variable correlations. After comparing various models, Bagged Trees were identified as the most cost-effective option per square meter, due to their advantageous pricing and performance.
Kazakhstan car market, used car price prediction, linear regression, decision tree regression, SVM, neural network, bagged trees
The challenge of identifying a pre-owned vehicle that fits within a specified budget is primarily due to the multiple factors that determine its price, including the model year, mileage, condition, and equipment. Consequently, customers often turn to experienced professionals for assistance in identifying an ideal vehicle appropriate for their budget. The significance of accurate price prediction and classification in the used vehicle market has been explored [1], underlining how accurate pricing is vital for both buyers and sellers in ensuring fair transactions and reducing information asymmetry. In tandem with this, effective classification aids buyers in making informed decisions tailored to their preferences and requirements [1].
In the study of Arora et al. [2], the efficacy of machine learning models in predicting car resale values was evaluated. A comprehensive dataset, encapsulating various car-related attributes such as make, model, year of manufacture, mileage, condition, location, among others, was collected and preprocessed. Machine learning algorithms, including linear regression, decision trees, random forests, and support vector regression, were then applied to train predictive models using this dataset [2].
In another study conducted in Morocco [3], a similar methodology was adopted, with a dataset consisting of various features related to used cars collected for the prediction of used car prices using machine learning techniques. Contrary to the traditional linear regression models, a novel S-curve model was proposed for the estimation of used car prices [4].
The complexity of rule-based algorithms often impedes a customer's ability to predict cost accurately, even when they have a clear understanding of what they intend to purchase. Inductive-based learning serves as an effective strategy in this regard, providing insights into cost derived from the dataset [5]. In a novel approach, a back propagation neural network model based on mean encoding was utilized for predicting used car prices, resulting in improved prediction accuracy [5].
Further exploration of machine learning regression models with ensemble techniques for predicting resale car prices was conducted [6]. A multi-layer perceptron (MLP), a type of feedforward neural network architecture typically used for regression tasks, was employed [7]. To minimize the difference between predicted and actual prices, the MLP was trained using backpropagation [7]. In a comparative study, the Light Gradient Boosting Machine (LightGBM) was found to outperform random forest in terms of prediction accuracy [8].
The suitability of machine learning approaches for this specific use case has been amply demonstrated. A comprehensive study on the application of machine learning techniques for predicting and classifying vehicle prices revealed the effectiveness of the proposed approach in accurately predicting prices for sedans, SUVs, and trucks [9].
Various machine learning algorithms and techniques were explored, highlighting their strengths and limitations [10]. It was also demonstrated that ensemble methods, such as random forests, often outperform individual algorithms in predicting vehicle prices [11]. After collecting and preprocessing a dataset of car features, experimenting with different regression models, applying feature selection techniques, and evaluating performance using appropriate metrics, the effectiveness of machine learning in predicting car prices was established, indicating potential benefits for the automotive industry [12].
In the present research, this problem is addressed, introducing a machine learning approach to predict the price of pre-owned cars in Kazakhstan. This paper aims to facilitate prospective buyers in making informed decisions when purchasing a used car by providing them with necessary information. A step-by-step model is offered, ensuring they secure the best vehicle possible.
The concept of regression, a cornerstone in statistical modelling, entails estimating the relationship between a dependent variable and multiple independent variables. Anil Kumar [13] delineated several prevalent techniques, including linear regression, decision trees, random forests, support vector machines, and neural networks. Each algorithm's strengths and limitations are expounded upon, accentuating their aptness for predicting car prices based on varying data types.
In the study of Amik et al. [14], a dataset encompassing various features of pre-owned cars in Bangladesh was compiled, including brand, model, year of manufacture, mileage, condition, and location. Subsequently, an array of machine learning algorithms, such as linear regression, decision trees, random forests, support vector machines (SVM), and artificial neural networks (ANN), were employed to train models for predicting car prices. Highlighting the influence of different inputs on the output, regression analysis emerges as a potent tool for forecasting and prediction, with the target variable representing the prediction goal and the independent features shaping its value.
Further analysis was conducted to investigate the various factors implicated in the pricing of used cars, including age, mileage, brand, model, condition, and market demand [15]. Correlation analysis and regression models were employed as statistical techniques to ascertain these variables. In the final step of price prediction, a machine learning model predicated on support vector regression (SVR) was developed to predict used car prices.
In a novel approach, Bayesian Additive Regression Trees (BART) were introduced to account for heteroscedasticity, a scenario wherein the variability of the response variable differs across different levels of the predictor variables [16]. A study focused on car sales prediction applied linear regression, decision tree regression, random forest regression, support vector regression (SVR), and artificial neural networks (ANN) [17].
The selection of regression methods is contingent upon the type of data and the desired outcome. The shape of the data, in tandem with the most compatible technique, influences the outcome of the model.
Machine Learning, an essential research branch, encompasses the process of enabling computers to learn and evolve through data and algorithms [18]. This technology is widely employed within the realm of Artificial Intelligence. Machine Learning algorithms facilitate the creation of models based on training data, enabling predictions and decisions without the necessity for explicit instructions.
Three main types of machine learning have been identified: supervised, unsupervised, and reinforcement learning. Supervised learning necessitates labeled data and primarily aims to link input features with output labels. Conversely, unsupervised learning leverages unlabeled data with the objective of unveiling hidden patterns within the data. Reinforcement learning, a process reliant on trial and error, interacts with the environment whereby positive feedback and rewards are granted when the agent progresses towards its goal, and negative feedback is utilized for improvement. Various use cases are associated with these learning types: Regression and Classification for Supervised learning, Clustering for Unsupervised learning, and game playing and Hidden Markov Models for Reinforcement Learning [19]. This research paper delves into the exploration of supervised machine learning technique, Regression.
Predictive modelling and machine learning are integral components of analytics, reviewing historical and current data to forecast future occurrences. Predictive models can discern trends within data, thereby facilitating the identification of potential risks or opportunities. The significance of Predictive Analytics is underscored across numerous industries, including retail, banking, healthcare, IT, entertainment, and social media, with its application expanding in sports and the Internet of Things (IoT) [9].
The application of AI technology spans various business facets such as customer targeting, sales forecasting, inventory control, market analysis, risk assessment, feedback gathering, and future planning. This contributes to enhanced decision-making with increased accuracy and efficiency. This research paper presents the development of a car price prediction model, proposed as a fair pricing system, with potential implications on the automotive retail sector. Prediction models can exert considerable influence on businesses by accurately forecasting the future and assisting in strategic planning.
The valuation of pre-owned vehicles in the market presents a challenge due to the vast fluctuation in prices, thereby complicating the process for both potential buyers and sellers in establishing a fair price [20]. Therefore, there is a pressing need for an intelligent system capable of accurately predicting prices and ensuring that the valuation of each vehicle is aligned with its classification. The effectiveness of such a car evaluation system is contingent upon the collection and availability of pertinent data. Such data includes the vehicle's year of production, motor type, condition, mileage, horsepower, number of doors, and weight, all of which are crucial to the comprehensive evaluation of a car [21].
However, the cost of a product is contingent on its offered features, which may not always be readily accessible, thereby complicating cost determination. This study, focused on the Kazakh market, sources its information from the reputable used car dealer, “kolesa.kz”. In order to enable the data mining model to process the raw data, it is required to undergo pre-processing and transformation into an acceptable format. Vital attributes contained within the raw data include the manufacturer, model, year of manufacture, kilometers traveled, and selling price. An initial statistical analysis of the data was undertaken to ascertain which parameters were most strongly correlated [22].
The extraction and selection of key features were facilitated by a correlation matrix, allowing for the identification and retention of the most relevant features, including vehicle price, kilometers driven, year of production, and the classification label for the car manufacturer.
The objective of this research is to scrutinize the efficacy of an array of regression methods, inclusive of Linear Regression, Decision Tree Regression, Random Forest Regression, Support Vector Machines, Neural Network, and Bagged Trees, in conjunction with machine learning algorithms. The aim of the study is to predict the resale price of used cars using pertinent features such as price, car, manufacturer, year, location, generation, body, engine volume, fuel type, mileage, transmission, and others.
Data was sourced from vendor websites and subjected to data mining methods to investigate the various factors contributing to the price estimation of a used car. The initial dataset comprises 178,397 data points with 16 attributes, including 101 car brands, 18 types of car body, and 304 car locations in settlements throughout Kazakhstan. This enables customers to accurately assess the value of their current car or the one they intend to purchase.
The intention of this investigation is to provide a robust analysis of the current market for used vehicles in Kazakhstan, with the objective of developing a predictive model that can serve as a reliable tool for customers and dealers alike. The model is anticipated to help in the accurate estimation of used car prices and thus aid in making informed decisions. The expectation is that this work will contribute to the literature by providing a comprehensive and detailed study of various factors affecting used car prices in Kazakhstan.
We collected the dataset by scraping https://kolesa.kz/ (accessed March 13, 2023), which is a prominent online marketplace in Kazakhstan. We chose this platform because it was one of the first platforms in Kazakhstan for buying and selling used cars and had the largest and most comprehensive set of relevant data during the data collection phase. The data was collected using web scraping. The automated process of collecting data from a website using bots was implemented in Python [23]. This Python script appears to be a web scraping tool designed to extract information about cars listed on the “kolesa.kz” website, particularly those with specific criteria such as a minimum price and the presence of photos. The script uses the requests library to make HTTP requests to web pages and the BeautifulSoup library to parse HTML content. Here's a breakdown of what the script does:
(1) The script imports necessary libraries: “requests” for making HTTP requests, “BeautifulSoup” for parsing HTML content, time for adding delays, and “disable_warnings” from “urllib3” to suppress insecure request warnings.
(2) The “headers” variable is set to mimic a common User-Agent string.
(3) A dictionary named “map” is initialized to store information about the scraped car listings.
(4) An “id” variable starts at 1, likely indicating the identification number of the scraped car entries.
(5) The URL is set to the base URL of the car listings website, and parameters like “_sys-hasphoto”, “price[from]”, and “sort_by” are included.
(6) A loop runs for each page up to “max_pages”. Within this loop:
A. The current page URL is constructed based on the page number (“p”) and added to the base URL.
B. An HTTP GET request is made to the current URL, and the response is parsed using BeautifulSoup.
C. Car ads on the page are identified by their HTML structure, and their details are extracted.
D. Each car's URL is accessed, and its details are extracted from the linked page using similar techniques.
E. Extracted information includes car title, price, mortgage status, various specifications (e.g., year, location, body type, engine volume, fuel type, mileage, transmission, etc.), and more.
F. Extracted data is stored in the “map” dictionary under unique IDs.
G. A delay of 2 seconds is added to prevent aggressive scraping.
(7) After scraping each page, the script writes the collected data to a text file named “idX.txt”, where “X” corresponds to the page number.
For ethical reasons and to maintain the terms of use of the website, we have written a letter for permission to conduct web scraping. We also provided them with the results of the study. The administrators have told us that there will be no legal or ethical repercussions.
The original dataset contains 178397 instances and 16 features. The following features were collected for each ad: price, car, manufacturer, year, urlid, location, generation, body, engine_volume, fuel_type, mileage, transmission, drive_unit, steering_wheel, color, cleared_in_KZ. All features are shown in Table 1. The collected dataset may not always be in a format suitable for machine learning algorithms. To ensure the efficient use of machine learning algorithms, the data pre-processing step is critical. After analyzing our initial dataset, we identified several issues that needed to be addressed. For example, we removed faulty cars from the dataset. We also removed cars with incorrect engine sizes from the dataset. For further research, some features must be described in a numerical value, the numerical data are described in Table 2. A method for assigning categorical variables to numeric ones is by identification numbers. We also removed the features “generation”, “urlid”, “car”, since these representations in a numerical value do not give any significance. “Generation” feature is not as important as the “year” feature, the presence of this feature in the dataset would lead to blurring of data points. “Urlid” is just a link to the ad, so this feature has no coherent value in the dataset. “Car” feature of a car often bears the title of ad, the car is determined by the features of “manufacturer” and “year”.
Description of the data set and descriptive statistics is given in Table 3. The summary statistics include measures of central tendency (average, median, and mode), measures of variability (standard deviation, sample variance, and standard error), measures of skewness (excess and skewness), and measures of range (interval, minimum, and maximum). The average used car price is 8762975, median 5590000, mode 6500000, deviation from mode 35%. This suggests that used cars will become cheaper in the automotive market. On average, the market is dominated by Kia brand cars, manufacturer=54. But the mode of the column manufacturer indicates 93, this indicates that Toyota cars will most often appear on the Kazakhstan market. The average value of the car production year column is 2008, while the mode shows 2022. The market is dominated by sedans, front-wheel drive, petrol engines and this trend will not change in future.
Table 1. Variables present in the initial data set
|
Variable |
Type |
Description |
Example |
|
price |
numeric |
price |
3500000 |
|
car |
character |
machine model name |
Audi Q8 |
|
manufacturer |
factor |
name of automotive manufacturer |
Toyota |
|
year |
numeric |
production year |
2019 |
|
urlid |
character |
identifier of the link to the ads on the site kolesa.kz |
/a/show/149132211 |
|
location |
factor |
car location |
Astana |
|
generation |
character |
car model generation |
2000 - 2006 1st generation (YD1) |
|
body |
factor |
body style |
sedan |
|
engine_volume |
numeric |
engine volume |
2.8 |
|
fuel_type |
factor |
fuel type |
petrol |
|
mileage |
numeric |
mileage |
47000 |
|
transmission |
factor |
transmission |
automatic |
|
drive_unit |
factor |
drive unit |
front-wheel drive |
|
steering_wheel |
factor |
steering wheel position |
left |
|
color |
factor |
color |
metallic |
|
cleared_in_KZ |
factor |
is there a state registration in Kazakhstan |
yes |
Table 2. Variables present in numeric data set
|
Variable |
List Item |
Representation in Numerical Value |
|
body |
microvan |
1 |
|
minivan |
2 |
|
|
minibus |
3 |
|
|
hatchback |
4 |
|
|
station wagon |
5 |
|
|
liftback |
6 |
|
|
sedan |
7 |
|
|
van |
8 |
|
|
pickup |
9 |
|
|
crossover |
10 |
|
|
SUV |
11 |
|
|
targa |
12 |
|
|
coupe |
13 |
|
|
cabriolet |
14 |
|
|
limousine |
15 |
|
|
fastback |
16 |
|
|
hardtop |
17 |
|
|
roadster |
18 |
|
|
fuel_type |
diesel |
1 |
|
gas |
2 |
|
|
gas-gasoline |
3 |
|
|
hybrid |
4 |
|
|
petrol |
5 |
|
|
transmission |
mechanics |
1 |
|
variator |
2 |
|
|
automatic transmission |
3 |
|
|
tiptronic |
4 |
|
|
robotic transmission |
5 |
|
|
steering_wheel |
right |
1 |
|
left |
2 |
|
|
drive_unit |
rear drive |
1 |
|
front-wheel drive |
2 |
|
|
four-wheel drive |
3 |
|
|
cleared_in_KZ |
no |
1 |
|
yes |
2 |
Table 3. Descriptive statistics of data set characteristics
|
Value/ Criteria |
Price |
Manu-Facturer |
Year |
Body |
Fuel Type |
|
Average |
8762975 |
54.75 |
2008 |
7.408 |
4.742 |
|
Standard Error |
27634.43 |
0.077 |
0.024 |
0.0055 |
0.002 |
|
Median |
5590000 |
58 |
2009 |
7 |
5 |
|
Mode |
6500000 |
93 |
2022 |
7 |
5 |
|
Standard Deviation |
11671973 |
32.71 |
10.2 |
2.364 |
0.901871 |
|
Sample Variance |
1.36E+14 |
1070.5 |
104.63 |
5.589 |
0.813371 |
|
Excess |
39.66968 |
-1.3572 |
-0.78 |
-0.108 |
11.02679 |
|
Skewness |
4.87994 |
-0.274 |
-0.35 |
-0.197 |
-3.50827 |
|
Interval |
1.93E+08 |
100 |
72 |
17 |
4 |
|
Minimum |
10000 |
1 |
1951 |
1 |
1 |
|
Maximum |
1.93E+08 |
101 |
2023 |
18 |
5 |
|
Sum |
1.56E+12 |
9767319 |
3.6E+08 |
1321593 |
846011 |
|
Observations |
178397 |
178397 |
178397 |
178397 |
178397 |
|
Reliability rate (95.0%) |
54162.85 |
0.1518 |
0.047 |
0.0109 |
0.004185 |
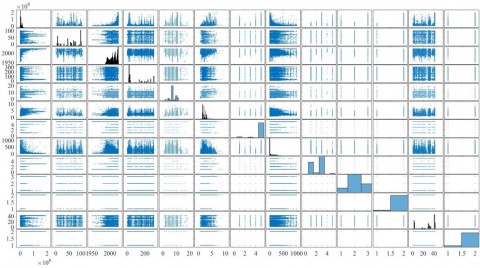
Exploratory data analysis is an important part of any data science project. During this phase, we use different statistical methods like mean, standard deviation and distribution to gain insights about the characteristics of our data features., and visualization charts like bar charts, histograms, scatter plots, etc. For example, the pair plot in Figure 1 shows that manufacturer, mileage, production year are linearly related to the prices of the car. As we initially assumed, the results showed that the price is very strongly correlated with the brand name of the auto manufacturer, with the mileage, and the year of production. To build pair plots, we will use Matlab, which has a very user-friendly interface [24].
Figure 1. Pair plot between numerical features and the price
Figure 2. Features vs importance
Feature Importance is a key part of any machine learning process, as it has the ability to directly influence model performance. By removing attributes that are not relevant or only partially relevant, you can avoid overfitting of your algorithm and reduce the amount of time needed for training. Furthermore, Feature Importance can also help improve the overall performance of your model. Feature Importance is an effective technique that assigns a numerical score to each of the fields in your dataset. It helps you identify which variables are most influential and important when it comes to predicting the target outcome. The higher the score, the more relevant or essential that feature becomes. In this document, we will employ the feature importance attribute of a model and its corresponding correlation matrix to identify the most pertinent features of the dataset as seen in Figures 2 and 3. Estimating the price of a second-hand car is quite challenging. Not all features are equally important; some may make a huge difference, while others may not be relevant at all. Determining the right ones can prove to be crucial for acquiring accurate qualifications. It is essential to focus on the significant features for effective results. To see how those remaining features are connected, creating a heatmap (illustrated in Figure 3) will be beneficial. We can observe that the fields like transmission type of car, fuel type of car, brand name of car, kilometers driven value and age of car are having impact on predicting the price of used car. We can observe that the fields like age of car, engine volume, transmission type of car, body, drive unit are having strong positive impact on predicting the price of used car. The manufacturer's brand has a weak positive correlation with price. The region where the car is located and the mileage of the car has a weak negative correlation with the price.
Figures 4 and 5 show box plots of the vehicle prices and kilometers traveled based on the manufacturers. The list of manufacturers is determined by sorting in an ascending order, beginning with the highest value:
By price: BMW, Lamborghini, Land Rover, Mercedes-Benz, Porsche, Rolls-Royce, Toyota.
By kilometers traveled: AvtoVAZ, Mercedes-Benz, Opel, Toyota.
Analyzing the amount of cars and the cost, manufactures anticipate data based on this information. Avtovaz and Opel are particularly popular among motorists due to their competitive prices and long service life – even outperforming vehicles from higher price classes such as Mercedes-Benz and Toyota.
Figure 6 shows the plots of the features called by the plotmatrix function. Analyzing the graphs, we can say that the most expensive car brands are Rolls-Royce, Lamborghini, Mercedes-Benz, Bentley, Land Rover, Porsche, McLaren. Toyota, Ferrari, BMW, Ford, Lexus, Audi, Aston, Cadillac, Dodge. The newer the car, the more expensive it is. The most expensive cities to buy a car are Almaty, Astana, Atyrau, Kostanay, Kyzylorda, Taraz, Ust-Kamenogorsk, Shymkent. The most profitable for buying are Aktau, Zhanaozen, Zhezkazgan, Kokshetau, Taldykorgan, Turkestan, Ekibastuz. The most expensive are cars with a body like a sedan, crossover, SUV. The cheapest are cars with a body like microvan, targa, fastback, hardtop. The larger the engine volume, the more expensive the car. Gasoline, hybrid and diesel vehicles are more expensive than LPG or LPG vehicles. The lower the mileage, the more expensive the cars are. Cars with automatic transmission and robot are much more expensive. Drive units with rear-wheel drive and all-wheel drive are more expensive. Left hand drive cars are more expensive. By color, the most expensive shades are black, black metallic. Slightly more expensive are cars with white metallic, green metallic, silver, silver metallic, gray, gray metallic. For repurchase, you can buy cars with the color pink, purple, lilac, blue, yellow, cherry, turquoise. Cars with these colors are much cheaper. For further resale, you can repaint the car in black or black metallic. State registration in Kazakhstan does not greatly affect the cost of the car.
Figure 3. Correlation matrix
Figure 4. Box plot of the vehicle price according to the manufacturer
Figure 5. Box plot of kilometers traveled by manufacturer
Figure 6. Plotmatrix
After reviewing research papers on used car markets in other countries, we selected 20 machine learning models (Table 4). In order to evaluate which of the 20 regressors was the most effective, we tested them using 3 distinct performance metrics. The dataset was used to train the regressors and assess their success according to a variety of criteria. They are: Root Mean Squared Error, R-Squared, Mean Squared Error and Mean Absolute Error [25, 26]. Accurate estimation of a model's predictive accuracy is a pivotal concern in machine learning and data analysis. This paper introduces a comprehensive approach to predictive accuracy estimation using 5-fold cross-validation. The method, with its inherent division of the dataset into five disjoint folds, facilitates meticulous model training, validation, and performance assessment. For each validation fold, a model is trained on the remaining folds and evaluated on the validation data [27]. The average validation error across all folds provides a reliable indicator of the model's generalization capabilities. The models include linear regression [28] with and without interactions, robust linear regression, stepwise linear regression, decision tree-based models (fine, medium, and coarse trees, boosted trees, and bagged trees), support vector machine (SVM) models with linear, quadratic, and cubic kernels, and Gaussian SVM models with fine, medium, and coarse kernels. The table also includes neural network models with different architectures, such as narrow, medium, wide, bilayered, and trilayered neural networks. The performance metrics provide an indication of how well each model is able to predict the target variable. Lower values of RMSE, MSE, and MAE indicate better model performance, while a higher value of R indicates a stronger correlation between predicted and actual values. The performance metrics in the table show that decision tree-based models (fine, medium, and coarse trees, boosted trees, and bagged trees) have the lowest RMSE and MSE values, meaning they are more successful in predicting the target variable than other models. The deep neural network model has remarkable low RMSE and MSE values, suggesting outstanding efficiency. The table also shows that some models, such as the cubic SVM, fine Gaussian SVM, and wide neural network, have relatively high correlation coefficients (R), indicating that these models are able to capture the underlying relationship between the predictor and target variables better than other models. The R values for the narrow, medium, bilayered and trilayered neural network models display a good performance in recording the correlations between different variables. The table provides performance metrics that can be used to evaluate the various models and identify which one is the most suitable for your task. This comparison can be done easily and quickly. Nonetheless, it is essential to understand that the performance of any AI model can differ based on the dataset and task. Thus, it is imperative to assess various models and pick the one that works best for your data. After considering different models, Bagged Trees emerged as the best results with parameters RMSE=2.9537, R=0.94, MSE=8.7244, MAE=1.1386, shown in Figure 7. Of course, it was possible to analyze the collected dataset with recurrent neural networks, LSTMs, or convolutional neural networks. But since market analysis is an economic task and is not related to NLP, pattern recognition, time series, the choice of these 20 models is due to the simplicity of the data in the dataset.
The Analysis of Variance (ANOVA) analysis results provide insights into the variability in the data and whether there are meaningful differences among the evaluated metrics in different groups. Table 5 provides a summary of key descriptive statistics for various evaluation metrics across different groups. The metrics include RMSE, R-value, MSE, and MAE. For each metric, the table presents the count of data points, the sum of metric values, the average value, and the variance within the dataset.
Table 6 presents the results of ANOVA analysis. ANOVA is used to assess the variance between and within groups to determine if there are significant differences among means. The table includes the sources of variation (Between Groups and Within Groups), their corresponding sums of squares (SS), degrees of freedom (df), mean squares (MS), F-statistic (F), p-value, and critical F-value (F crit). The p-value for the Between Groups analysis suggests a highly significant difference in means, indicated by the very low p-value (2.46E-15), implying rejection of the null hypothesis that group means are equal. The F crit value helps determine whether the calculated F-statistic is statistically significant.
Table 4. Regression models in determining the value of car
|
Model/Parameters |
RMSE |
R |
MSE |
MAE |
|
Linear (Terms: Linear; Robust option: Off) |
8.3884 |
0.48 |
70.366 |
4.2293 |
|
Interactions Linear (Terms: Interactions; Robust option: Off) |
6.8209 |
0.66 |
46.525 |
3.1316 |
|
Robust Linear (Terms: Linear; Robust option: On) |
9.1379 |
0.39 |
83.501 |
3.6664 |
|
Stepwise Linear (Initial terms: Linear; Upper bound on terms: Interactions; Maximum number of steps: 1000) |
6.8212 |
0.66 |
46.529 |
3.1316 |
|
Fine Tree (Minimum leaf size: 4; Surrogate decision splits: Off) |
2.9824 |
0.93 |
8.8948 |
1.115 |
|
Medium Tree (Minimum leaf size: 12; Surrogate decision splits: Off) |
3.1603 |
0.93 |
9.9877 |
1.1947 |
|
Coarse Tree (Minimum leaf size: 36; Surrogate decision splits: Off) |
3.4905 |
0.91 |
12.184 |
1.3307 |
|
Boosted Trees (Minimum leaf size: 8; Number of learners: 30; Learning rate: 0.1) |
4.5711 |
0.85 |
20.895 |
2.034 |
|
Bagged Trees (Minimum leaf size: 8; Number of learners: 30) |
2.9537 |
0.94 |
8.7244 |
1.1386 |
|
Linear SVM (Kernel function: Linear; Kernel scale: Automatic; Box constraint: Automatic; Epsilon: Automatic; Standardize data: true) |
8.9231 |
0.42 |
79.623 |
3.6382 |
|
Quadratic SVM (Kernel function: Quadratic; Kernel scale: Automatic; Box constraint: Automatic; Epsilon: Automatic; Standardize data: true) |
7.2221 |
0.62 |
52.159 |
2.4391 |
|
Cubic SVM (Kernel function: Cubic; Kernel scale: Automatic; Box constraint: Automatic; Epsilon: Automatic; Standardize data: true) |
6.4263 |
0.7 |
41.298 |
2.1319 |
|
Fine Gaussian SVM (Kernel function: Gaussian; Kernel scale: 0.87; Box constraint: Automatic; Epsilon: Automatic; Standardize data: true) |
5.0663 |
0.81 |
25.667 |
1.5583 |
|
Medium Gaussian SVM (Kernel function: Gaussian; Kernel scale: 3.5; Box constraint: Automatic; Epsilon: Automatic; Standardize data: true) |
5.9422 |
0.74 |
35.31 |
1.8634 |
|
Coarse Gaussian SVM (Kernel function: Gaussian; Kernel scale: 14; Box constraint: Automatic; Epsilon: Automatic; Standardize data: true) |
7.1152 |
0.63 |
50.626 |
2.337 |
|
Narrow Neural Network (Number of fully connected layers: 1; First layer size: 10; Activation: ReLU; Iteration limit: 1000; Regularization strength Lambda: 0; Standardize data: Yes) |
5.5599 |
0.77 |
30.912 |
2.2585 |
|
Medium Neural Network (Number of fully connected layers: 1; First layer size: 25; Activation: ReLU; Iteration limit: 1000; Regularization strength Lambda: 0; Standardize data: Yes) |
5.1709 |
0.8 |
26.738 |
2.1357 |
|
Wide Neural Network (Number of fully connected layers: 1; First layer size: 100; Activation: ReLU; Iteration limit: 1000; Regularization strength Lambda: 0; Standardize data: Yes) |
3.9546 |
0.89 |
15.639 |
1.8244 |
|
Bilayered Neural Network (Number of fully connected layers: 2; First layer size: 10; Second layer size: 10; Activation: ReLU; Iteration limit: 1000; Regularization strength Lambda: 0; Standardize data: Yes) |
4.4895 |
0.85 |
20.156 |
1.9516 |
|
Trilayered Neural Network (Number of fully connected layers: 3; First layer size: 10; Second layer size: 10; Third layer size: 10; Activation: ReLU; Iteration limit: 1000; Regularization strength Lambda: 0; Standardize data: Yes) |
4.1177 |
0.88 |
16.955 |
1.8613 |
Table 5. Summary of key descriptive statistics
|
Groups |
Count |
Sum |
Average |
Variance |
|
RMSE |
20 |
112.3142 |
5.61571 |
3.787507 |
|
R |
20 |
14.86 |
0.743 |
0.028948 |
|
MSE |
20 |
702.6899 |
35.1345 |
539.3671 |
|
MAE |
20 |
44.9713 |
2.248565 |
0.792303 |
Figure 7. Comparison of ML models
Table 6. ANOVA results
|
Source of Variation |
SS |
df |
MS |
F |
P-Value |
F Crit |
|
Between Groups |
15864.83 |
3 |
5288.276 |
38.88611 |
2.46E-15 |
2.724944 |
|
Within Groups |
10335.54 |
76 |
135.994 |
|
|
|
|
Total |
26200.37 |
79 |
|
|
|
|
Avtovaz and Opel are favorites with drivers because of their cost-effectiveness and durability – often surpassing cars from more expensive segments like Mercedes-Benz and Toyota. Analyzing the graphs, we can say that the most expensive car brands are Rolls-Royce, Lamborghini, Mercedes-Benz, Bentley, Land Rover, Porsche, McLaren. Toyota, Ferrari, BMW, Ford, Lexus, Audi, Aston, Cadillac, Dodge. When it comes to purchasing a car, the recent models are usually the more expensive ones.
The most costly cities for buying cars are Almaty, Astana, Atyrau, Kostanay, Kyzylorda, Taraz, Ust-Kamenogorsk and Shymkent. To get the best deals on a car purchase it is advised to go to Aktau, Kokshetau, since cars from the UAE and Russia are very often exported there. A surprise for us was the addition to this list of cities such as Zhanaozen, Zhezkazgan, Taldykorgan, Turkestan and Ekibastuz.
Sedan, crossover, SUV are the most expensive car body styles. Microvan, targa, fastback and hardtop are the least costly options.
Additionally, the bigger engine size brings up the price. Lastly, gas-powered vehicles cost more than LPG or ethanol-based cars.
When we look to buy a car, often the lower the mileage, the higher the cost. This is especially true for vehicles equipped with automatic transmission and robot-driven systems – they're typically more expensive. On resale, it will be more beneficial to opt for cars with a tiptronic or CVT transmission. Cars featuring rear-wheel drive or all-wheel drive are usually pricier as well. Left hand drive cars are more expensive.
By color, the most expensive shades are black, black metallic. Slightly more expensive are cars with white metallic, green metallic, silver, silver metallic, gray, gray metallic. For repurchase, you can buy cars with the color pink, purple, lilac, blue, yellow, cherry, turquoise. Cars in some certain colors are more affordable than others. You can always repaint the car to black or black metallic for resale. The state registration of the vehicle in Kazakhstan won't affect much on its cost.
The deep neural network model has impressive RMSE (between 3.9546-4.4895) and MSE (between 15.639-20.156) values, demonstrating remarkable efficiency. The data shows that certain models, like the cubic SVM (0.7), fine Gaussian SVM (0.81), and wide neural network (0.89), have a high correlation coefficient (R), meaning they are able to accurately identify the connection between input and output variables better than other models. R values for narrow (0.77), medium (0.8), bilayered (0.85) and trilayered (0.88) neural networks displayed good performance when recording correlations between variables. The Bagged Trees model showed itself best of all with the results RMSE=2.9537, R=0.94, MSE=8.7244 and MAE=1.1386.
[1] Bukvić, L., Pašagić Škrinjar, J., Fratrović, T., Abramović, B. (2022). Price prediction and classification of used-vehicles using supervised machine learning. Sustainability, 14(24): 17034. https://doi.org/10.3390/su142417034
[2] Arora, P., Gupta, H., Singh, A. (2022). Forecasting resale value of the car: Evaluating the proficiency under the impact of machine learning model. Materials Today: Proceedings, 69: 441-445. https://doi.org/10.1016/j.matpr.2022.09.074
[3] Benabbou, F., Sael, N., Herchy, I. (2022). Machine learning for used cars price prediction: Moroccan use case. In Proceedings of the 5th International Conference on Big Data and Internet of Things, Cham: Springer International Publishing, pp. 332-346. https://doi.org/10.1007/978-3-031-07969-6_25
[4] Salim, F., Abu, N.A. (2021). Used car price estimation: Moving from linear regression towards a new S-curve model. International Journal of Business and Society, 22(3): 1174-1187. https://doi.org/10.33736/ijbs.4293.2021
[5] Kan, D., Jiang, L., Liu, C., Yang, Z., Song, D. (2023). Prediction of used car prices using back propagation neural network model based on mean encoding. In Third International Conference on Intelligent Computing and Human-Computer Interaction (ICHCI 2022), Guangzhou, China, 12509: 695-700. https://doi.org/10.1117/12.2655828
[6] Krishnan, J.R., Selvaraj, V. (2022). Predicting resale car prices using machine learning regression models with ensemble techniques. In AIP Conference Proceedings, Kattankulathur, India, 2516(1): 240001. https://doi.org/10.1063/5.0108560
[7] Varshitha, J., Jahnavi, K., Lakshmi, C. (2022). Prediction of used car prices using artificial neural networks and machine learning. In 2022 International Conference on Computer Communication and Informatics (ICCCI), Coimbatore, India, pp. 1-4. https://doi.org/10.1109/ICCCI54379.2022.9740817
[8] Li, Y.S., Li, Y.X., Liu, Y.X. (2022). Research on used car price prediction based on random forest and LightGBM. In 2022 IEEE 2nd International Conference on Data Science and Computer Application (ICDSCA), Dalian, China, pp. 539-543. https://doi.org/10.1109/ICDSCA56264.2022.9988116
[9] Al-Turjman, F., Hussain, A.A., Alturjman, S., Altrjman, C. (2022). Vehicle price classification and prediction using machine learning in the IoT smart manufacturing era. Sustainability, 14(15): 9147. https://doi.org/10.3390/su14159147
[10] Ponmalar, P. (2020). Review on the pre-owned car price determination using machine learning approaches. In 2022 International Conference on Augmented Intelligence and Sustainable Systems (ICAISS), Trichy, India, pp. 274-278. http://doi.org/10.1109/ICAISS55157.2022.10010958
[11] Chen, Z., Li, X. (2022). Vehicle price forecasting based on multiple machine learning models. In 2022 IEEE Conference on Telecommunications, Optics and Computer Science (TOCS), Dalian, China,, pp. 1180-1185. https://doi.org/10.1109/TOCS56154.2022.10015958
[12] Kumar, S., Kaur, D., Parvez, A. (2022). Prediction of prices car price prediction with machne learning. In 2022 International Conference on Cyber Resilience (ICCR), Dubai, United Arab Emirates, pp. 1-4. https://doi.org/10.1109/ICCR56254.2022.9995772
[13] Anil Kumar, N. (2022). Second-hand car price prediction. In Computational Intelligence and Data Analytics: Proceedings of ICCIDA 2022, Singapore: Springer Nature Singapore, pp. 421-429.
[14] Amik, F.R., Lanard, A., Ismat, A., Momen, S. (2021). Application of machine learning techniques to predict the price of pre-owned cars in bangladesh. Information, 12(12): 514. https://doi.org/10.3390/info12120514
[15] Zhang, W., Ma, L. (2021). Research and application of second-hand commodity price evaluation methods on B2C platform: Take the used car platform as an example. Annals of Operations Research, 326(Suppl 1): 37. https://doi.org/10.1007/s10479-021-04332-5
[16] Pratola, M.T., Chipman, H.A., George, E.I., McCulloch, R.E. (2020). Heteroscedastic BART via multiplicative regression trees. Journal of Computational and Graphical Statistics, 29(2): 405-417. https://doi.org/10.1080/10618600.2019.1677243
[17] Madhuvanthi, K., Nallakaruppan, M.K., Senthilkumar, N.C., Siva Rama Krishnan, S. (2019). Car sales prediction using machine learning algorithms. International Journal of Innovative Technology and Exploring Engineering, 8(5): 1039-1050.
[18] Gegic, E., Isakovic, B., Keco, D., Masetic, Z., Kevric, J. (2019). Car price prediction using machine learning techniques. TEM Journal, 8(1): 113.
[19] Tsagris, M., Fafalios, S. (2022). Advanced car price modelling and prediction. In Advances in Econometrics, Operational Research, Data Science and Actuarial Studies: Techniques and Theories. Cham: Springer International Publishing. pp. 479-494. https://doi.org/10.1007/978-3-030-85254-2_29
[20] Basysyar, F.M., Wulandari, M., Sucitra, I., Kurnia, D.A. (2022). Prediction of automobiles prices using exploratory data analysis based on improved machine learning techniques. In 2022 Seventh International Conference on Informatics and Computing (ICIC), Denpasar, Bali, Indonesia, pp. 1-6. https://doi.org/10.1109/ICIC56845.2022.10006925
[21] Liu, E., Li, J., Zheng, A., Liu, H.R., Jiang, T. (2022). Research on the prediction model of the used car price in view of the PSO-GRA-BP neural network. Sustainability, 14(15): 8993. https://doi.org/10.3390/su14158993
[22] Lessmann, S., Voß, S. (2017). Car resale price forecasting: The impact of regression method, private information, and heterogeneity on forecast accuracy. International Journal of Forecasting, 33(4): 864-877. https://doi.org/10.1016/j.ijforecast.2017.04.003
[23] Omarbekova, A., Sharipbay, A., Barlybaev, A. (2017). Generation of test questions from RDF files using PYTHON and SPARQL. Journal of Physics: Conference Series, Kuala Lumpur, Malaysia, 806(1): 012009. https://doi.org/10.1088/1742-6596/806/1/012009
[24] Sharipbay, A., Barlybayev, A., Sabyrov, T. (2016). Measure the usability of graphical user interface. Small, 8: 20. https://doi.org/10.1007/978-3-319-31232-3_98
[25] Abdymanapov, S.A., Muratbekov, M., Altynbek, S., Barlybayev, A. (2021). Fuzzy expert system of information security risk assessment on the example of analysis learning management systems. IEEE Access, 9: 156556-156565. https://doi.org/10.1109/ACCESS.2021.3129488
[26] Abdymanapov, S.A., Barlybayev, A., Kuzenbayev, B.A. (2019). Quality evaluation fuzzy method of automated control systems on the LMS example. IEEE Access, 7: 138000-138010. https://doi.org/10.1109/ACCESS.2019.2943000
[27] Mandhala, V.N., Bhattacharyya, D., Midhunchakkaravarthy, D., Hye-jin, K. (2022). Detecting and mitigating bias in data using machine learning with pre-training metrics. Ingenierie des Systemes d'Information, 27(1): 119-125. https://doi.org/10.18280/isi.270114
[28] Sudrajat, D., Purnamasari, A.I., Dikananda, A.R., Kurnia, D. A., Efendi, D.M. (2023). Hybrid learning predictions on learning quality using multiple linear regression. Ingénierie des Systèmes d'Information, 28(1): 155-160. https://doi.org/10.18280/isi.280116