Helmi Imaduddin*![]() | Lucky Anggari Kusumaningtias
| Lucky Anggari Kusumaningtias![]() | Fiddin Yusfida A'la
| Fiddin Yusfida A'la![]()
© 2023 IIETA. This article is published by IIETA and is licensed under the CC BY 4.0 license (http://creativecommons.org/licenses/by/4.0/).
OPEN ACCESS
Hate speech, characterized by intentional expressions of dissatisfaction, is a prevalent phenomenon on social media platforms, including Twitter. Its continual occurrence can foster divisions, misunderstandings, and even acts of violence between individuals and groups, particularly due to the resulting prejudice. This study investigates the occurrence of hate speech within Indonesian content on Twitter, employing a deep learning approach to detect and analyze such expressions. The Long Short-Term Memory (LSTM) method, coupled with the GloVe word embedding technique, is utilized on a dataset comprising 13,169 Indonesian tweets flagged for hate speech. Four distinct model architectures were developed through the integration of LSTM and GloVe. The findings reveal model 1 to exhibit superior performance, achieving a precision of 89%, a recall of 99%, an F-1 score of 94%, and an overall accuracy of 94.24%. It is suggested that future research explore the potential deployment of this model in web or mobile platforms for real-time analysis, thereby enhancing the capacity for immediate hate speech detection and mitigation.
deep learning, GloVe, hate speech, Long Short-Term Memory (LSTM), Natural Language Processing (NLP), twitter
Hate speech, a pervasive issue across various mediums-ranging from direct conversations and written content to videos and voice recordings is characterized by intentional statements inciting hatred against individuals or groups. Serving primarily to instigate divisions and hostilities, the repercussions of hate speech include the formation of prejudice and violent actions, particularly amongst the parties involved [1]. Notably, social media platforms, such as Twitter, serve as significant outlets for the propagation of hate speech.
Twitter facilitates open communication and social networking [2, 3], enabling user interactions via textual, photographic, and video content. However, the platform's extensive reach also exposes users to potential offenses [4]. Moreover, Twitter serves as a medium for sharing opinions and sentiments about social phenomena, thereby becoming a platform for both intentional and unintentional spread of hate speech.
Given the prevalence of hate speech in tweets, sentiment analysis becomes essential. This process involves classifying text or documents into positive, neutral, and negative sentiments [5-7], thereby mitigating the adverse impact of negative comments, including hate speech. As a part of Natural Language Processing (NLP), a branch of artificial intelligence that processes and analyzes natural language [8, 9], sentiment analysis aids researchers in identifying unfavorable comments prevalent on social media.
Various methods, including naïve Bayes, logistic regression, SVM, decision trees, and deep learning techniques like Long Short-Term Memory (LSTM), have been employed for sentiment analysis and detection of hate speech. LSTM, an architecture of Recurrent Neural Network (RNN), utilizes a memory block for selecting output values based on long-term stored information [10, 11]. To implement LSTM, a word embedding process is required to comprehend the relationship between words, one of which is the GloVe method. Past research has demonstrated a high accuracy level of models integrating LSTM and GloVe when implemented using the Python programming language [12, 13].
Several pertinent studies have been conducted on this topic. Rahman et al. [14] evaluated LSTM's performance in sentiment analysis on Indonesian-language tweets related to quarantine and concluded that LSTM was effective in predicting sentiments in these tweets. Alghifari et al. [15] used LSTM for identifying satisfaction levels with Grab services and found that the Bidirectional LSTM algorithm performed better than other algorithms. A hate speech detection model using a dataset of 13,169 was created by Ridwan and Muzakir [16], with the best results obtained from a CNN-LSTM model. Yu et al. [11] classified sentiment towards public responses on Twitter regarding the COVID-19 vaccine and found that LSTM achieved higher accuracy than other methods. Yazid et al. [17] detected and classified hate speech and its threat level using the naïve Bayes method. Similarly, Ihsan et al. [18] developed a system to classify tweets of hate speech and harsh words using a decision tree. Finally, Rahman et al. [19] classified hate speech into five classes using the SVM method.
Despite these efforts, there is still room for improving the accuracy of hate speech detection models. This study, therefore, proposes the use of LSTM and GloVe word embedding for detecting hate speech in Twitter data. The dataset, derived from Twitter, comprises 13,169 instances, including 7,608 non-hate speech and 5,561 hate speech data entries.
Researchers used a deep learning algorithm approach to detect hate speech from Indonesian public opinion data from Twitter. The LSTM method was chosen because it has good performance in text processing. Besides that word, embedding GloVe is also used to convert Indonesian text into vector form. Figure 1 shows the steps taken in this study.
Figure 1. Research flow
2.1 Data collection
The data used in this study was taken from Kaggle, which contains Twitter text containing abusive and hate speech, with a total of 13.169 Indonesian language data (Indonesian Abusive and Hate Speech Twitter Text | Kaggle [20]). The data is labeled 1 or 0 according to the presence of hate speech. Data labeled 1 means it contains hate speech, while data labeled 0 means it does not. Table 1 displays an example of the dataset used in this study.
Table 1. Sample from dataset
|
Tweets |
HS |
|
Disaat semua cowok berusaha melacak perhatian gue. loe lantas remehkan perhatian yg gue kasih khusus ke elo. basic elo cowok bego ! ! !' |
1 |
|
Deklarasi pilkada 2018 aman dan anti hoax warga dukuh sari jabon |
0 |
2.2 Reprocessing data
Data preprocessing is preparing dirty data into data that is ready for processing or further processing. Data preprocessing can also be said to be the process of processing raw data into data that is easy to understand so that it is ready to be used by going through several processes. The process that preprocesses the data in this study is as follows:
2.2.1 Case folding
Not all data contained in the dataset are uniform letters. There are lowercase and uppercase letters. Therefore, it is necessary to have case folding to change all uppercase letters to lowercase letters (lower case). Case Folding is used to standardize the text in the dataset [21]. The case folding process result is shown in Table 2.
Table 2. Case folding result
|
Original |
Replacement |
|
Belakangan ini kok fikiran ampas banget ya' |
Belakangan ini kok fikiran ampas banget ya' |
|
Ini si USER kerjaannya delay mulu! Setan!' |
Ini si user kerjaannya delay mulu! setan!' |
|
Pegawai Guardian training |
pegawai guardian training |
2.2.2 Data cleaning
Data cleaning is the process of cleaning data that is not needed. Data cleansing will remove excess spaces, symbols, usernames, URLs, numbers, non-ASCII, hashtags, mentions, non-alphanumeric, and other unique characters 18. Data cleaning is vital in data preprocessing because data cleansing will clean data from unnecessary data. Clean data will be easier to process and provide better accuracy performance. The data cleaning result is shown in Table 3.
Table 3. Data cleaning result
|
Original |
Replacement |
|
Belakangan ini kok fikiran ampas banget ya' |
belakangan ini kok fikiran ampas banget ya |
|
Ini si USER kerjaannya delay mulu! Setan!' |
Ini si user kerjaannya delay mulu! setan |
|
Pegawai Guardian training |
pegawai guardian training |
2.2.3 Data normalization
Data normalization is used to make improvements to non-standard words or abbreviated words. This improvement uses a normalized dictionary that matches the standard word characters in Indonesian [22]. An example of the normalized dictionary used in this study can be seen in Table 4.
Table 4. Normalization dictionary
|
Original |
Replacement |
|
Anakjakartaasikasik |
Anak jakarta asyik |
|
Ahlamdulillah |
Alhamdulillah |
|
Ajib |
Hebat |
|
Adl |
Adalah |
2.2.4 Stopword removal
Stopwords removal is a process of removing words that are not important and have no meaning. This process requires a dictionary of stopwords [23]. The dictionary contains a list of words that will be removed when they appear in the dataset so that it becomes more concise without reducing the meaning.
2.2.5 Tokenizing
Tokenizing is a technique that converts text in sentences into word-for-word fractions [24, 25]. Tokenizing will separate either paragraphs or sentences into tokens according to the words that compose them. Generally, between one word and another word separated by a space, this tokenizing will separate characters based on each word that composes it. This process will make it easier to analyze data in text.
2.3 Data splitting
Data Splitting is done to divide the dataset into two data, namely training data and testing data. The dataset distribution consists of 80% training and 20% testing data. The training data is used to create a classification model. In contrast, the testing data is used to measure the performance of the model that has been made.
2.4 Word embedding
Word Embedding is a pre-training technique to map each word into a high-dimensional vector form. Word embedding is usually implemented in the embedding layer parameters in creating a classification model. Pre-trained word embedding means using word embedding that has been trained from an extensive dataset so that it can be used to solve similar problems. This study used a pre-trained glove (Global Vectors) with a dimension of 200.
2.5 LSTM algorithm
This study uses the LSTM algorithm approach. This algorithm has three main gates: memory cells, input gates, forget gates, and output gates. The input gate will oversee determining the value to be updated. Then it will proceed to the forget gate, whose job is to filter the information used. Then it will proceed to the output gate, which determines the output to be produced [26]. LSTM illustration can be seen in Figure 2.
Figure 2. LSTM memory block
LSTM is designed to store information from previous cells which will later be able to find hidden layers of each cell. This method is used by classifying long-term data using storage in memory cells.
2.6 Training models
The training model is a step for configuring parameters in making a model so that it can train the data that has been provided. Researchers use the Adaptive Moment Estimation (Adam) optimization method to compile the model. Adam is an effective optimization method for dealing with sparse gradients on noisy data. Researchers can use Adam's optimization to reduce gradient values better [27]. Adam's optimization is often used in deep learning algorithms because it produces better performance and a faster training process.
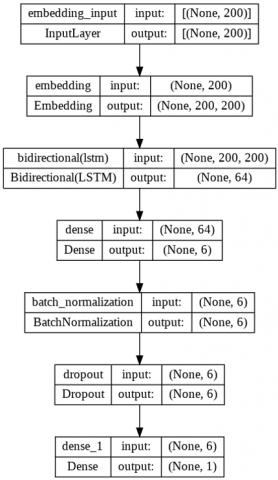
This research uses the TensorFlow framework to run the deep learning model, there are several other parameters used such as batch size 128, epochs 10, embedding dimension 200, dropout 0.5, sigmoid activation function and binary cross entropy loss function, because the target of this research is binary (0 and 1). The metric used is accuracy, recall, precision and F1-Score. Figure 3 has shown the model architecture of the research.
Figure 3. Model architecture
2.7 Evaluation
Model evaluation is critical to do because model evaluation is a step to measure how well the model’s performance has been made. The classification of the dataset into hate speech and non-hate speech means it is included in the binary classification. The parameters contained in the Confusion matrix are True positive (TF), True negative (TN), False positive (FP), and False negative (FN). The precision, recall, F-1 score, and accuracy values from these parameters will be calculated. The accuracy formula has been shown in Eq. (1), the recall formula has been shown in Eq. (2), the precision formula has been shown in Eq. (3), and the F1-Score formula has been shown in Eq. (4).
$Accuracy=\frac{T P+T N}{T P+F P+F N+T N}$ (1)
$Recall=\frac{T P}{T P+F N}$ (2)
$Precision=\frac{T P}{T P+F P}$ (3)
$F 1- Score =\frac{2 \times( { Precision } \times { recall })}{ { recall }+ { precision }}$ (4)
This study uses an initial dataset consisting of 13.169 data. This dataset has 7.608 data labeled 0 and 5.561 data labeled 1. There is a significant data imbalance. To overcome this, researchers use a combination of up-sampling and down-sampling so that the difference in the amount of data is not too significant. Thus, the final dataset consisted of 15,796 data, with 7,608 data labeled 0 and 8,188 data labeled 1.
Before proceeding further, the dataset needs to be preprocessed first. Furthermore, the clean dataset is divided into two parts, namely 80% training data (12,636 data) and 20% testing data (3,160 data). After data sharing is done, the next step is tokenizing. This process is the stage for converting text into a number or token representation the model can process.
This study uses two architectural models that use word embedding, Glove and LSTM. The first architecture has six layers consisting of the first layer is the embedding layer with an input size of 200, the second layer is the BiLSTM single layer with 32 units, the third layer is the dense layer with six units, the fourth layer is the batch normalization layer, the fifth layer is the dropout layer with the dropout rate is 0.5, and the last layer is a dense layer with 1 unit and uses the sigmoid activation function.
The second architecture has five layers consisting of the first layer is the embedding layer with an input size of 200, the second layer is the BiLSTM layer with 32 units, the third layer is the dense layer with six units, the fourth layer is the dropout layer with a dropout rate of 0.5, and the sixth layer is the dense layer with 1 unit and uses the sigmoid activation function.
The two architectural models were also implemented without using the word embedding Glove, thus forming four different architectural models. The differences between the four architectures can be seen in Table 5, which includes the number of layers, types of layers, and parameters used in each architecture.
Table 5. Architectural differences
|
Model |
Layers |
Pre-trained |
|
Architecture 1 |
6 |
Gloves |
|
Architecture 2 |
6 |
- |
|
Architecture 3 |
5 |
Gloves |
|
Architecture 4 |
5 |
- |
The researcher uses batch size 128 and epoch ten during the training process. Furthermore, the researcher evaluates the model that has been built to find out how well it performs. The evaluation uses a confusion matrix, which helps measure the model's performance.
The evaluation results show that the best model is architecture model 1, which uses pre-trained GloVe. This model obtained an accuracy score of 94.24%, a precision of 89%, a recall of 99%, and an F-1 score of 94%. Precision measures how accurately the model identifies hate speech, recall measures how much hate speech has been successfully detected, and the F-1 score combines these two metrics to provide an overall picture of the model's performance.
The model can accurately classify data containing hate speech with high precision results. Meanwhile, high recall indicates that the model can detect most hate speech in the dataset. A high F-1 score indicates a balance between precision and recall, so the model can be considered effective in correctly classifying hate speech. A comparison of the results of the model evaluation of the four architectures can be seen in Table 6.
Table 6. Comparison results
|
Model |
Precision |
Recall |
F-1 Score |
Accuracy |
|
Architecture 1 |
89% |
99% |
94% |
94.24% |
|
Architecture 2 |
88% |
99% |
93% |
93.61% |
|
Architecture 3 |
88% |
99% |
93% |
94.24% |
|
Architecture 4 |
89% |
98% |
93% |
93.80% |
Based on Table 6, the comparison results show the evaluation of the four models with results that are not much different. The highest level of accuracy obtained is equal to 94.24%. The accuracy value describes the value of the accuracy of the model in classifying.
Furthermore, there is precision where this precision value is the value of the comparison between the accurate positive predictions and the overall results that are predicted to be positive. Suppose, based on the table, the precision value on architecture 1 is 89%. In that case, the precision on architecture 2 is 88%, the precision on architecture 3 is 88%, and the precision on architecture 4 is 89%. This result means that each architecture can correctly predict positive or tweets containing hate speech by the percentage obtained of all tweets predicted hate speech.
Then there is recall. Recall means the magnitude of the comparison between the correct positive predictions and the overall positive data. Based on the table, the recall value for architecture 1, 2, and 3 is 99%, while architecture 4 is 98%. This result means that each architecture can predict tweets that contain hate speech by the percentage value obtained from all tweets that contain hate speech.
Then there is the F-1 Score. The F-1 Score itself means a comparison between the precision and recall values. If the F-1 score is good, then the precision and recall values are also good. The best F-1 score is 1, and the worst is 0. Based on the table, the F-1 score for architecture 1 is 94%, and for architecture 2, architecture 3, and architecture 4 is 93%.
Based on the results comparison table and explanation above, the accuracy produced by architectures 1 and 3 has higher accuracy compared to architectures 2 and 4. This result shows that the LSTM model with an embedding glove can work better than without using an embedding glove. The model with the best results is architecture 1, which produces 89% precision, 99% recall, 94% F-1 score, and 94.24% accuracy. Applying pre-trained gloves in this study affected the decrease in loss values to minimize the possibility of overfitting and increase the accuracy obtained. As a result, of validation, the researcher made predictions on the four architectures.
The comparison of this study with previous studies is that there are differences in the methods used to increase accuracy from previous studies. Research conducted by Ihsan et al. [18] used the decision tree method and the lexicon feature, which produced the highest accuracy of 70.48%. Furthermore, research conducted by Yazid et al. [17] used the CNN method with word embedding skip grams. This research resulted in the highest accuracy of 69.1%. Subsequent research conducted by Alghifari et al. [15] using the naïve Bayes method and TF-IDF weighting produced the highest F-Score of 64.957%. While in this study, using the LSTM method with word embedding Glove 200 dimensions produces the highest accuracy of 94.24% and F-1 Score of 94%. The comparison can be seen in Table 7.
Based on Table 7, a comparison with previous research, using LSTM and word embedding Glove produces accuracy and a higher F-1 score than using a decision tree with lexicon features, CNN with word embedding skip grams, and naïve Bayes with TF-weighting. IDF. The results obtained in this study were influenced by several factors, including data balance, dataset labels, use of word embedding gloves, preprocessing data, use of kernel regularizer = l1, use of batch layer normalization, use of BiLSTM, and use of dropouts.
LSTM and word embedding gloves outperforms the other model since this architecture has several positive points. GloVe embeddings show the semantic relationships between words based on how often they appear together in big text corpora. Furthermore, GloVe embeddings group together in the embedding space words that are alike in meaning. This feature helps the model do a better job of generalizing to words it has not seen during training, which is important for dealing with the different ways hate speech can be expressed.
Table 7. Comparison with previous research
|
Researcher |
Method |
Accuracy |
F-1 Score |
|
Alghifari et al. [15] |
CNN and word embedding skip grams |
69.1% |
N/A |
|
Ridwan and Muzakir [16] |
Naïve bayes and TF-IDF |
N/A |
64.957% |
|
Yazid et al. [17] |
Decision Tree and lexicon features |
70.48% |
N/A |
|
This research |
LSTM and word embedding gloves |
94.24% |
94% |
Hate speech usually aims to insult, demean, or cause violence or harm against the people or groups it is directed at. It often uses offensive language, derogatory terms that stirs up anger. In internet era, social media (Twitter) probably contain hate speech which can offense other users. However, analyze Twitter data manually can be exhausted. To automate the analysis, this study applies a 200-dimensional word embedding Glove and LSTM to detect hate speech in Indonesian Twitter data. The dataset from Twitter will be predicted into two categories: hate speech and non-hate speech. Researchers created 4 model architectures that combined LSTM and Glove for the classification process. Based on the experiment, models using word-embedding gloves and LSTM have better results than models without pre-trained gloves because it allows the model to understand the meaning of words in a more nuanced way. The pre-trained Glove in this study influences increasing accuracy and decreasing loss values, thus making the model performs better. The diverse dataset can help the model learn faster and more effectively. The best model is obtained by architecture 1 with 89% precision, 99% recall, 94% F-1 score, and 94.24% accuracy.
There is possibility to improve the accuracy, such as combining this architecture with GloVe-CNN-BiLSTM. This research also has possibility to be improved such as the contextual understanding. Specifically, during the manual labeling, the label should be double checked with the Indonesian language specialist.
The authors express gratitude to the Universitas Muhammadiyah Surakarta for providing research support, enabling the completion of this research.
[1] United Nations. (2023). Understanding hate speech. https://www.un.org/en/hate-speech/understanding-hate-speech/what-is-hate-speech.
[2] Muhammadi, R.H., Laksana, T.G., Arifa, A.B. (2022). Combination of support vector machine and lexicon-based algorithm in twitter sentiment analysis. Khazanah Informatika: Jurnal Ilmu Komputer dan Informatika, 8(1): 59-71. https://doi.org/10.23917/khif.v8i1.15213
[3] Pamungkas, E.W., Putri, D.G.P., Fatmawati, A. (2023). Hate Speech detection in bahasa indonesia: challenges and opportunities. International Journal of Advanced Computer Science and Applications, 14(6): 1175-1181. https://doi.org/10.14569/IJACSA.2023.01406125
[4] Nycyk, M. (2021). Journeying through the twitterverse: Examining twitter. In Journeying Through the Twitterverse: Examining Twitter. Brisbane, Australia: Michael Nycyk.
[5] Medhat, W., Hassan, A., Korashy, H. (2014). Sentiment analysis algorithms and applications: A survey. Ain Shams Engineering Journal, 5(4): 1093-1113. https://doi.org/10.1016/j.asej.2014.04.011
[6] A’la, F.Y., Hartatik, Firdaus, N., Safi’ie, M.A., Riasti, B.K. (2022). A Comprehensive Analysis of Twitter Data: A Case Study of Tourism in Indonesia. In 2022 1st International Conference on Smart Technology, Applied Informatics, and Engineering (APICS), Surakarta, Indonesia, pp. 85-89. https://doi.org/10.1109/APICS56469.2022.9918757
[7] Imaduddin, H., A’la, F.Y., Nugroho, Y.S., (2023). Sentiment analysis in indonesian healthcare applications using IndoBERT approach. International Journal of Advanced Computer Science and Applications (IJACSA), 14(8): 113-117. https://doi.org/10.14569/IJACSA.2023.0140813
[8] Sharma, A. (2021). Natural language processing and sentiment analysis. International Research Journal of Computer Science, 8(10): 237-242. https://doi.org/10.26562/irjcs.2021.v0810.001
[9] Trihandaru, S., Parhusip, H.A., Susanto, B., Putri, C.F.R. (2021). Word cloud of UKSW lecturer research competence based on google scholar data. Khazanah Informatika: Jurnal Ilmu Komputer dan Informatika, 7(2): 52-59. https://doi.org/10.23917/khif.v7i2.13123
[10] Wöllmer, M., Eyben, F., Graves, A., Schuller, B., Rigoll, G. (2010). Bidirectional LSTM networks for context-sensitive keyword detection in a cognitive virtual agent framework. Cognitive Computation, 2(3): 180-190. https://doi.org/10.1007/s12559-010-9041-8
[11] Yu, Y., Si, X., Hu, C., Zhang, J. (2019). A review of recurrent neural networks: LSTM cells and network architectures. Neural Computation, 31(7): 1235-1270. https://doi.org/10.1162/neco_a_01199
[12] Poetra, C.K., Pane, S.F., Fatonah, N.S. (2021). Improving the accuracy of long-short term memory (LSTM) on sentiment analysis of COVID-19 vaccine on twitter with glove. Jurnal Telematika, 16(2): 85-90.
[13] Imaduddin, H., Widyawan, Fauziati, S. (2019). Word Embedding Comparison for Indonesian Language Sentiment Analysis. In 2019 International Conference of Artificial Intelligence and Information Technology (ICAIIT), Yogyakarta, Indonesia, pp. 426-430. https://doi.org/10.1109/ICAIIT.2019.8834536
[14] Rahman, M.Z., Sari, Y.A., Yudistira, N. (2021). Sentiment analysis of tweet COVID-19 using Word embedding and long short-term memory (LSTM) method. Jurnal Pengembangan Teknologi Informasi dan Ilmu Komputer, 5(11): 5120-5127.
[15] Alghifari, D.R., Edi, M., Firmansyah, L. (2022). Implementation of bidirectional LSTM for sentiment analysis of grab indonesia services. Jurnal Manajemen Informatika (JAMIKA), 12(2): 89-99. https://doi.org/10.34010/jamika.v12i2.7764
[16] Ridwan, M., Muzakir, A. (2022). Hate speech classification model on twitter data using CNN-LSTM. Teknomatika, 12(2): 209-218. Retrieved from https://ojs.palcomtech.ac.id/index.php/teknomatika/article/view/604
[17] Yazid, RM., Umbara, F.R., Sabrina, P.N. (2023). Hate Speech detection with naïve bayes classification method and n-gram method on indonesian twitter multi-label dataset. Informatics and Digital Expert (INDEX), 4(2): 46-52. https://doi.org/10.36423/index.v4i2.894
[18] Ihsan, F., Iskandar, I., Harahap, N.S., Agustian, S. (2021). Decision tree algorithm for multi-label hate speech and abusive language detection in Indonesian Twitter. Jurnal Teknologi dan Sistem Komputer, 9(4): 199-204. https://doi.org/10.14710/jtsiskom.2021.13907
[19] Rahman, O.H., Abdillah, G., Komarudin, A. (2021). Klasifikasi ujaran kebencian pada media sosial twitter menggunakan support vector machine. Jurnal RESTI (Rekayasa Sistem dan Teknologi Informasi), 5(1): 17-23. https://doi.org/10.29207/resti.v5i1.2700
[20] Ibrohim, M.O., Budi, I. (2019). Multi-label hate speech and abusive language detection in indonesian twitter. In Proceedings of the Third Workshop on Abusive Language Online, Florence, Italy, pp. 46-57. https://doi.org/10.18653/v1/W19-3506
[21] Rianto, Mutiara, A.B., Wibowo, E.P., Santosa, P.I. (2021). Improving the accuracy of text classification using stemming method, a case of non-formal Indonesian conversation. Journal of Big Data, 8(1): 26. https://doi.org/10.1186/s40537-021-00413-1
[22] Kurnia, A., Yulianti, E. (2020). Statistical machine translation approach for lexical normalization on indonesian text. In 2020 International Conference on Asian Language Processing (IALP), Lumpur, Malaysia, pp. 288-293. https://doi.org/10.1109/IALP51396.2020.9310508
[23] Jha, V., Manjunath, N., Shenoy, P.D., Venugopal, K.R. (2016). HSRA: Hindi stopword removal algorithm. In 2016 International Conference on Microelectronics, Computing and Communications (MicroCom), Durgapur, India, pp. 1-5. https://doi.org/10.1109/MicroCom.2016.7522593
[24] Rajagopal, D., Cambria, E., Olsher, D., & Kwok, K. (2013). A graph-based approach to commonsense concept extraction and semantic similarity detection. In Proceedings of the 22nd International Conference on World Wide Web (pp. 565-570). New York, NY, USA: ACM. https://doi.org/10.1145/2487788.2487995
[25] Chikersal, P., Poria, S., Cambria, E. (2015). SeNTU: Sentiment analysis of tweets by combining a rule-based classifier with supervised learning. In Proceedings of the 9th International Workshop on Semantic Evaluation (SemEval 2015), Denver, Colorado, pp. 647-651. https://doi.org/10.18653/v1/S15-2108
[26] Amrustian, M.A., Widayat, W., Wirawan, A.M. (2022). Analisis sentimen evaluasi terhadap pengajaran dosen di perguruan tinggi menggunakan metode LSTM. Jurnal Media Informatika Budidarma, 6(1): 535-541. https://doi.org/10.30865/mib.v6i1.3527
[27] Kingma, D.P., Ba, J. (2014). Adam: A method for stochastic optimization. arXiv preprint arXiv:1412.6980.