Aradea Aradea*![]() | Rianto Rianto
| Rianto Rianto![]() | Husni Mubarok
| Husni Mubarok![]() | Irfan Darmawan
| Irfan Darmawan![]()
© 2023 IIETA. This article is published by IIETA and is licensed under the CC BY 4.0 license (http://creativecommons.org/licenses/by/4.0/).
OPEN ACCESS
Recommendation systems serve as pivotal components in the agricultural domain, significantly contributing to global economic growth. One particular application, the recommendation of region-specific plant types, can mitigate losses in unfavorable conditions and optimize yields when growth conditions are ideal. However, accurately identifying the specific parameters of a field location and the diverse characteristics of plant types can pose a challenge. Deep learning has demonstrated efficacy as a predictive model within recommender systems, including those for plant type matching. However, building such models necessitates the identification of optimal solutions, taking into account the complexities of the problem scope and the unique characteristics of the domain. This paper introduces the development of a deep learning model architecture designed to recommend plant types best suited to specific regions. The model was constructed based on an extension of the Convolutional Neural Network (CNN), a deep learning model recognized for its robust pattern recognition capabilities, making it suitable for classification tasks. It has the ability to discern patterns from datasets with a limited number of input features, thus making it an ideal choice for a plant type recommendation system. The Adagrad optimizer was employed for its advantage of partitioning the learning rate into smaller units, which significantly impacts the speed of the training process. Evaluation of this model was undertaken in a two-step process. First, the learning model's performance was assessed using a confusion matrix. Subsequently, the model's functionality was evaluated using real data from a city in Indonesia, investigating its ability to provide relevant recommendations based on the city's unique contextual characteristics. The results demonstrated a substantial accuracy level of 90%, underscoring the model's potential to effectively recommend suitable plant types for specific regional contexts.
agricultural, deep learning, Convolutional Neural Network (CNN), recommender system, plant type, Adagrad optimizer
Agriculture significantly underpins the global economy, satisfying one of humanity's fundamental needs: food. Shortcomings in knowledge at various stages of the farming process can compound into challenges and inflate the operational costs. The increasing population exerts additional pressure on the agricultural sector, necessitating the implementation of technology as a solution, as suggested by Meshram et al. [1]. The forthcoming decades pose a challenge for agriculture, namely, the simultaneous achievement of food security, improved nutrition, and biodiversity conservation, as outlined by Gaffney et al. [2]. Agricultural planning in agro-based nations strives to maximize crop yields utilizing limited land resources.
The process of selecting plant species can minimize losses under unfavorable conditions and maximize yields when conditions are optimal [3]. Despite this, the adoption of traditional cropping patterns remains prevalent among many farmers, leading to suboptimal plant selection in various regions [4]. India serves as an example of a nation that has successfully implemented technology in agriculture, employing a system to identify location-specific parameters to address plant selection challenges.
Several approaches have been deployed by researchers to address this issue. The Analytic Hierarchy Process (AHP) has been extensively employed to aid decision-making based on multiple criteria, calculating weight or value comparisons for each plant type, which results in a ranking of recommended plants [5]. Yanuari et al. [4] utilized the Simple Additive Weighting (SAW) method to determine suitable plant types for specific regions based on temperature, air pressure, wind speed, humidity, rainfall, and altitude parameters. The weight value of each parameter is determined through multiple linear regression analysis, yielding a maximum accuracy level of 73.33%.
Wibowo and Ramdhani [6] developed a food plant recommendation model employing several data mining methods, performing information extraction to discover patterns and knowledge from datasets. They used various classification techniques, including Naïve Bayes, Decision Tree, Support Vector Machine (SVM), Neural Network, Random Tree, Random Forest, and K Nearest Neighbor (KNN).
Mythili and Rangaraj [7] proposed a learning model integrating Modified Deep Neural Networks (MDNN) and Particle Swarm Optimization (PSO), referred to as PSO-MDNN. The model delivered plant recommendations according to site-specific parameters with considerable accuracy and efficiency. Their model relied on a plant database supplied by agricultural experts, which formed the system knowledge base for the learning process [7].
Rehman et al. [8] developed image processing and segmentation techniques to identify plant diseases, which is then carried out by classifying plant diseases with multi-class SVM. The results of the method developed have the ability to identify three types of diseases in plants by showing an accuracy value of 95%.
Despite these advancements, gaps remain, opening avenues for future research. Primarily, methods for determining site-specific values that can enhance productivity require further investigation, as the achieved accuracy levels are yet to reach optimal levels [7]. The outcomes of agricultural processes must be precise due to the potential financial and material losses associated with inaccuracies. Deep learning methods have demonstrated promising results for the prediction process of an accurate and stable plant recommendation [9]. However, the construction of a model requires careful consideration of the optimal solution, taking into account the problem space's breadth in the domain.
This paper introduces a solution model in agriculture: a plant type recommendation system for specific regions, based on a deep learning approach. The system is constructed through the expansion of a deep learning model, employing the Convolutional Neural Network (CNN) algorithm, supplemented with Adagrad as an optimizer due to its capacity to divide the learning rate into smaller segments, accelerating the training process. The paper addresses gaps from previous work related to lack of performance in real-world implementations. The research is oriented towards assessing the model's performance when applied in real-world scenarios, offering up to 22 plant species recommendations with only four input features required for predictions, namely, temperature, humidity, pH, and rainfall. The limited number of features could result in underfitting or underperformance of the model, hence the utilization of the Convolutional Neural Network (CNN) deep learning model, known for its robust pattern recognition, as a classification method to address this issue. The Adagrad optimizer prepares the model to handle extensive data in the future.
The remainder of this paper comprises sections related to previous work, which describe the state of the art of related works, followed by the proposed method developed in this paper. Subsequent sections discuss the experimental process, including the experimental data discussion, learning model evaluation, model implementation evaluation, and threats to validity, culminating in a summary of research findings and a discussion of future work.
Contemporary research has yielded an array of results concerning recommendation systems premised on machine learning and deep learning techniques. Mythili and Rangaraj [7] proposed a plant recommendation mechanism based on a Deep Learning Technique (DLT). The system utilized historical data on crop yields and climate to inform its recommendations. The proposed method constitutes a hybrid scheme employing Ant Colony Optimizations (ACO) in an attempt to optimize Deep Convolution Neural Networks (DCNN) and Long Short Term Memory (LSTM) networks, an approach referred to as ACO-IDCNN LSTM. DCNNs can often yield high levels of accuracy but at the cost of significant computational complexity, especially with an increased number of processing layers. Weight addition to the DCNN nodes contributes further to this complexity. The researchers addressed this challenge by adjusting the weights during the training phase to reduce complex processing. ACO was employed to optimize hyperparameters in the training process, thus mitigating complexity in weights and facilitating the DCNN prediction process.
Vignesh et al. [10] proposed a decision-making model for plant species selection, integrating data mining and deep learning. This study applied a deep learning algorithm to extract beneficial plants for the forecasting process, using a Discrete Deep Belief Network with Visual Geometry Group (VGG) Net and a tweak chick swarm optimization approach to estimate agricultural production. The model predicted crop yields with an accuracy rate of 97 percent. A Tweak Chick Swarm Optimization technique was utilized to extract specialized features from the dataset, selecting 25 out of 100 input variables. This optimization technique efficiently connected components and their information, reducing the number of features used in the Discrete Hybrid deep belief network with VGG NET, which in turn reduced the classifier's training error.
Research conducted by Sehkammal [11] has contributed to enhancing models and introducing deep learning implementations that can inform decision-making during the growing season. The artificial neural network (ANN) and Long-Short Term Memory (LSTM) classification algorithms were employed to estimate yields. The evaluation of this model revealed that the ANN algorithm could achieve an accuracy rate of 96.94%, while the LSTM classification yielded 100.0% validation accuracy with a loss of 0.000278. These two deep learning strategies (ANN and LSTM) proved effective in predicting crop yields and demonstrated optimal execution metrics.
Rajak et al. [3] proposed a recommendation system that used a voting method to construct an efficient and accurate model for plant recommendations based on soil conditions to maximize crop yields. This study employed an ensemble model with a majority voting technique premised on a support vector machine (SVM) and ANN. The model successfully mapped plant recommendation rules based on soil conditions, achieving a high accuracy value.
In response to these studies, we propose a deep learning model extension as a solution model to address the residual challenges. Our model strives to optimize the accuracy and affordability of the plant type recommendation process in specific regions, based on site-specific characteristics to enhance crop productivity. The proposed method employs a Convolutional Neural Network (CNN) algorithm complemented with Adagrad optimization. We reduce the dataset features to only four input features while maintaining the model's accuracy in providing recommendations. The CNN algorithm was selected for its commendable performance in pattern recognition through convolution and pooling operations. The Adagrad optimizer was chosen for its ability to divide the learning rate into small segments, thus expediting the training process.
3.1 CNN architecture
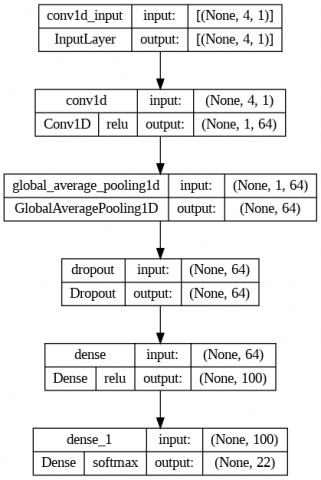
The approach used in this paper is to use a deep learning model with the Convolutional Neural Network (CNN) algorithm. The system architecture is designed by utilizing a sequential model consisting of a convolutional layer, a global average pooling layer, and a dense layer, as can be seen in Figure 1.
Figure 1. CNN architecture of recommendation system
The convolutional layer functions to perform convolution operations on the previous output layer. This layer includes the main block in the Convolutional Neural Network (CNN) which consists of randomly learned filters to perform convolution operations for feature extraction purposes to understand the feature representation from the input layer [12]. The global average pooling (GAP) layer serves to replace the fully connected layers using the GAP layer after the last convolutional layer that produces a series of feature maps with the same depth as the number of classes in the classification problems so that, the GAP involved in calculating the average value of all elements in the feature map [13]. Dropout layer is a neural network regularization technique where some neurons are randomly selected and unused during training. In other words, the neurons are disposed of randomly. This means that the contribution of discarded neurons will be suspended while the network and new weights are also not applied to neurons during backpropagation processes [14]. Meanwhile, the dense layer is another name for the fully connected layer. Neurons in this layer connect to all activating neurons in the previous layer [15]. In this architecture, we extend the CNN by adopting Adagrad as an optimizer because it has an advantage in dividing the learning rate into small parts so that the training process runs faster [16].
In developing the architecture, we adopted several related works, including the work of Peryanto et al. [14] regarding the use of the convolutional neural network algorithm for the classification method. As well as to speed up the model training process we use Adagrad as an optimizer from Zhang et al. [16]. This concept is the novelty of the model that we propose to increase the accuracy value of the selector component process in determining pattern compatibility as a recommendation model. Pattern matching process mechanisms are defined based on site-specific characteristics with targets to increase yield productivity.
3.2 Process mechanism
In addition, the process mechanism of the proposed system architecture can be seen in Figure 2.
Exploratory data analysis is a step to find out the characteristics of a data, data distribution and general description of the data that can be represented in graphical form so that it is easy to understand. This stage consists of 3 main processes, namely data understanding which is used to understand the characteristics of the data used, then the data visualization process to display the features possessed by the crop recommendation data in graphical form, the last is the data analysis process, namely displaying correlation data, displays data in the form of a heatmap and displays data statistically.
The data preparation stage is preparing data before the model training process is carried out. This stage consists of 4 processes: data cleaning, selecting labels and features, normalization and split data train, and data testing. The data cleaning process in this paper is to check data that has missing values and also remove the unused features. The select label and feature process is carried out to encode the label column in the crop recommendation dataset. The normalization process is carried out by applying the min max scaler method, and the last is the process of splitting the train data and test data, namely dividing the dataset into training data and test data by applying a ratio of 80:20.
Figure 2. The process mechanism of the recommendation system
The define model stage is carried out to apply the algorithm to the deep learning model. The algorithm adopted in our model is CNN (Convolutional Neural Network), the layer used to design the system architecture can be seen in Figure 1. The system architecture consists of four layers: the convolution 1D layer, the global average pooling 1D layer, the dropout layer, and the application of a dense layer. In addition, the application of the type and number of layers is adjusted to the type of data used and the accuracy results have the best value during the model training process. Furthermore, there are two activation functions implemented in several layers, namely the Relu and Softmax activation functions.
The model training stage is the stage for training the model, which consists of defining the function and the process of training the model or algorithm used. The function definition process is carried out to create the necessary functions during the model training process, for example by creating a callback function that stops training if certain conditions are met. In the training stage of this model, the Adagrad optimizer (Adaptive gradient) is used with a learning rate of 0.1, loss accuracy using sparse categorical crossentropy, and an epoch of 1000 and 55 steps per epoch. The model evaluation stages in this paper use the confusion matrix methods to calculate values of accuracy, precision, f1 score, and recall. The confusion matrix is selected as the evaluation metric because it has a holistic approach it shows how many predictions are correct and incorrect per class, and represents the prediction summary in matrix form. It helps in understanding the classes that are being confused by the model as other classes. This work uses many classes, not only it can show how well the model can perform generally, but also show the performance of the model in recognizing patterns in each class. A confusion matrix is a tool used for visual evaluation in machine learning. Each column of the confusion matrix represents the predicted class results, while the rows represent the actual class results so that all possibilities can be calculated in the classification problem. The formula used to calculate accuracy, precision, recall and f1-score values can be seen in Eq. (1), Eq. (2), Eq. (3) and Eq. (4) [17].
Accuracy $=\frac{T P+T N}{T P+T N+F P+F N}$ (1)
Precision $=\frac{T P}{T P+F P}$ (2)
Recall $=\frac{T P}{T P+F N}$ (3)
$F 1-$ Score $=\frac{2 x \text { Recall } x \text { Precision }}{\text { Recall }+ \text { Precision }}$ (4)
4.1 Experiment data
The experiment used a secondary dataset and it was obtained from Kaggle with the title "Crop Recommendation Dataset", uploaded by Atharva Ingle and published in 2021 (https://bit.ly/3uaeGB). This data set augments available data sets of rainfall, climate, and fertilizer data in India. Some features such as N, P, and K are dropped in the data preparation process, due to data limitations in the evaluation data, which only has three features, namely temperature, humidity, and rainfall, so during the process of data preparation, features N, P, and K are removed or dropped so that they match the evaluation data obtained from the used dataset. The dataset is divided into training data and testing data by applying a ratio of 80:20. The dataset used in this paper has seven columns or features, as can be seen in Table 1. The dataset used in this experiment has 22 labeled plant types that will be recommended later and 2200 data samples. The types of labels in the crop recommendation dataset can be seen in Figure 3.
The evaluation data in this experiment came from the Central Bureau of Statistics for the City of Tasikmalaya, West Java, Indonesia (https://bit.ly/3VjWVvf). The rainfall, temperature, and humidity data for Tasikmalaya area was taken in 2021 from January until December. The details of the data used in the evaluation process can be seen in Table 2.
Table 1. Features of crop recommendation dataset
|
No. |
Features Name |
Description |
|
1. |
N |
The ratio of nitrogen in the soil |
|
2. |
P |
The ratio of phosphor in the soil |
|
3. |
K |
The ratio of potassium in the soil |
|
4. |
Temperature |
The temperature in celcius |
|
5. |
Humidity |
Relative Humidity in % |
|
6. |
Ph |
The value of soil ph |
|
7. |
Rainfall |
Rainfall in mm |
Table 2. Tasikmalaya city temperature, humidity and rainfall data for 2021
|
Month |
Temperature (℃) |
Humidity (%) |
Rainfall (mm) |
|
January |
24.9 |
79.0 |
807.7 |
|
February |
24.3 |
77.0 |
280.4 |
|
March |
25.3 |
78.0 |
546.3 |
|
April |
25.5 |
82.0 |
192.8 |
|
May |
25.4 |
83.0 |
131.5 |
|
June |
25.2 |
85.0 |
347.6 |
|
July |
25.1 |
83.0 |
137.6 |
|
August |
24.4 |
86.0 |
250.6 |
|
September |
24.4 |
87.0 |
275.3 |
|
October |
24.9 |
88.0 |
241.9 |
|
November |
24.7 |
92.0 |
491.9 |
|
December |
25.1 |
90.0 |
413.7 |
Figure 3. Labels of crop recomendation dataset
4.2 The evaluation of learning model
With the implementation of the Adagrad optimizer, the CNN algorithm has a very good performance for the plant recommendation model. The model has 90% accuracy values from the first 30 epochs. The model reaches a diminishing return phase in the 75th epoch, where the model no longer experiences a significant increase in accuracy. The final accuracy obtained by the model is 0.9364% validation accuracy. The CNN model accuracy graph can be seen in Figure 4. Along with the fast accuracy value, the model loss value decreased significantly in the first 50 epochs until the last model loss value was 0.1860 loss validation, as seen in Figure 5.
The model evaluation stage in this experiment uses a confusion matrix and f1-score. The confusion matrix is used to help understand the process of prediction results per class, so it can show how well the model generally performs, but show the model performance also, in recognizing each class pattern. High accuracy does not always indicate a good model, it could be that the model is only good for the majority class and makes many wrong predictions for the minority class, therefore we also use precision, recall, and f1-score. Precision and recall values show the performance of the True Positive (TP) model against False Positive (FP) and False Negative (FN) values. F1-score is a metric that takes into account both precision and recall. F1 score is the harmonic mean of precision and recall and is a better measure than accuracy. Based on the results in Tables 3 and 4, the accuracy values obtained, both train and validation accuracy values. In addition, the results obtained are high precision and recall values, which means that the model applied is quite good. These results certainly affect the f1-score value obtained; namely, the f1-score value in this experiment has a good score, which is equal to 0.9430.
The results in Table 3, the model has a high accuracy and a low loss value, indicating that there is no underfit and the model is successful in extracting patterns from the given dataset. Accuracy and loss values in the validation section that resemble accuracy and loss values in the test, show that there is no overfit experienced by the model. The result in Table 4. shows high precision, recall, and f1-score, indicating the model performs equally in majority and minority classes. The model can be said to be able to provide good performance if implemented in the real world with roughly give 9 out of 10 correct recommendations. The limitation of the current model is that the recommendations given are still limited to 22 plant species. The model can still be upgraded by adding a new dataset that includes more plants to recommend, and can still provide more accurate recommendations.
The CNN model used in the experiment has a quite high accuracy in the plant recommendation system in a region. Therefore, the CNN model that has been created in our model is not only evaluated with a confusion matrix or f1-score but the model evaluation process is complemented by applying real data obtained from the Central Bureau of Statistics for the City of Tasikmalaya in 2021. In this evaluation process, we apply several features that are used according to the specific characteristics of the location, namely temperature, humidity, rainfall, and pH values which are given a value range of 3.5 to 9.5. The results of the evaluation process with real data show plant recommendations every month, from January to December. Figure 6 shows the generalization of the evaluation results of the proposed model based on real data obtained from the Central Bureau of Statistics for the City of Tasikmalaya in 2021. The features used follow each region's specific characteristics for each month. The graph in Figure 6 shows the results of the plant recommendation system from January to December, and the graph shows the number of plant species recommended each month. Furthermore, the graph in Figure 6 in July has the most plant recommendations among other months, namely six types of plants recommended by the system, namely pigeon pea, grapes, bananas, jute, and cotton. Meanwhile, recommendations for plant types that only recommend one type of plant, namely rice plants, are found in January, February, March, June, August, and September. Rainfall in April, May, and July drops below 200 mm. The model provides various plant recommendations to be planted at these times depending on the Ph content in the soil. From October to December, the model provides plant recommendations for jute, grape, and papaya for soils with Ph values of 6.0 and 6.5.
In the evaluation, the deep learning model that has been trained is tested on real data to see the plant recommendations given by the model. Most of the models provide recommendations for rice plants to be planted in the Tasikmalaya area which is a natural thing to grow in tropical areas and rice is the most yields in the area. However, this result is still not 100 percent certain, therefore further research is needed to test the correctness of the model directly in the field.
Figure 4. The graph of CNN training and validation accuracy values
Figure 5. The graph of CNN training and validation loss
Table 3. Accuracy dan loss values of model
|
Accuracy Value |
Loss Value |
||
|
Train |
Validation |
Train |
Validation |
|
0.9392 |
0.9364 |
0.1610 |
0.1860 |
Table 4. Precision, recall dan F1-score
|
Precision |
Recall |
F1-Score |
|
0.9423 |
0.9436 |
0.9430 |
Figure 6. The graph of evaluation model implementation
5.1 Internal validity
Even though carried out carefully at the data preparation stage, still does not guarantee that no problems arise at this stage. The prepared data can have data integrity threats, and there is a threat that the contents of the data change as a whole. Some columns were deleted at the data preparation stage to match the expected input. This stage can affect the results obtained.
The performance of the proposed architecture is very influential from the depth of the structure and its constituent functions. There is a threat that the proposed architecture is not the best architecture for this research area. Further research is needed to validate the threat.
5.2 External validity
The dataset used for research is an augmentation dataset. The data in the dataset is not completely real data, some of the data is resampled data to balance the contents of the dataset. Even though using resampling techniques for data augmentation, some of the data is still not the result of actual data collection in the field. There will be a threat that the collected data does not describe the pattern of the recommended plants.
The model is only trained and evaluated with one dataset. The patterns studied by the classification model are limited to the 22 available plant species. If given an input pattern of plants that are not recognized, the model will still recommend the 22 plants that have been studied, even though the recommendations are not certain. In addition, the dataset used in the training was enhanced with the augmentation process that oversampled from the original one to multiply the number of datasets. The model training that uses augmentation data can produce a good performance, but because it derivated data, there is a possibility that the model overfitting occurs during training so the model is probably wrong when giving recommendations on new data, and the pattern is not recognized by the model.
This paper introduces a smart model for recommendation systems in agriculture, namely, a recommendation system for selecting suitable plant types for planting in an area. The recommendation model was developed based on expanding the deep learning model by adopting the Convolutional Neural Network algorithm enriched with Adagrad as an optimizer because it has the advantage of dividing the learning rate into small parts so that the training process can run quickly. As a form of comprehensive and in-depth evaluation, we define two evaluation process mechanisms. The first evaluation is an evaluation of the learning model using the confusion matrix and f1-score; the results show that the model succeeded in finding suitable plant recommendation patterns of a suitable plant to be planted. The model gives a final accuracy value of 93.64%, 94.23% precision, 94.36% recall, and 94.30% f1-score. The second evaluation is an evaluation of the application of the model using real data from a city in Indonesia, the results of this second evaluation can be concluded that the system has been able to provide relevant recommendations based on the characteristics of the context that apply each month, namely regional conditions (temperature, humidity, and rainfall rain) and the Ph value of the area.
This system can minimize losses and maximize yield levels through dynamic recommendations based on the learning model that has been developed. However, applying deep learning models to recommend plants suitable for planting in an area still requires further refinement, evaluation, and validation processes, including adding other datasets to enrich system knowledge, optimizing accuracy using other learning models, and integrating with many existing systems that already exists for automation and expansion of the scope of use, implementation in the IoT field, and so on. So, it is hoped that this model can be applied to various regional characteristics with each diversity of nature and circumstances.
This investigative project was supported by the Institute for Research, Community Services and Education Quality Assurance, Siliwangi University, and Ministry of Education, Culture, Research and Technology of the Republic of Indonesia (Grant No.: 250/UN58.21/PP/2022).
[1] Meshram, V., Patil, K., Meshram, V., Hanchate, D., Ramkteke, S.D. (2021). Machine learning in agriculture domain: A state-of-art survey. Artificial Intelligence in the Life Sciences, 1: 100010. https://doi.org/10.1016/j.ailsci.2021.100010
[2] Gaffney, J., Tibebu, R., Bart, R., Beyene, G., Girma, D., Kane, N.A., Mace, E.S., Mockler, T., Nickson, T.E., Taylor, N., Zastrow-Hayes, G. (2020). Open access to genetic sequence data maximizes value to scientists, farmers, and society. Global Food Security, 26: 100411. https://doi.org/10.1016/j.gfs.2020.100411
[3] Rajak, R.K., Pawar, A., Pendke, M., Shinde, P., Rathod, S., Devare, A. (2017). Crop recommendation system to maximize crop yield using machine learning technique. International Research Journal of Engineering and Technology, 4(12): 950-953.
[4] Yanuari, Y., Husada, M.G., Utami, D.B. (2018). Aplikasi rekomendasi jenis tanaman pangan menggunakan metode simple additive weighting SAW. JOINTECS Journal of Information Technology and Computer Science, 3(1): 1-8. https://doi.org/10.31328/jointecs.v3i1.495
[5] Mala, N.M., Muhibuddin, A., Sifaunajah, A. (2018). Sistem pendukung keputusan pemilihan penggunaan jenis tanaman dengan metode analytic hierarchy process (AHP). Saintekbu, 10(1): 64-74. https://doi.org/10.32764/saintekbu.v10i1.163
[6] Wibowo, M., Ramadhani, R. (2021). Perbandingan metode klasifikasi data mining untuk rekomendasi tanaman pangan. Jurnal Media Informatika Budidarma, 5(3): 913-921. http://dx.doi.org/10.30865/mib.v5i3.3086
[7] Mythili, K., Rangaraj, R. (2021). Crop recommendation for better crop yield for precision agriculture using ant colony optimization with deep learning method. Annals of the Romanian Society for Cell Biology, 25(4): 4783-4794.
[8] Rehman, H.U., Anwar, S., Tufail, M. (2020). Machine vision based plant disease classification through leaf imagining. Ingénierie des Systèmes d’Information, Vol. 25, No. 4, pp. 437-444. https://doi.org/10.18280/isi.250405
[9] Mythili, K., Rangaraj, R. (2021). Deep learning with particle swarm based hyper parameter tuning based crop recommendation for better crop yield for precision agriculture. Indian Journal of Science and Technology, 14(17): 1325-1337. https://doi.org/10.17485/IJST/v14i17.450
[10] Vignesh, K., Askarunisa, A., Abirami, A.M. (2023). Optimized deep learning methods for crop yield prediction. Computer Systems Science and Engineering, 44(2): 1051-1067. http://dx.doi.org/10.32604/csse.2023.024475
[11] Sehkammal, A. (2021). Analysing the accuracy of crop yield prediction using deep learning algorithm. International Journal for Research in Applied Science and Engineering Technology, 9(9): 201-227. https://doi.org/10.22214/ijraset.2021.37911
[12] Alwanda, M.R., Ramadhan, R.P.K., Alamsyah, D. (2020). Implementasi metode convolutional neural network menggunakan arsitektur lenet-5 untuk pengenalan doodle. Jurnal Algoritme, 1(1): 45-56. https://doi.org/10.35957/algoritme.v1i1.434
[13] Hsiao, T.Y., Chang, Y.C., Chou, H.H., Chiu, C.T. (2019). Filter-based deep-compression with global average pooling for convolutional networks. Journal of Systems Architecture, 95: 9-18. https://doi.org/10.1016/j.sysarc.2019.02.008
[14] Peryanto, A., Yudhana, A., Umar, R. (2020). Klasifikasi citra menggunakan convolutional neural network dan k fold cross validation. Journal of Applied Informatics and Computing, 4(1): 45-51. https://doi.org/10.30871/jaic.v4i1.2017
[15] Abdullah, A., Prakoso, S.A., Taruk, M. (2022). Desain absensi mahasiswa dengan tanda tangan digital terverifikasi berbasis convolutional neural network di masa pandemi covid-19. Jurnal Rekayasa Teknologi Informasi (JURTI), 6(1): 82-90. https://doi.org/10.30872/jurti.v6i1.7639
[16] Zhang, N., Lei, D., Zhao, J.F. (2018). An improved Adagrad gradient descent optimization algorithm. In 2018 Chinese Automation Congress (CAC). IEEE, pp. 2359-2362. https://doi.org/10.1109/CAC.2018.8623271
[17] Setiawan, W., Pranoto, N., Huda, K. (2020). Employee performance evaluation decision support system with the SMART (Simple multi-attribute rating technique) method. Jurnal RESTI (Rekayasa Sistem Dan Teknologi Informasi), 4(1): 50-55. https://doi.org/10.29207/resti.v4i1.1384